Analysis of Problems PowerPoint Diagrams: Untangle Causes, Forge Solutions


Type: PowerPoint Diagrams template
Category: Relationship, Illustrations
Sources Available: .pptx
Product ID: PD00167
Template incl.: 16 editable slides
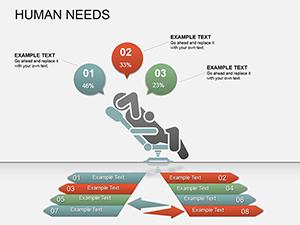
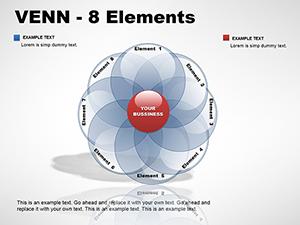
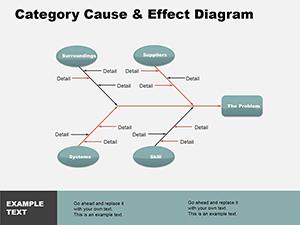
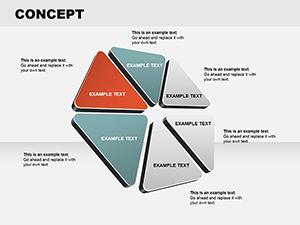
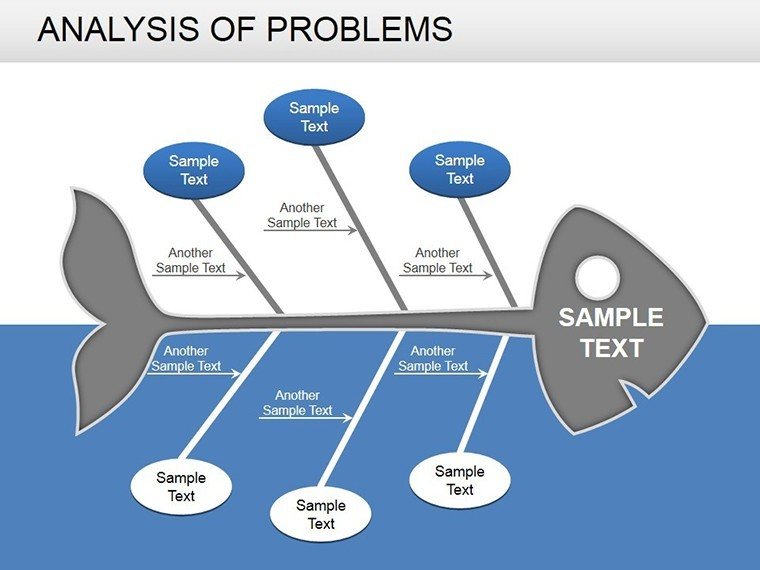
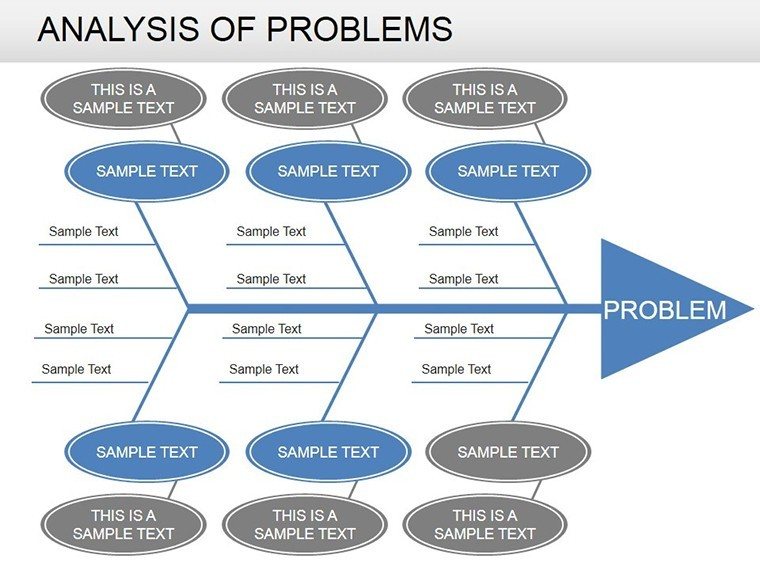
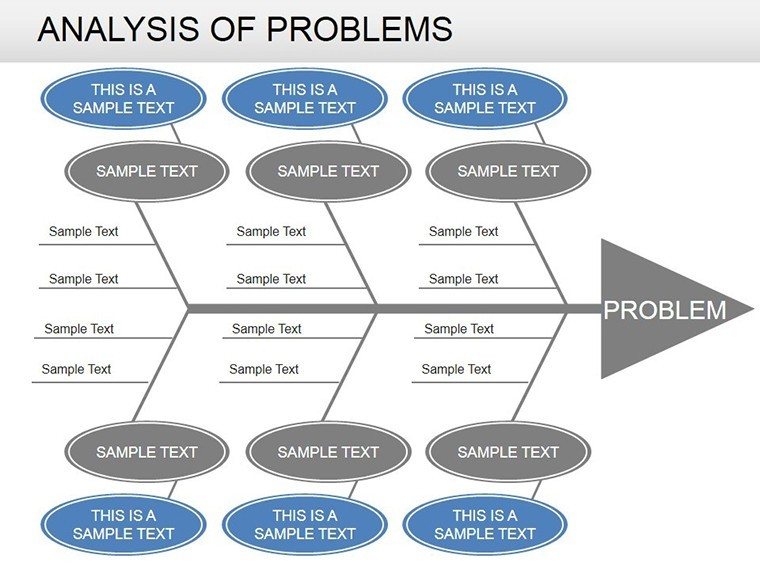
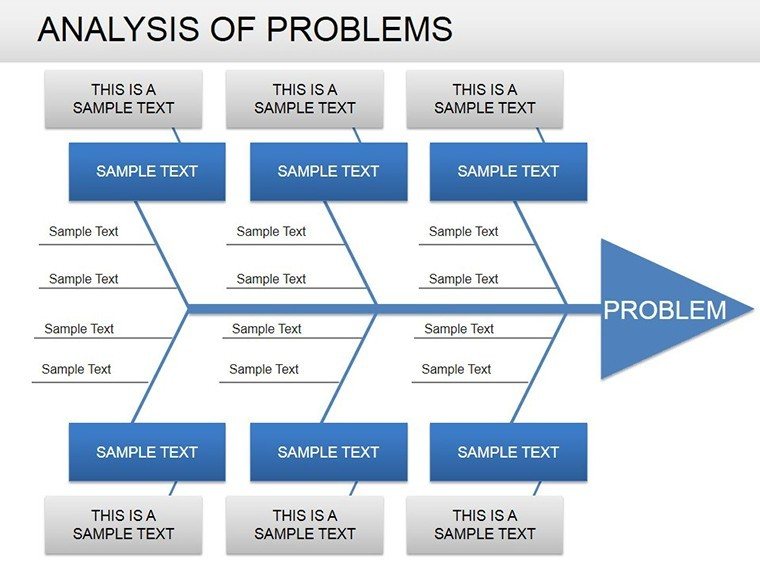
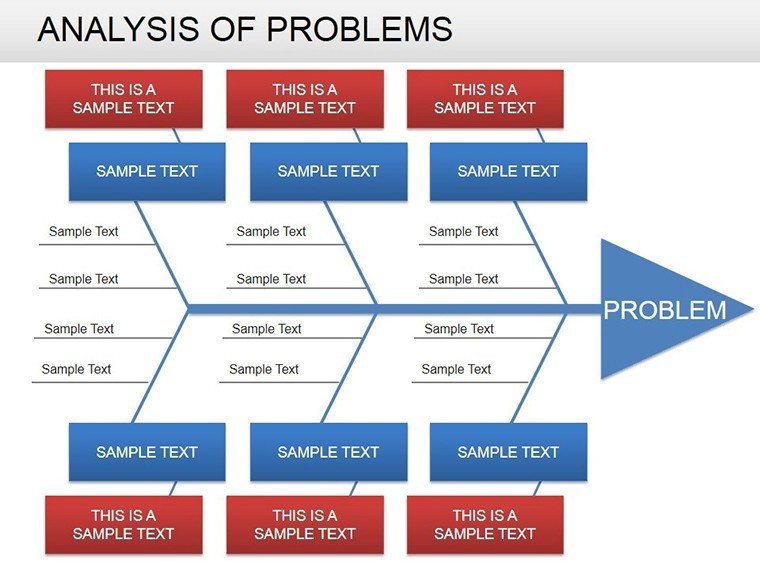
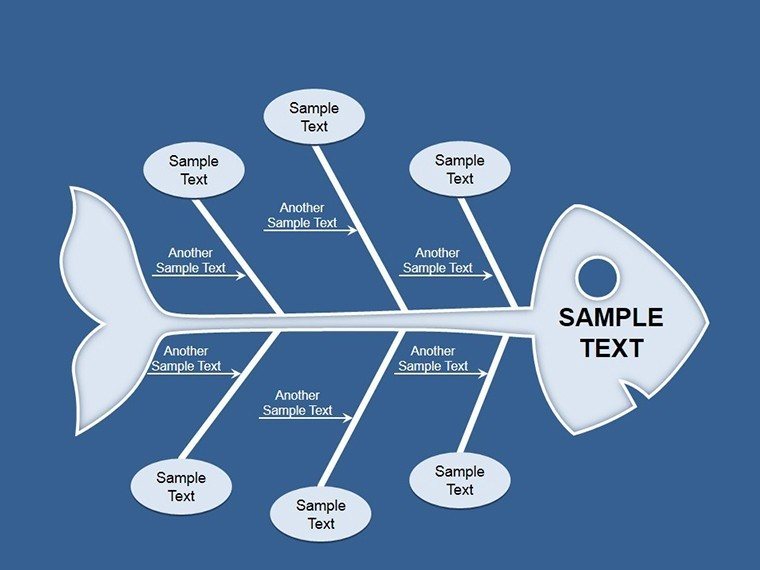
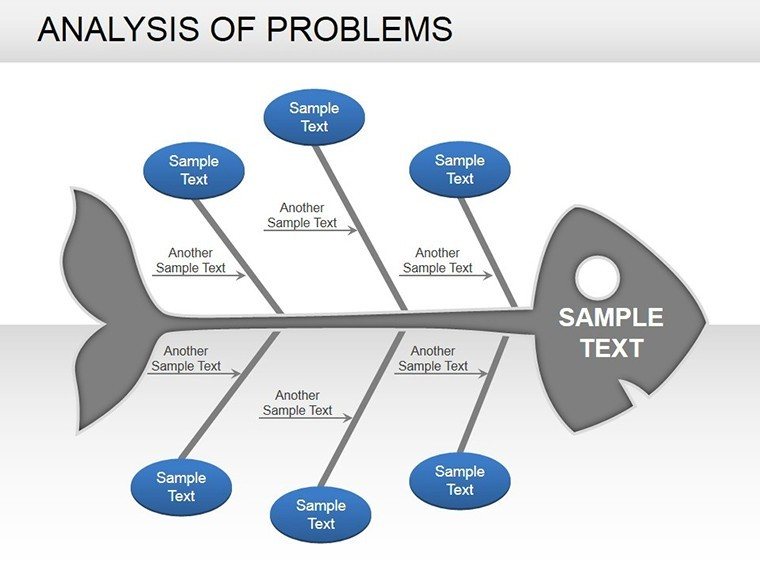
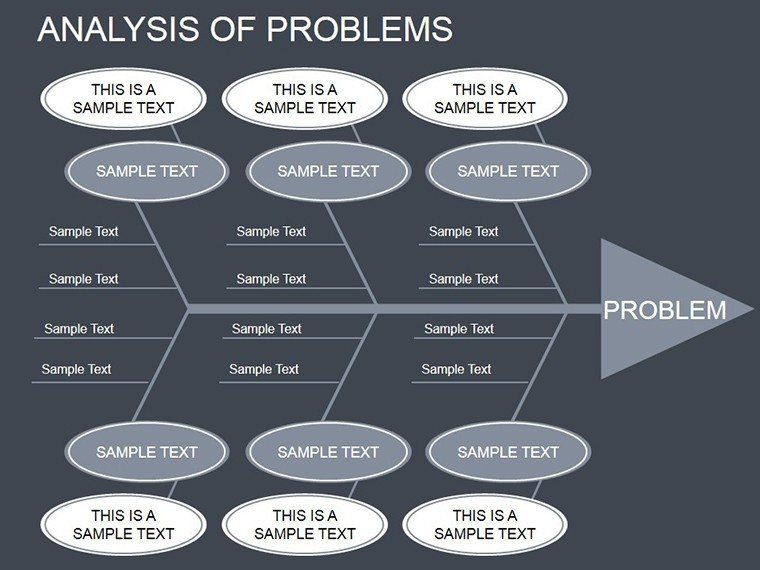
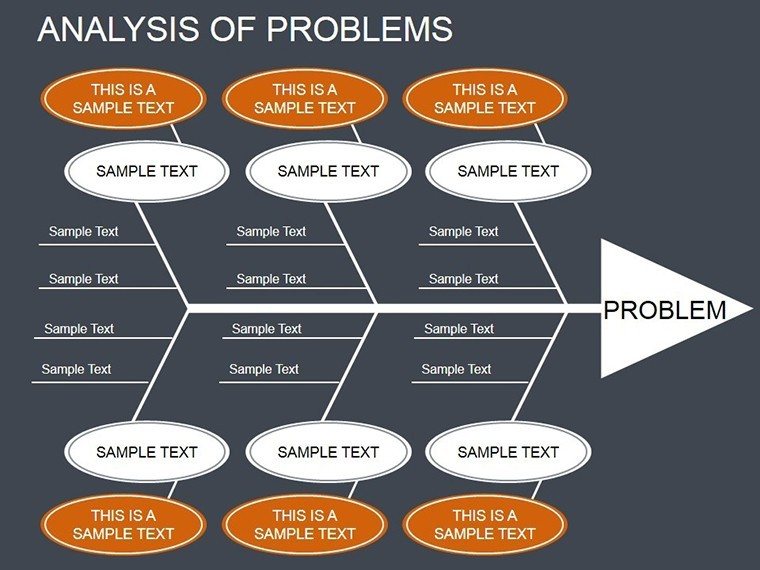
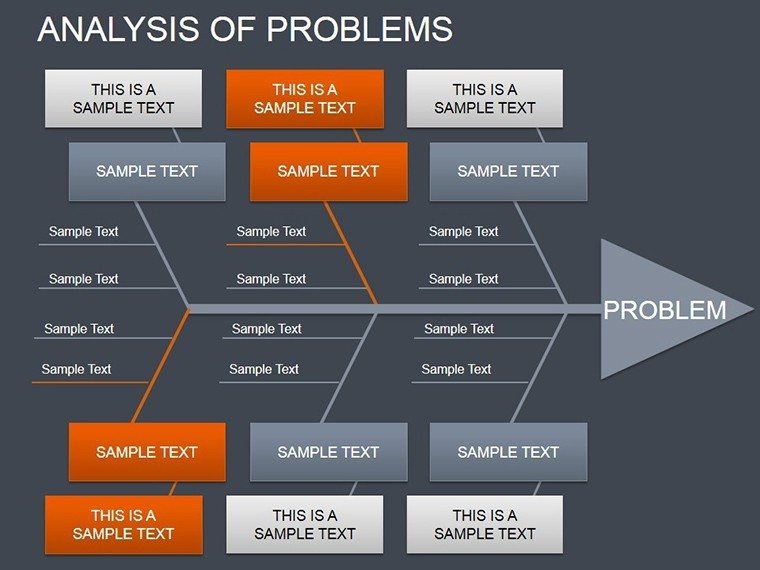
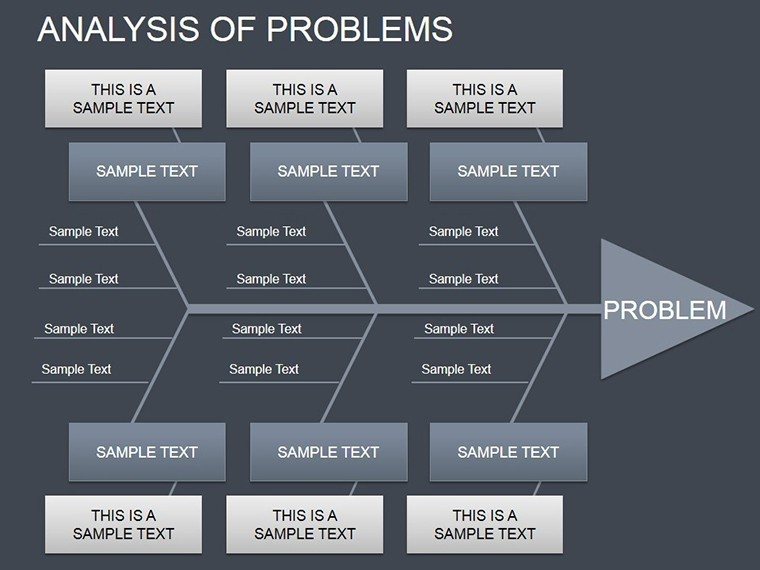
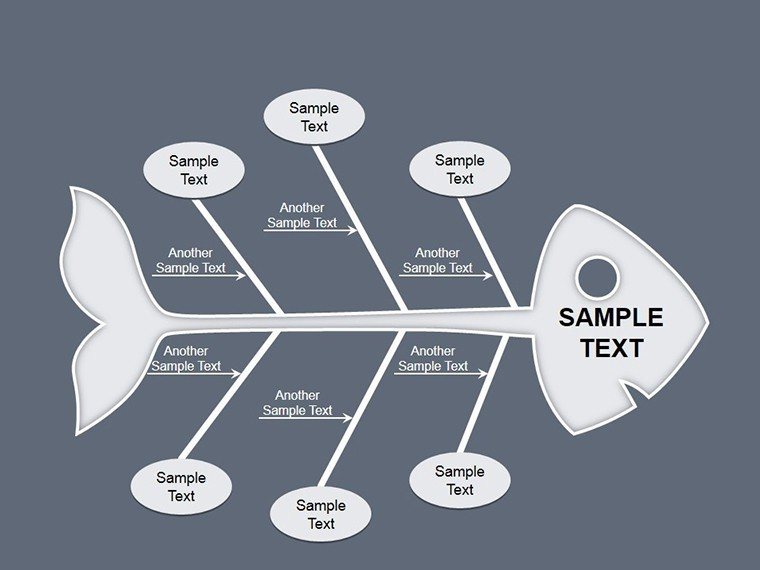
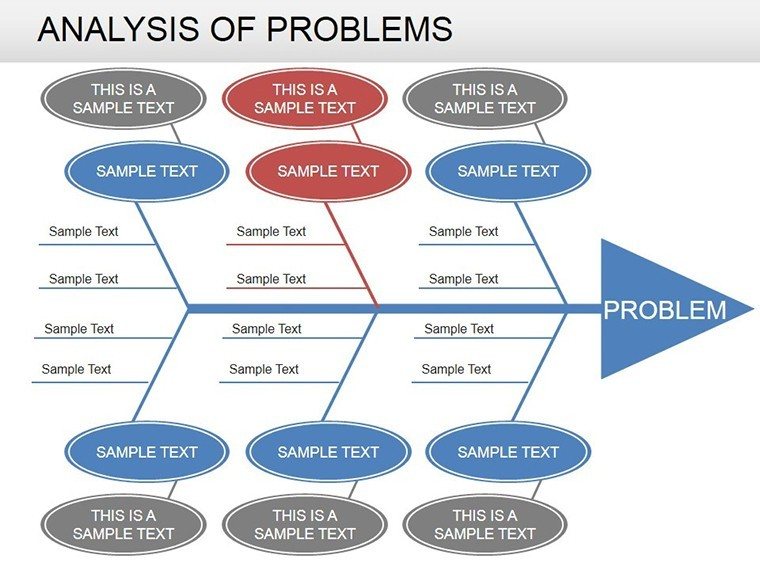
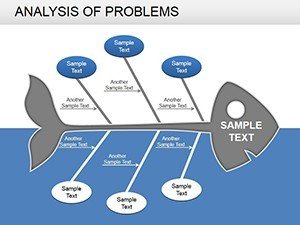
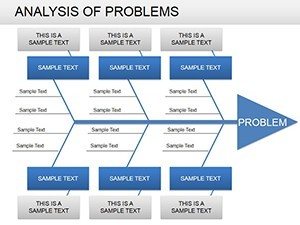
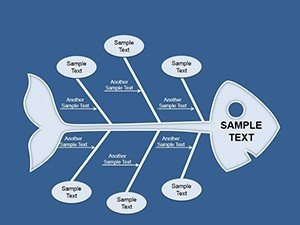
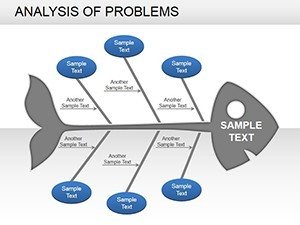
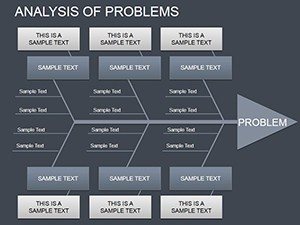
Problems don't announce their roots - they hide in plain sight, waiting for the right diagram to expose them. Our Analysis of Problems PowerPoint Diagrams template, boasting 16 insightful slides, arms investigators, strategists, and troubleshooters with the visuals to dissect dilemmas. From cause-effect fishbones to logic circuit maps, it's your blueprint for turning "why" into "how fixed."
Perfect for root-cause sessions in manufacturing or crisis comms in PR, these diagrams adapt to any knotty narrative. Modeled after Six Sigma tools, they're fully tweakable, letting you layer incident data over branching paths or circuit-like sequences. A project lead at Toyota-esque ops used Slide 10's effect tree to pinpoint assembly flaws, averting recalls and reclaiming trust.
Editable elegance meets analytical depth, ensuring your reports resonate rather than ramble.
Essential Features for Diagnostic Depth
Engineered for clarity in confusion, these standouts solve presentation pains.
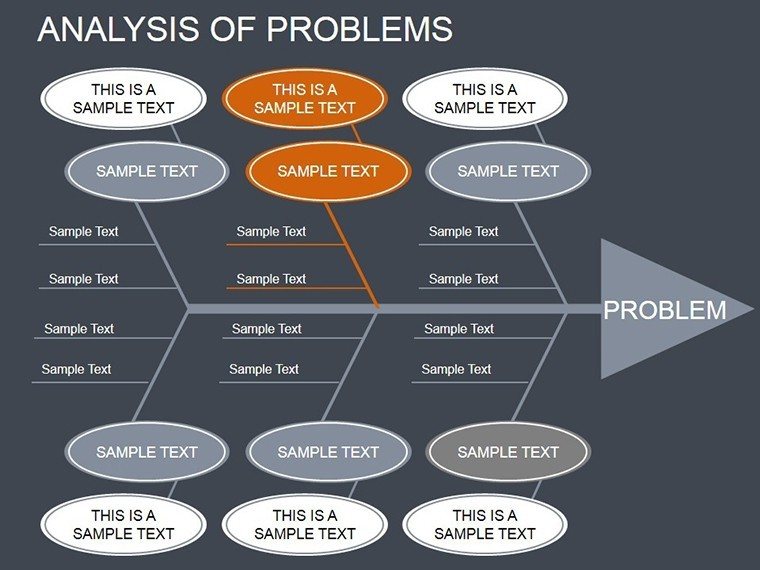
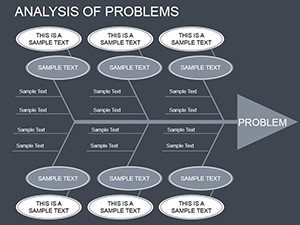
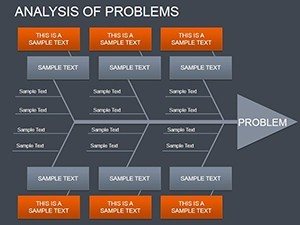
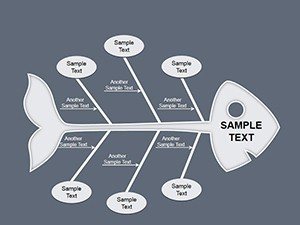
- Cause-Effect Variety: Fishbones, arrows, trees for multi-level probes.
- Logic Circuit Builds: Modular blocks for event relationships.
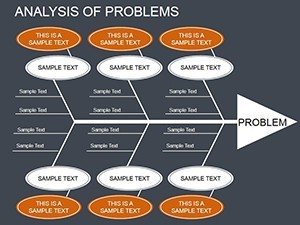
- Adaptive Icons: 30+ symbols (bulbs for ideas, chains for links) to symbolize steps.
- Reveal Animations: Sequential pops to mimic investigative unfolds.
Superior to ad-hoc sketches, they professionalize probes effortlessly.
Navigating Use Cases: From Crisis to Clarity
In healthcare, a fishbone slide traces patient delays to staffing overlaps. Customize branches with shift logs for targeted reforms.
For legal reviews, logic circuits connect evidence threads, clarifying arguments. In finance, effect diagrams link market dips to policy shifts.
- Identify Core Issue: State the effect plainly.
- Branch Causes: Populate with contributors.
- Validate Visually: Adjust for hierarchies.
- Propose Paths: Animate resolutions.
Aligned with Kaizen principles, these illuminate iterative improvements.
Expert Edges for Sharper Solves
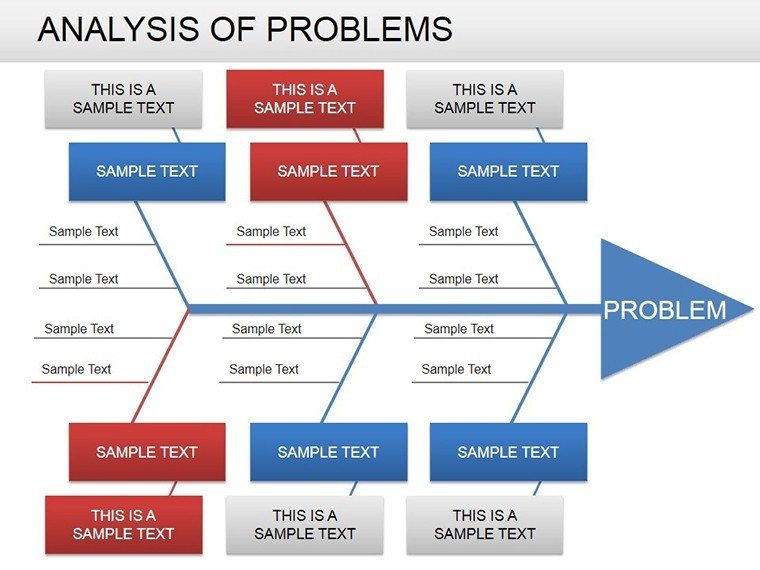
Color-code severity (amber for warnings) or hyperlink to evidence files. In an FDA probe parallel, this exposed supply flaws, streamlining compliance.
Surpass Simple Solutions
Plain tools falter on complexity; ours thrives with scalable, story-driven designs. Broad exports for team handoffs.
Decode disruptions decisively - acquire the Analysis of Problems PowerPoint Diagrams now and architect answers that stick.
Frequently Asked Questions
Q: Focus on cause-effect?A: Primarily, with extensions to logic flows.
Q: For team brainstorming?A: Ideal - editable for collaborative inputs.
Q: Animation support?A: Yes, for phased reveals.
Q: Format info?A: 16 .PPTX slides, multi-platform.
Q: Icon library size?A: 30+, thematic and expandable.