Swap Business PowerPoint Diagram Template


Type: PowerPoint Diagrams template
Category: Process, 3D, Cubes, Illustrations
Sources Available: .pptx
Product ID: PD00164
Template incl.: 16 editable slides
In the fast-paced world of business strategy, understanding how products swap hands - or how competitors maneuver for advantage - can mean the difference between leading the pack and trailing behind. Enter the Swap Business PowerPoint Diagram Template, a specialized toolkit with 16 editable slides tailored for dissecting exchange models and relationship matrices. Ideal for analysts, strategists, and execs navigating trade-offs in consumer goods or B2B swaps, this template turns opaque market interactions into transparent, actionable insights.
Envision a product manager at a tech firm using these diagrams to chart software licensing swaps against rivals' offerings, revealing untapped revenue streams. Or a retail consultant mapping inventory trades to optimize supply chains. Each slide is built to layer complexity gradually, starting with simple pairwise comparisons and building to multifaceted networks that capture the nuances of modern commerce.
Essential Features for Strategic Visualization
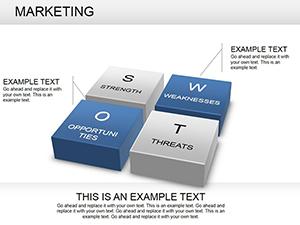
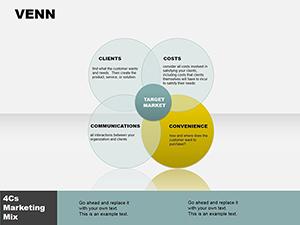
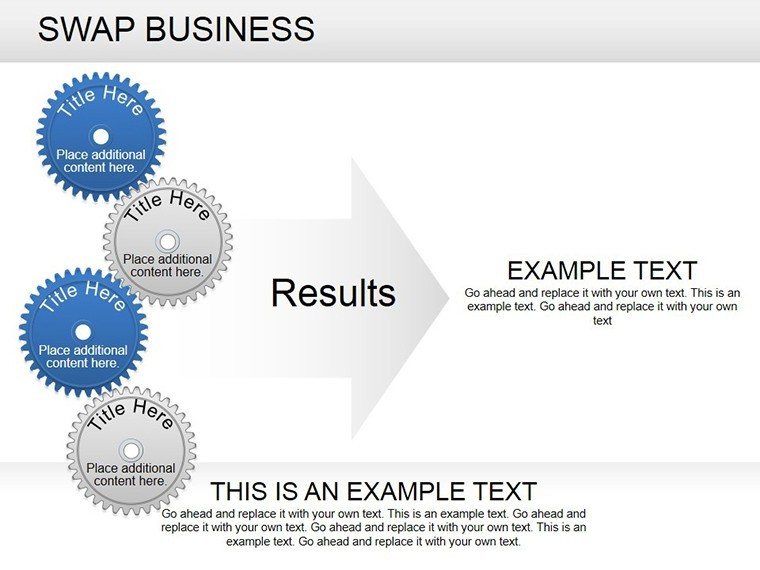
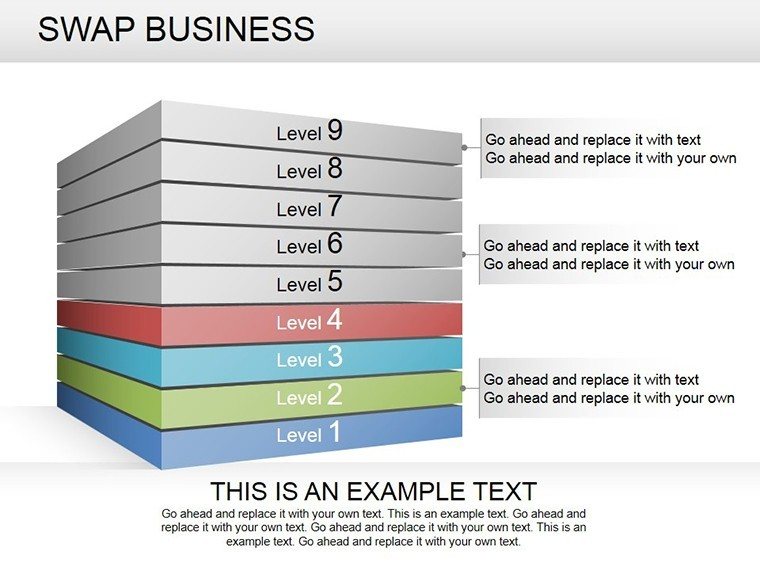
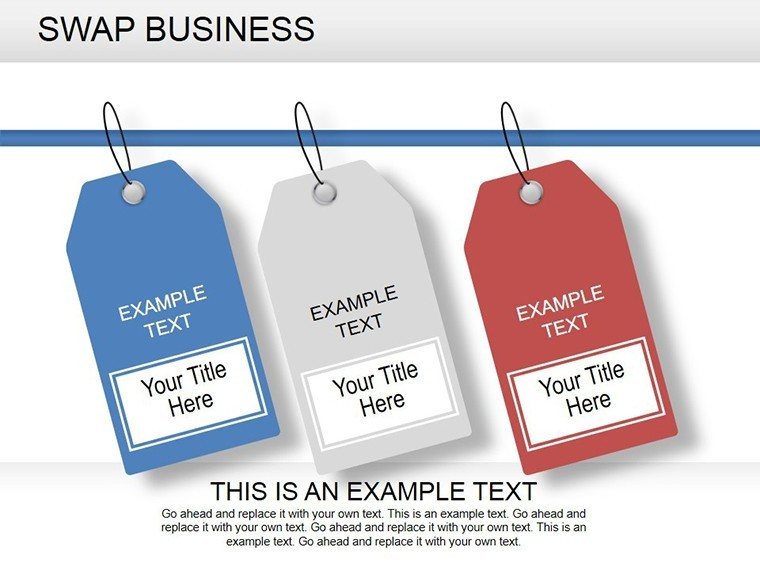
This template excels in its modular approach to competitor mapping, using 3D cubes and illustrative elements to add depth without overwhelming the viewer. Colors denote categories like strengths, weaknesses, or exchange values, making patterns pop at a glance. Fully vectorized, the designs scale for large screens or handouts, and they're grouped for effortless reconfiguration.
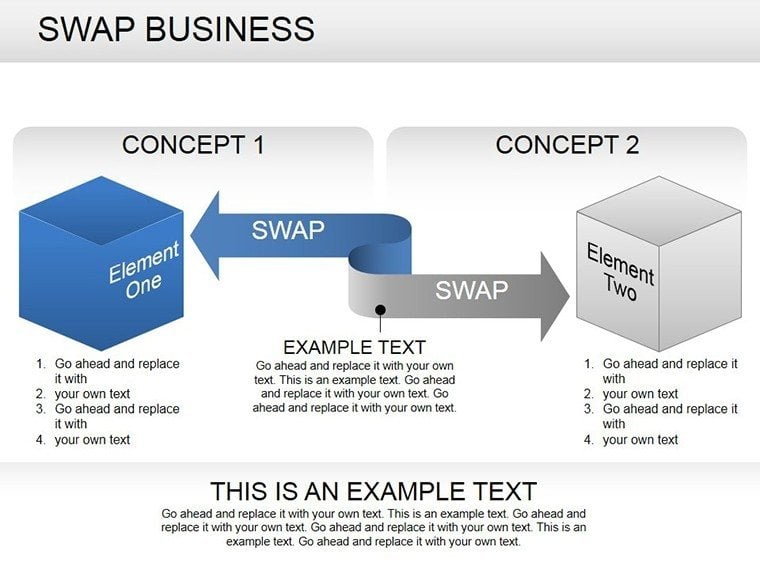
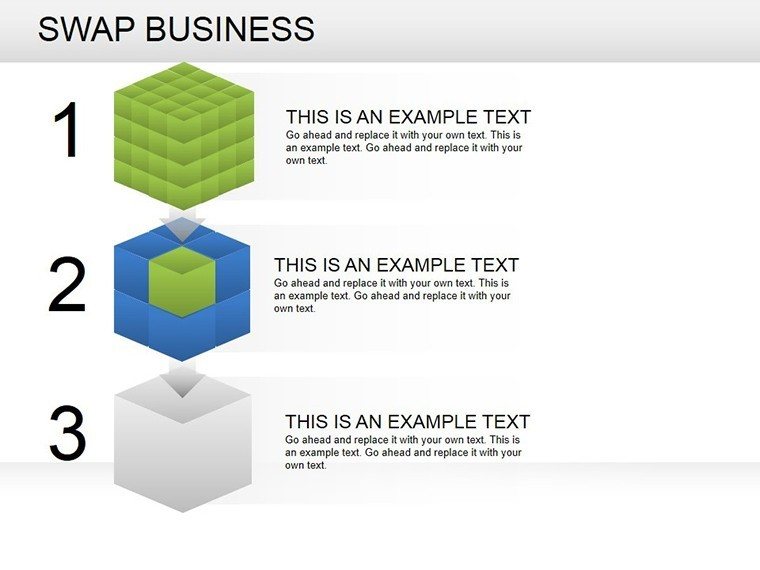
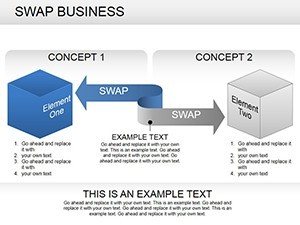
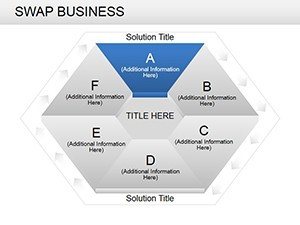
- 3D Cube Representations: Visualize multi-dimensional swaps, such as value-for-value trades in partnerships, with rotatable perspectives for emphasis.
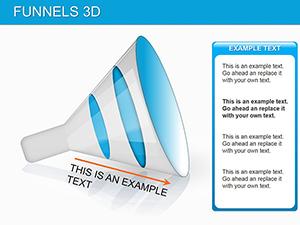
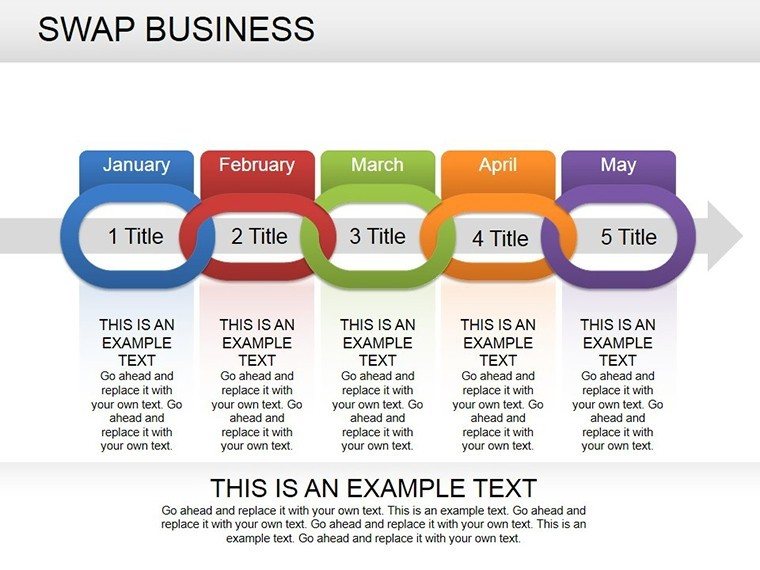
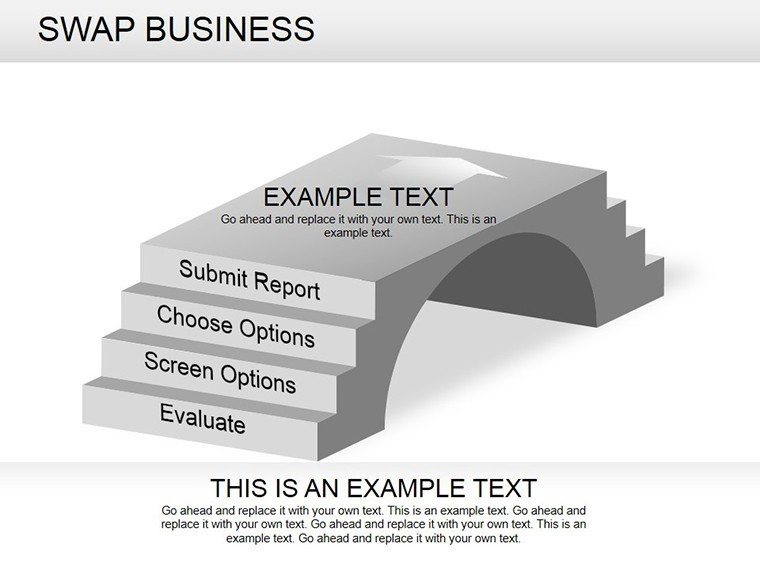
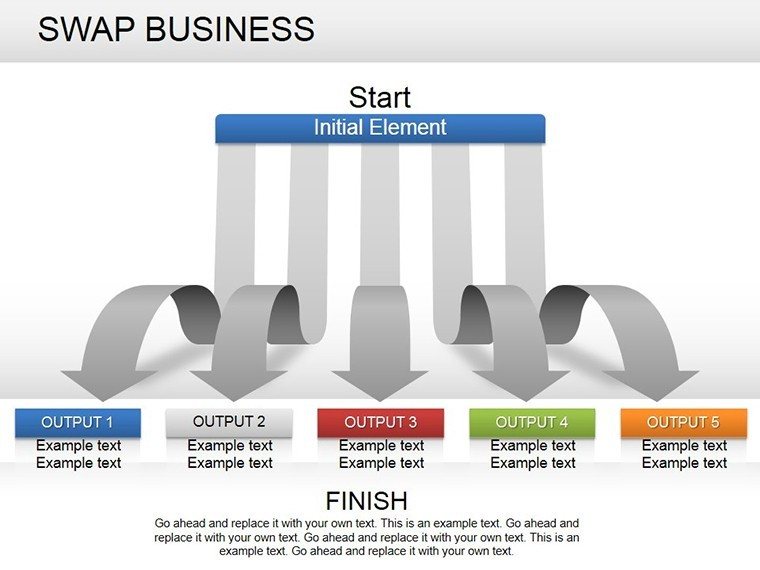
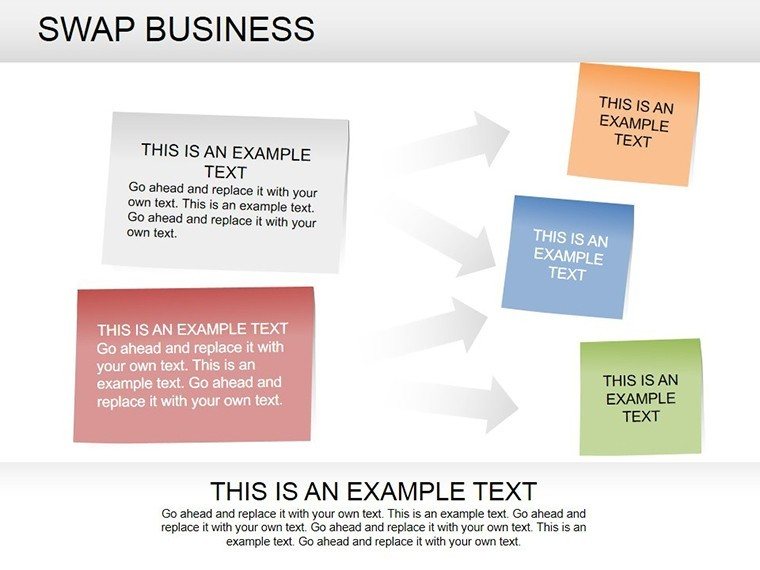
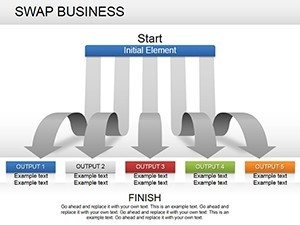
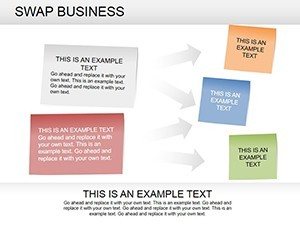
- Relationship Arrows: Directional links that indicate flow directions, perfect for tracing product lifecycles from acquisition to divestiture.
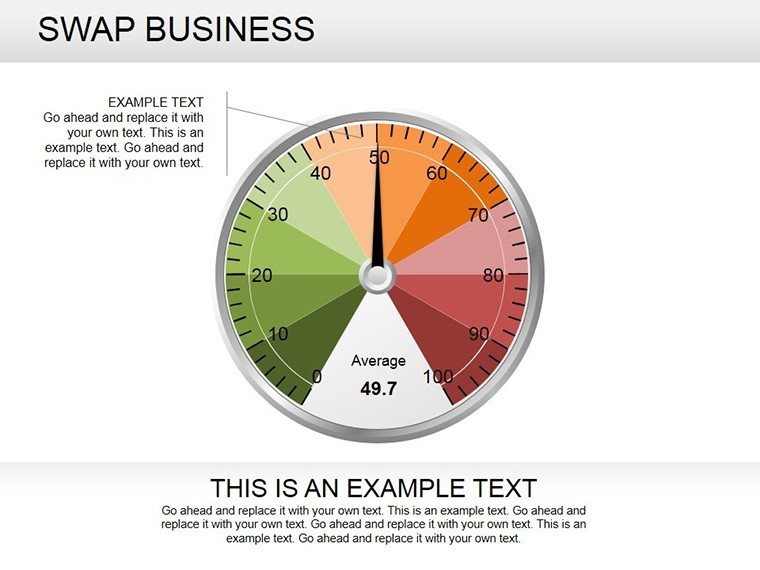
- Customizable Metrics: Embed placeholders for KPIs like market share or ROI, linking directly to your data sources for real-time updates.
Such features draw from established visualization techniques, akin to those in Porter's Five Forces analyses, ensuring your slides not only inform but provoke strategic discussions. The result is a deck that feels alive, inviting stakeholders to probe deeper into the "why" behind each swap.
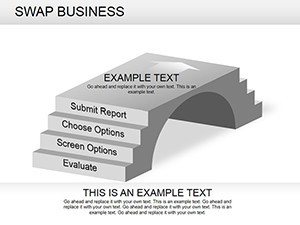
Navigating the Slides: From Basics to Breakthroughs
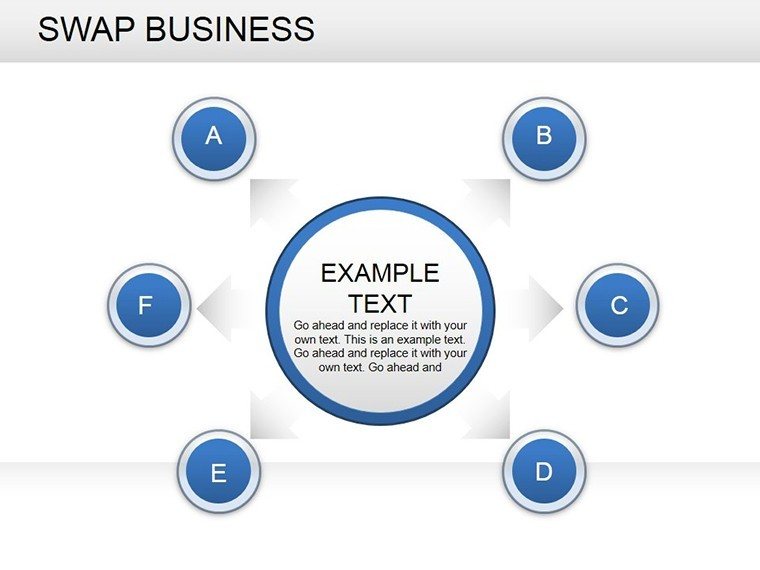
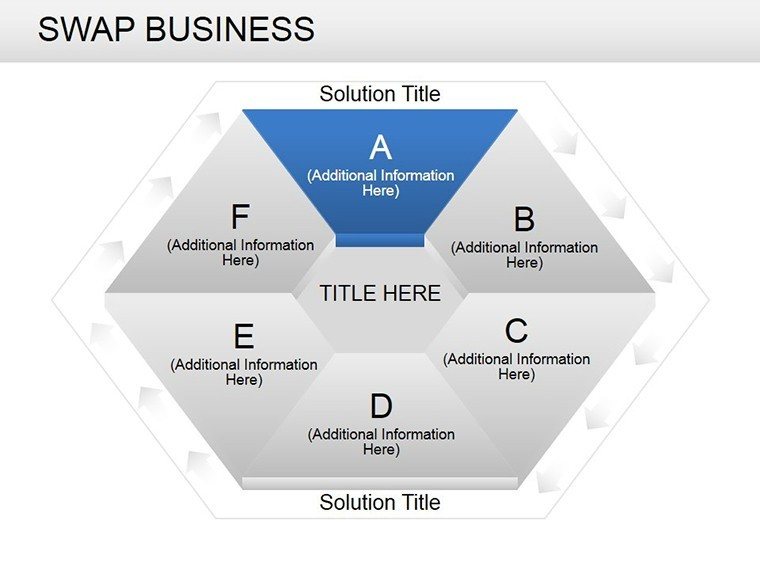
The 16 slides form a logical progression, empowering you to build comprehensive reports. Begin with Slide 1's overview cube, which categorizes core swap types - barter, reciprocity, or market-driven. Progress to Slides 4-8, where interconnected cubes model bilateral relationships, useful for due diligence in mergers.
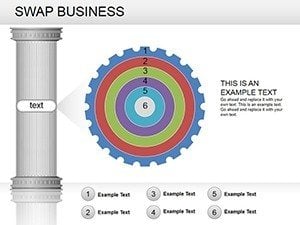
- Foundational Swaps (Slides 1-3): Single-entity diagrams to define terms, setting a shared vocabulary for your audience.
- Competitor Pairings (Slides 4-9): Dual-cube setups with bridging arrows, ideal for head-to-head product comparisons in sales pitches.
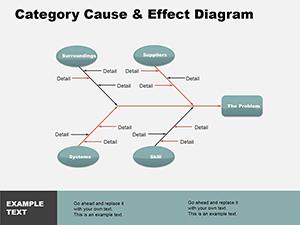
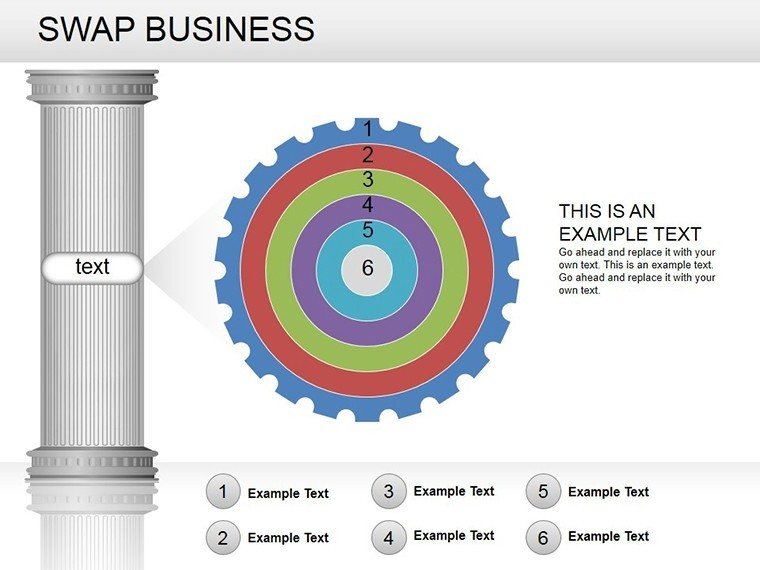
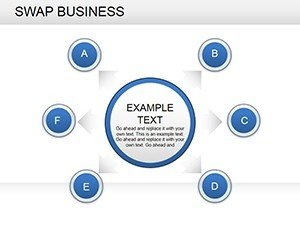
- Network Expansions (Slides 10-13): Multi-node webs for ecosystem overviews, like tracing alliances in the automotive parts industry.
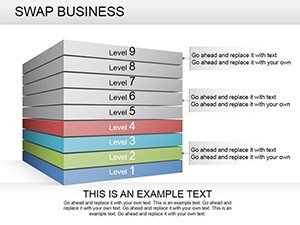
- Scenario Projections (Slides 14-16): Forward-looking matrices to simulate post-swap outcomes, aiding in risk assessment.
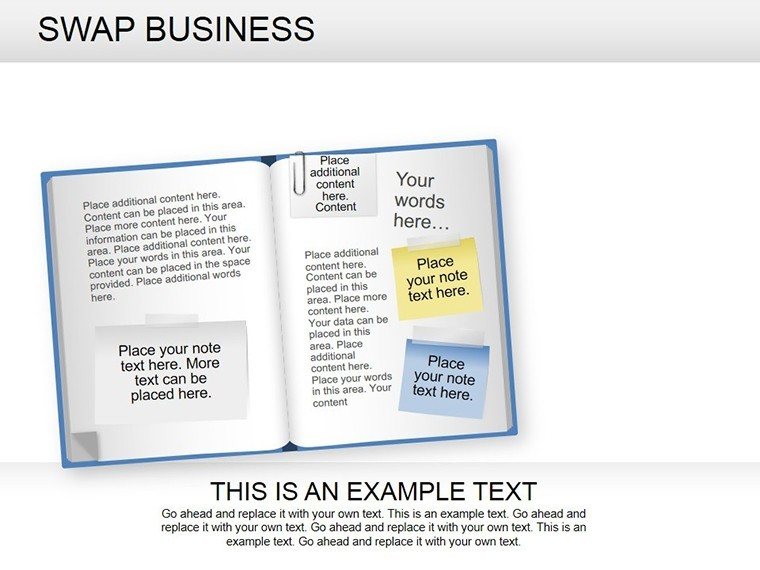
Editing is straightforward: Select a cube, adjust its face labels via text boxes, and recolor edges to signal urgency or opportunity. A venture capitalist might tweak Slide 11 to forecast startup equity swaps, turning abstract valuations into vivid scenarios that secure funding.
Applying Swaps in Key Business Contexts
From e-commerce platforms optimizing user trades to manufacturers negotiating component exchanges, this template adapts to diverse arenas. In consulting, deploy the network slides for client workshops, facilitating group mapping of supplier dependencies that uncover hidden efficiencies.
Take a logistics firm: By visualizing route swaps with carriers, they streamlined operations, much like how global players use similar tools to reroute amid disruptions. The diagrams' illustrative style softens dense data, making sessions collaborative rather than confrontational.
For deeper engagement, layer in subtle shadows on cubes to imply depth, or animate arrow paths to reveal sequences over time - transforming static slides into a narrative journey through market dynamics.
Expert Customization Strategies
Maximize value by aligning diagrams with your sector's lexicon: Swap "product" for "service" in consulting decks. Use PowerPoint's alignment grid for precision, and export to video for asynchronous reviews. Always iterate with audience feedback - does the swap flow intuitively? This reflective practice elevates your work from good to indispensable.
In a real pivot, a fintech team leveraged these for crypto asset swap models, clarifying regulatory paths that swayed board approval. It's proof that targeted visuals can unlock doors long thought locked.
Seamless Integration into Your Toolkit
Compatible with PowerPoint 2013+, this template plays well with add-ins like Think-Cell for advanced charting hybrids. Share via OneDrive for team tweaks, or print as posters for war rooms - versatility is baked in.
It's designed for those moments when clarity cuts through noise, empowering you to not just present data, but to strategize with it.
Seize the edge in your next analysis. Acquire the Swap Business PowerPoint Diagram Template for $24 and redefine competitive landscapes.
Frequently Asked Questions
How do the 3D cubes enhance swap visualizations?
They add spatial depth to represent multi-faceted exchanges, making abstract relationships tangible and easier to discuss.
Is this template suitable for non-business swaps, like in education?
Yes, adapt the cubes for knowledge exchanges or resource sharing in academic or nonprofit settings.
Can I animate the relationship arrows?
Certainly - use PowerPoint's motion paths to sequence reveals, building tension in your narrative.
What file formats are supported for import?
Beyond PPTX, link to Excel for data-driven cubes or images for custom icons.
How many competitors can one slide model?
Scalable up to 8-10 for clarity; for more, use progressive slides to avoid clutter.
Does it include color-blind friendly palettes?
Pre-set schemes use patterns and contrasts compliant with WCAG guidelines for accessibility.