Development Tools PowerPoint Diagrams: Streamline Your Project Visions


Envision turning intricate development processes into crystal-clear visuals that propel your ideas forward. Our Development Tools PowerPoint Diagrams template is crafted for innovators, project leads, and analysts who need to communicate stages with precision and flair. Boasting 12 editable slides, it encompasses a variety of charts from pie distributions to 3D models, perfect for illustrating business evolution. In industries like software engineering or urban planning, where phased development is key, this tool aligns with standards such as PMI's project management body of knowledge, helping reduce planning errors by visualizing dependencies. Users in tech hubs have leveraged similar diagrams to secure funding, as case studies from firms like Microsoft show how effective visuals shorten decision cycles. This template addresses the frustration of scattered data by providing cohesive, professional layouts that engage stakeholders, making your pitches not only heard but remembered.
Core Features Driving Visual Excellence
This template's strength lies in its diverse yet unified design elements, optimized for PowerPoint (.pptx) users. High-definition graphics ensure scalability without pixelation, while full editability lets you modify data points, colors, and structures on the fly. Pie charts come with percentage calculators, timelines with draggable milestones, and tables with sortable rows � features that go beyond basic tools. For authority, designs incorporate best practices from data visualization experts like Edward Tufte, emphasizing clarity over ornamentation. Benefits include enhanced audience retention; studies indicate visuals improve recall by 65%. Whether minimalist for executive summaries or detailed for technical reviews, customization ensures fit-for-purpose outputs.
Comprehensive Slide Overview
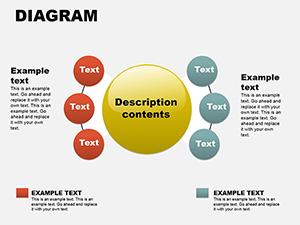
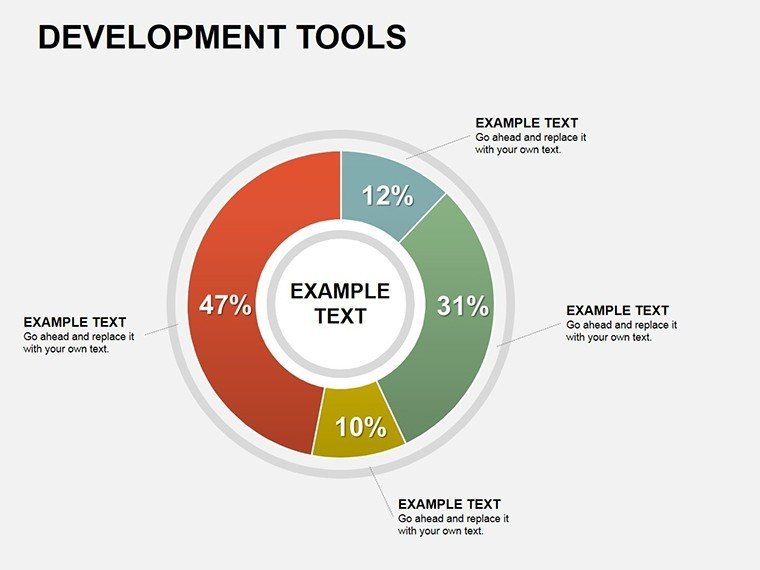
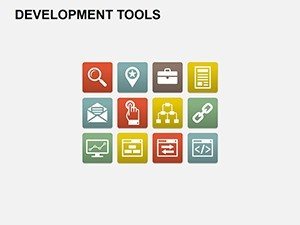
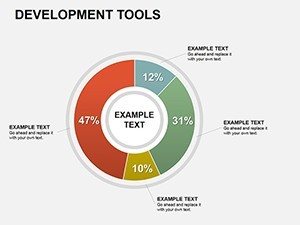
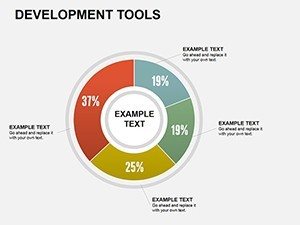
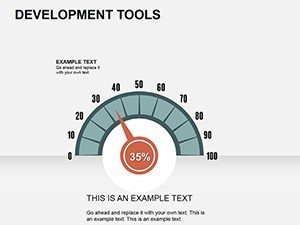
- Slide 1: Master Dashboard � Overview pie chart summarizing development phases.
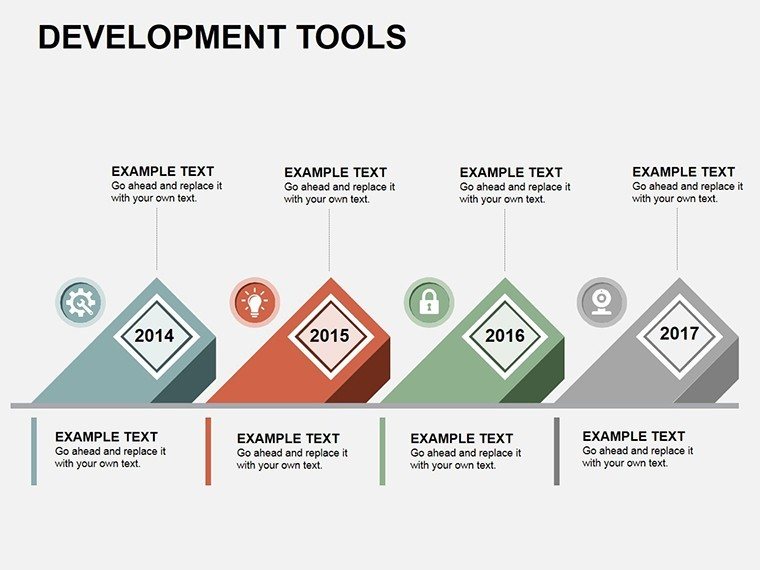
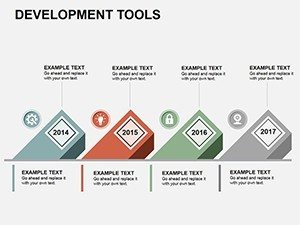
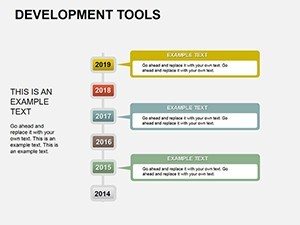
- Slide 2-4: Timeline Progressions � Horizontal and vertical timelines for milestone tracking.
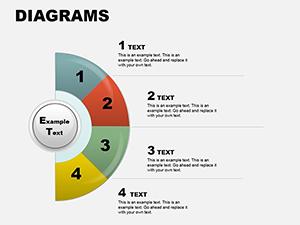
- Slide 5: Pie Distribution � Segmented charts for resource allocation.
- Slide 6-7: Table Matrices � Grids for comparing tools or stages.
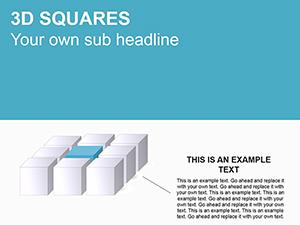
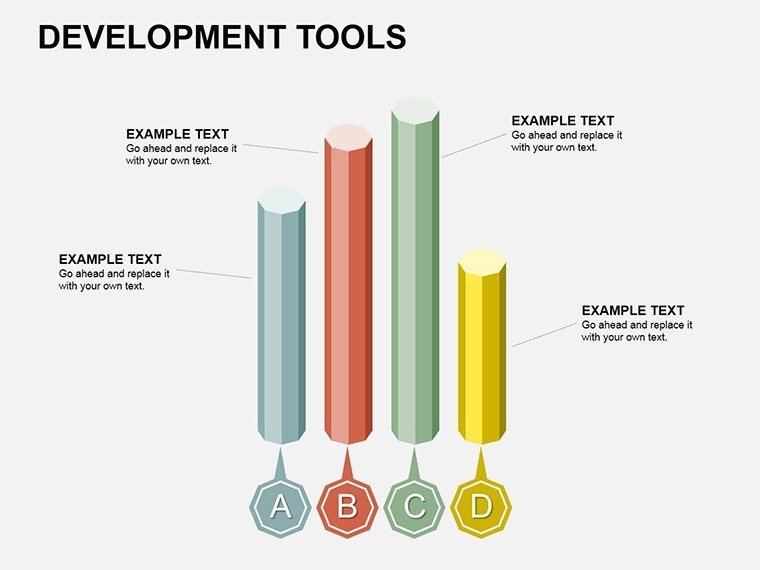
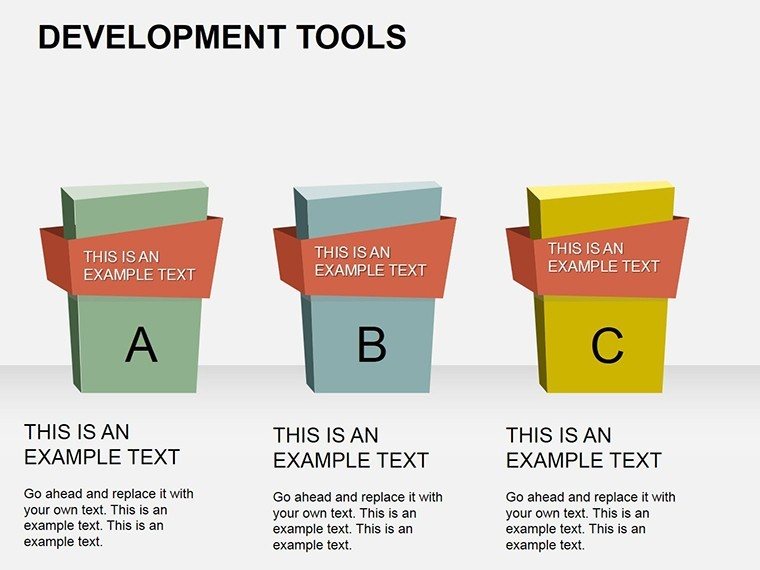
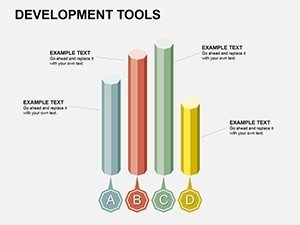
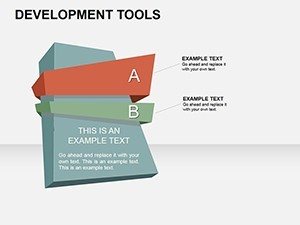
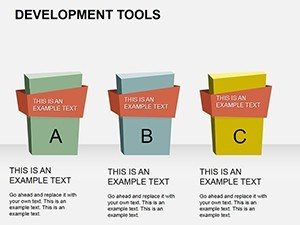
- Slide 8-10: 3D Models � Rotatable views for depth in presentations.
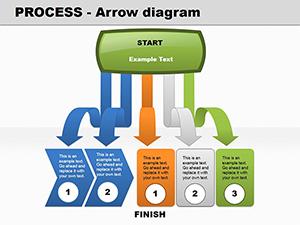
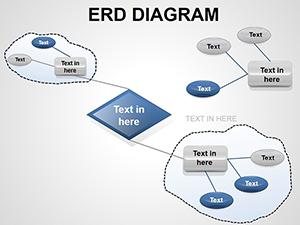
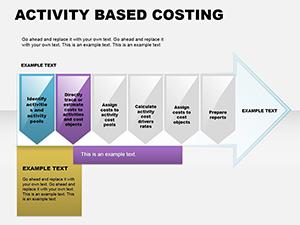
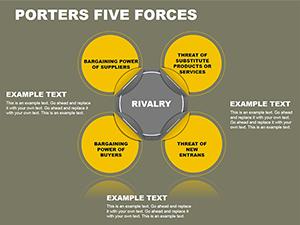
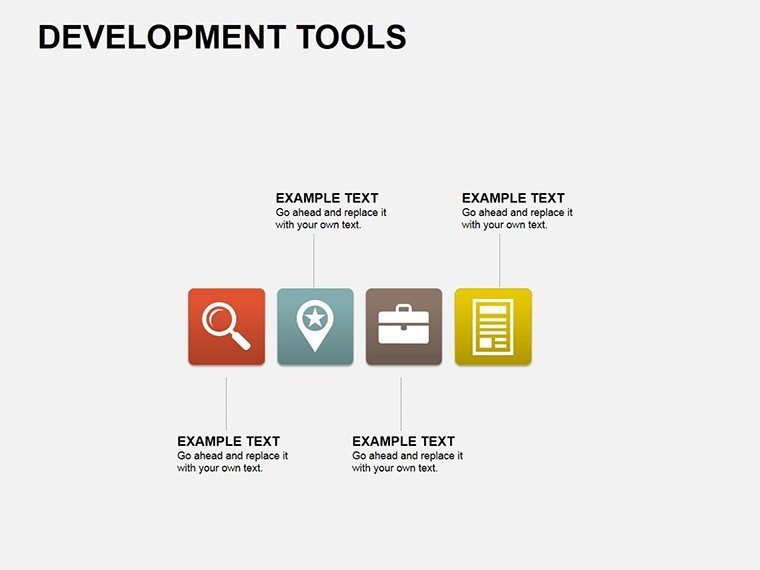
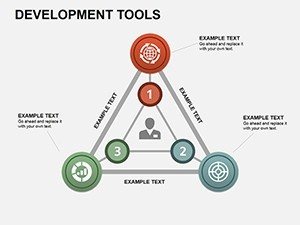
- Slide 11: Integration Chart � Flow diagrams linking tools.
- Slide 12: Customization Tutorial � Quick guide for adaptations.
These slides draw from real development scenarios, ensuring practical relevance.
Versatile Applications in Development Contexts
Harness this template for scenarios demanding clear progression mapping. In architecture, apply timelines to plot from concept to construction, incorporating AIA-compliant phases like schematic design. Step-by-step: Load your project timeline into Slide 2, add custom milestones via shapes, then animate for phased reveals in client meetings. For software devs, use 3D diagrams to model system architectures, clarifying layers better than text alone. Business analysts can employ tables for SWOT analyses during tool selection. Versus plain PowerPoint, this offers pre-linked elements that save hours, integrating seamlessly with Excel for live data pulls. A witty aside: It's like giving your slides a 'development upgrade' � from prototype to polished product.
Guide to Effective Usage
- Import the .pptx into PowerPoint.
- Populate data in a pie or table slide using the formula bar.
- Adjust visuals with the format pane for branding.
- Incorporate animations for dynamic storytelling.
- Share via cloud for team input.
This fosters collaborative refinement, elevating project outcomes.
Unlocking Sustained Value from Your Diagrams
This template delivers enduring utility, with icons and themes adaptable to evolving needs. Trust its compatibility across PowerPoint versions, backed by our support. From securing architecture bids to dev tool pitches, it's a catalyst for success. Customize now to transform your development narratives.
Frequently Asked Questions
How editable are these development diagrams?
Completely editable, including data, designs, and integrations.
Compatible with Google Slides?
Yes, import .pptx for full functionality.
Best for which development stages?
From planning to execution in tech, architecture, and business.
Include data import features?
Yes, link to Excel for real-time updates.
Enhance presentation authority?
By using expert-inspired visuals for credible insights.