Process Production and Delivery PowerPoint Diagrams: Transform Your Business Narratives


Imagine transforming complex supply chain concepts into clear, engaging visuals that captivate your audience and drive home your message. Our Process Production and Delivery PowerPoint Diagrams template is designed precisely for that purpose. Tailored for business analysts, operations managers, and marketing teams, this template offers 14 fully editable slides that graphically illustrate the interconnected cycles of supply, production, and delivery. Whether you're presenting quarterly reports, pitching new operational strategies, or training teams on workflow efficiencies, these diagrams simplify intricate processes into digestible visuals. Drawing from real-world applications like lean manufacturing principles - think Toyota's just-in-time system - these slides help you demonstrate how seamless integration of resources can boost productivity and reduce waste. With compatibility across PowerPoint versions and easy integration into Google Slides, you'll save hours on design while delivering professional-grade presentations that resonate. Dive into a world where your data tells a story, not just statistics, and watch your ideas gain traction in boardrooms and beyond.
Key Features That Set This Template Apart
What makes our Process Production and Delivery diagrams a must-have? It's the blend of functionality and aesthetics. Each of the 14 slides is built with vector-based graphics, ensuring scalability without loss of quality - ideal for high-resolution projections or printed materials. Colors, fonts, and layouts are fully customizable, allowing you to align with your brand's palette effortlessly. For instance, adjust the cycle arrows to match your company's green initiatives, emphasizing sustainable production paths.
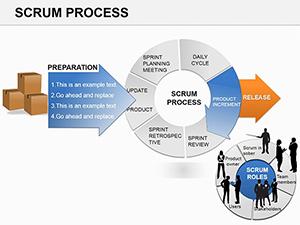
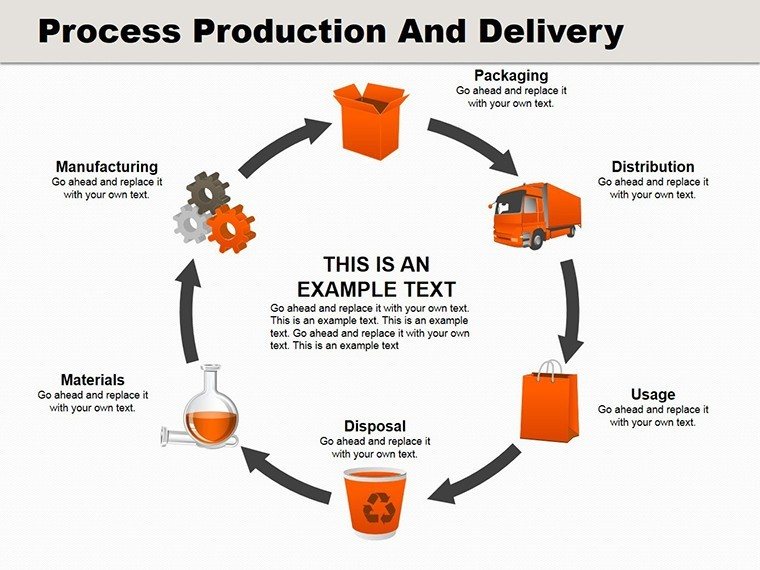
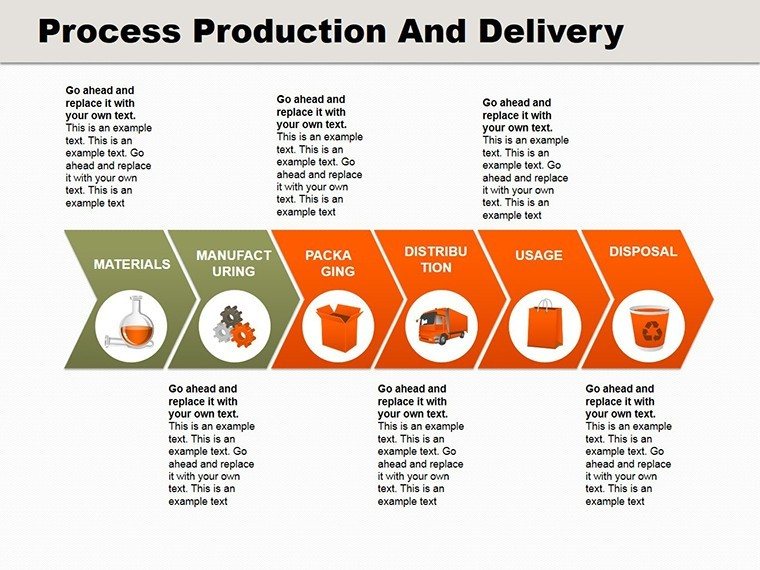
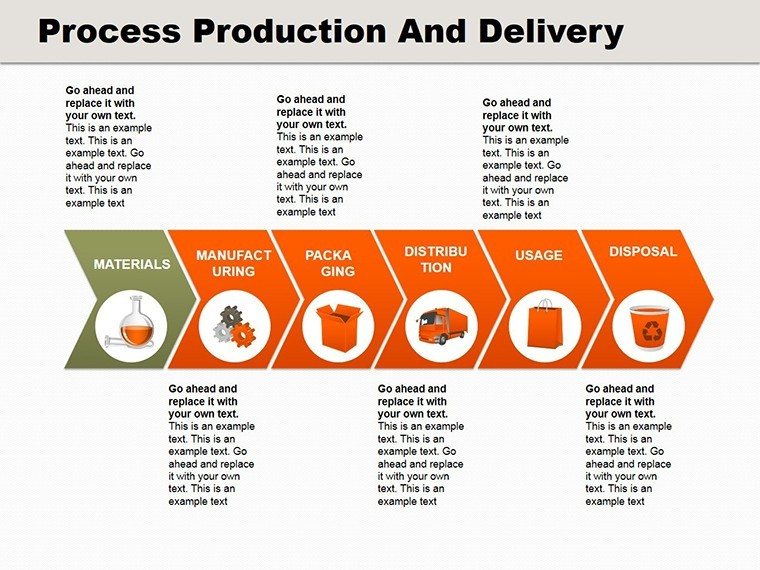
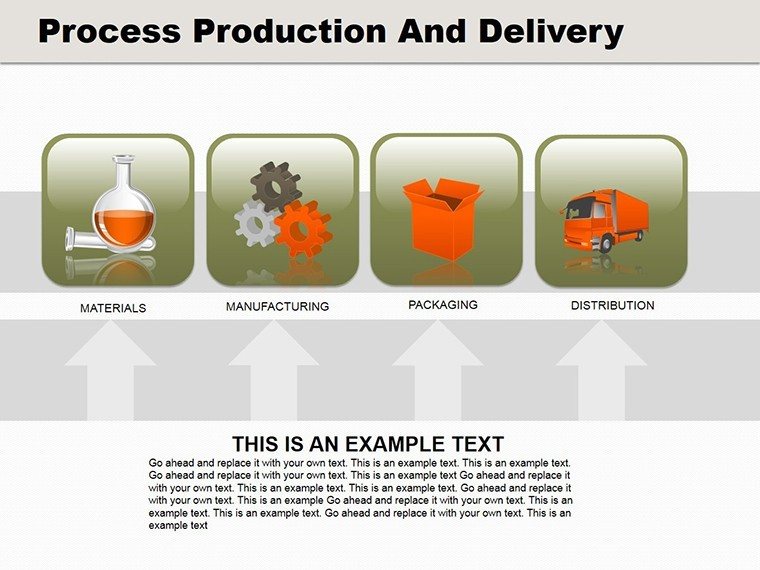
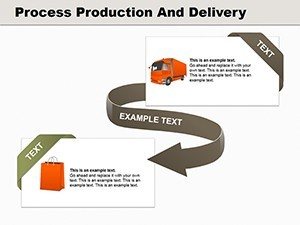
- Cycle Diagrams: Perfect for showing continuous loops, like raw material sourcing to final delivery.
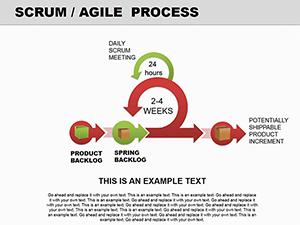
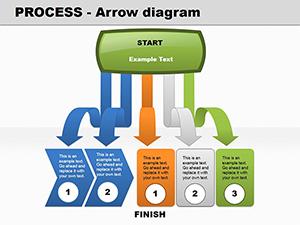
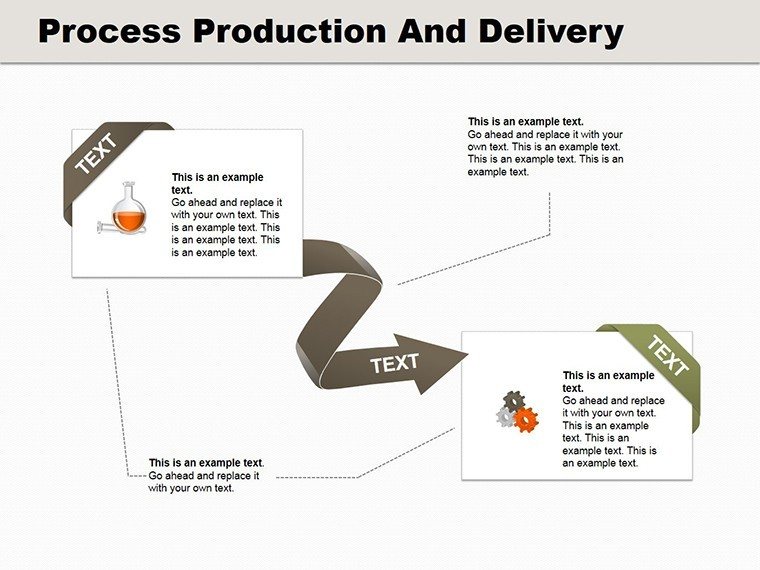
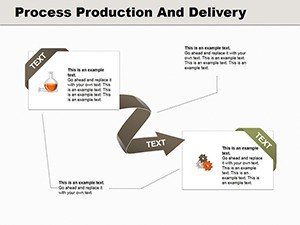
- Flowcharts: Break down multi-stage processes, highlighting bottlenecks and optimizations.
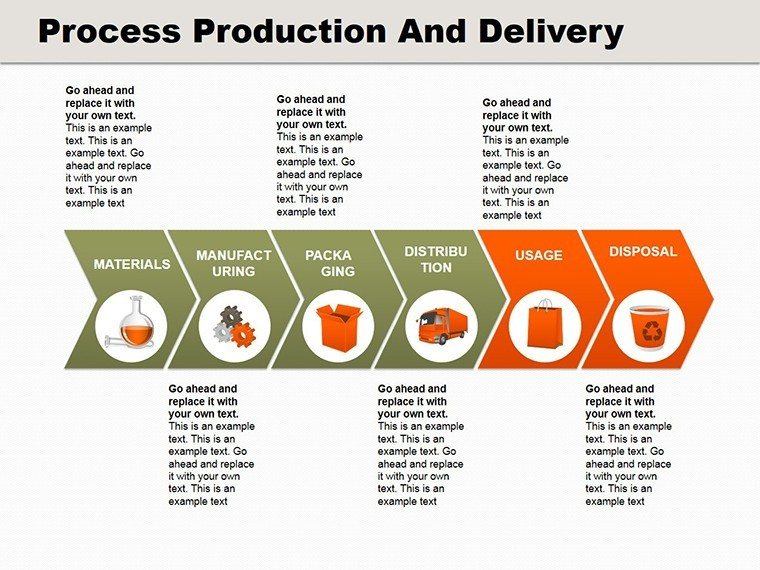
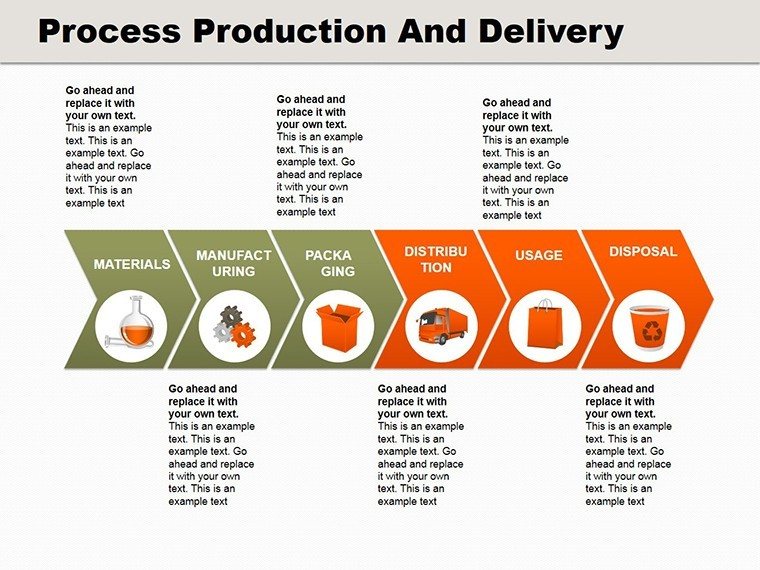
- Timeline Integrations: Map out project phases from inception to market launch.
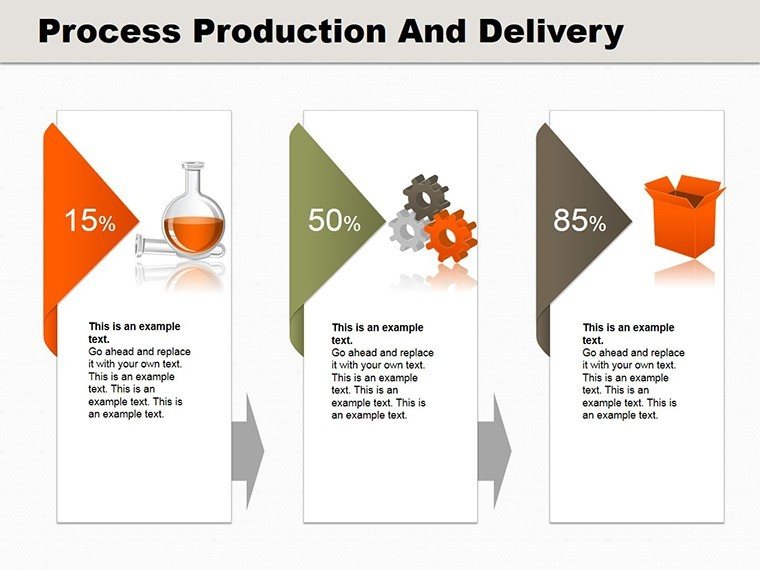
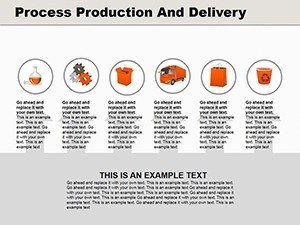
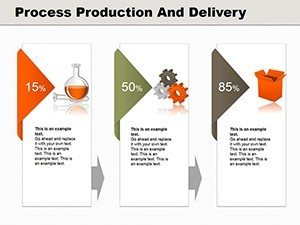
- Data-Driven Icons: Incorporate symbols for supply, production tools, and sales metrics.
These features aren't just decorative; they're rooted in proven design methodologies, such as those from the Project Management Institute (PMI), ensuring your visuals adhere to best practices for clarity and impact.
Detailed Slide Breakdown for Maximum Utility
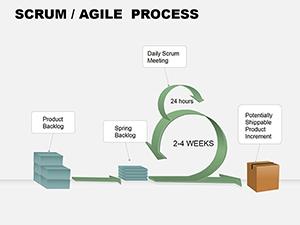
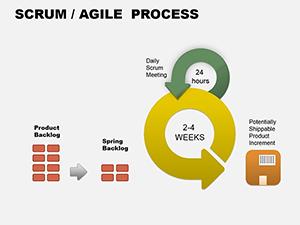
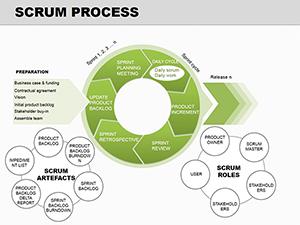
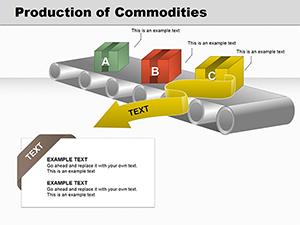
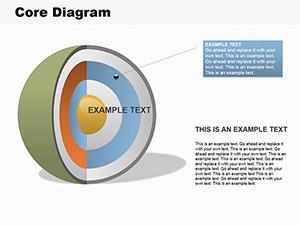
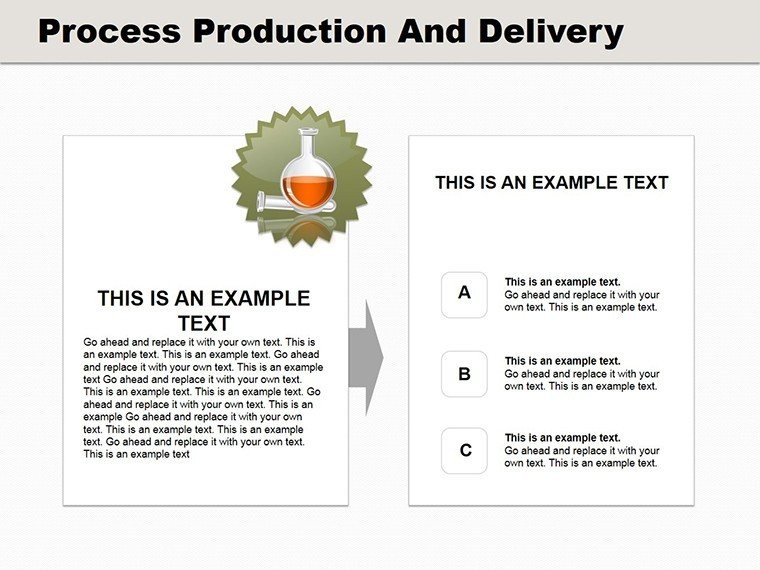
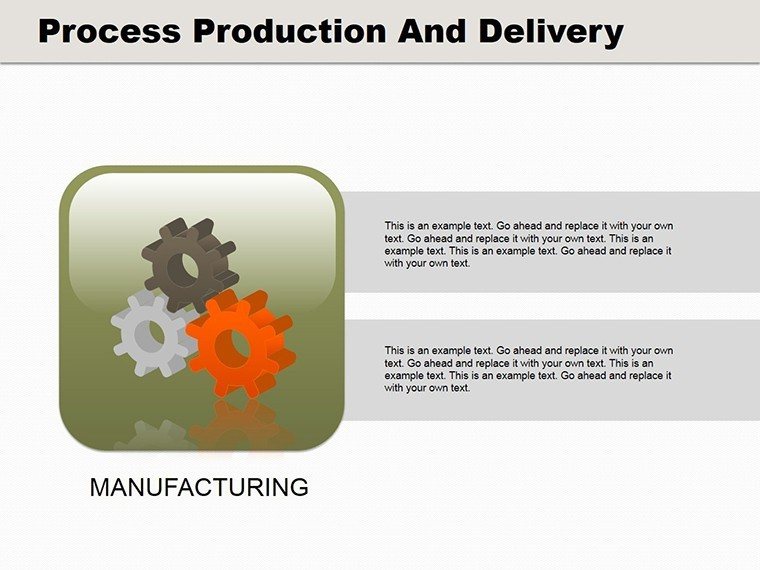
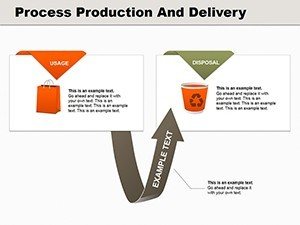
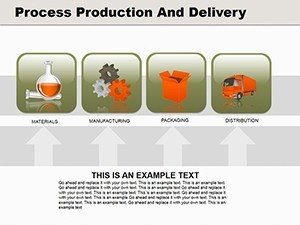
Let's explore the slides in depth. Slide 1 introduces the core cycle with a central hub diagram, where supply feeds into production and spirals out to delivery - customize placeholders with your metrics, like reducing lead times by 20%. Slides 2-5 delve into supply chain specifics: one features a linear flowchart for vendor selection, another a matrix for inventory management, drawing from ERP system integrations like SAP. Production-focused slides (6-9) include gear icons for machinery workflows and bar charts for output analysis, helping you illustrate efficiency gains, perhaps referencing case studies from General Electric's digital twin technology.
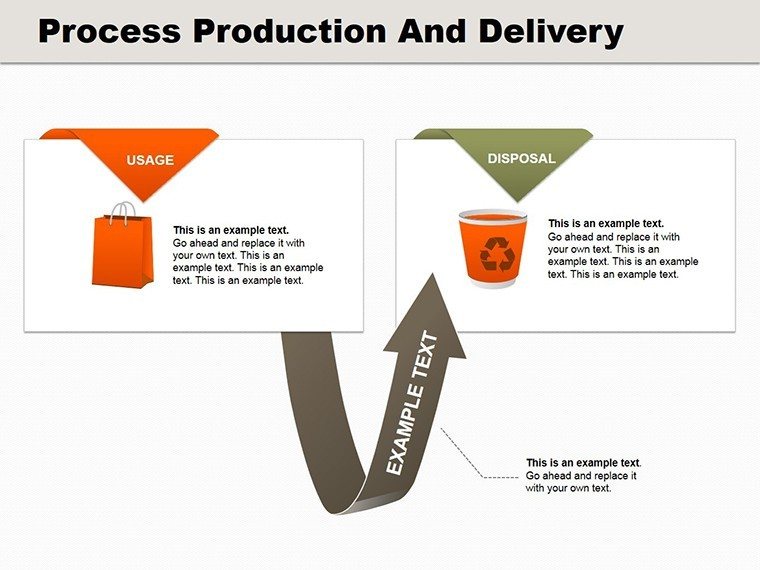
Moving to delivery, slides 10-12 offer logistics maps and distribution networks, with editable nodes for route optimizations - think Amazon's supply chain mastery. The final slides (13-14) provide summary overviews and call-to-action prompts, perfect for wrapping up with KPIs like on-time delivery rates. Each slide includes subtle animations options, ensuring smooth transitions that keep audiences engaged without overwhelming them.
Real-World Applications and Use Cases
In today's fast-paced business environment, visualizing processes isn't optional - it's essential. Consider a manufacturing firm using these diagrams to pitch a new assembly line to investors: the cycle visuals clearly show ROI through reduced downtime. Or, a logistics company training staff on delivery protocols - the flowcharts make abstract concepts tangible, improving compliance and reducing errors.
- Operational Reviews: Use cycle diagrams to audit and refine internal processes, aligning with ISO 9001 quality standards.
- Marketing Strategies: Illustrate how production ties into sales funnels, boosting cross-departmental understanding.
- Educational Workshops: Teach supply chain management in corporate training, with editable examples for interactive sessions.
One standout example: A mid-sized e-commerce business revamped their investor pitch using these templates, resulting in a 30% funding increase by clearly mapping product lifecycle efficiencies. Integrate these into your workflow by starting with data import - pull from Excel sheets - and customize via PowerPoint's shape tools for a polished finish.
Expert Tips for Customization and Best Practices
To elevate your presentations, layer in data visualization best practices. Use contrasting colors for process stages to guide the eye, as recommended by data viz experts like Edward Tufte. Avoid clutter by limiting text to key phrases, letting diagrams do the talking. For virtual presentations, test animations in Zoom or Teams to ensure seamless delivery.
Pair this template with complementary tools, like internal links to related analysis diagrams on our site, enhancing site navigation and user experience. Remember, the goal is to make your audience nod in understanding, not puzzle over complexity - our diagrams achieve that with elegance.
Why Choose This Template for Your Next Project?
Beyond the basics, this template embodies trustworthiness through its professional design, backed by years of template expertise. It's not just about slides; it's about empowering your narratives. Whether you're a startup founder or a Fortune 500 executive, these diagrams adapt to your scale, offering value that scales with your ambitions.
Ready to revolutionize how you present processes? Download our Process Production and Delivery PowerPoint Diagrams today and turn data into decisions. Customize now and see the difference in your next meeting.
Frequently Asked Questions
- How editable are these diagrams?
- All 14 slides are fully customizable in PowerPoint, including shapes, colors, and text for seamless branding.
- Is this template compatible with Google Slides?
- Yes, import the .pptx file directly into Google Slides with full editing capabilities preserved.
- Can I use these for commercial presentations?
- Absolutely, designed for business use with no restrictions on commercial applications.
- What if I need more slides?
- Easily duplicate and modify existing slides to expand your deck as needed.
- Are there animation options included?
- Yes, pre-set subtle animations enhance flow without overwhelming your content.