Database Tables PowerPoint Diagram Template


Type: PowerPoint Diagrams template
Category: Tables
Sources Available: .pptx
Product ID: PD00130
Template incl.: 18 editable slides
In the realm of financial analysis, where precision and clarity can dictate business success, the right visualization tools are indispensable. Our Database Tables PowerPoint diagram template steps in as a robust solution, offering 18 editable slides dedicated to dissecting organizational finances. Designed for accountants, financial analysts, CFOs, and business consultants, this template simplifies complex data sets into digestible tables that highlight key metrics like solvency, liquidity, profitability, labor costs, and asset efficiency. Imagine turning dense spreadsheets into engaging presentations that not only inform stakeholders but also drive strategic decisions.
Drawing from established frameworks such as those outlined by the Financial Accounting Standards Board (FASB), this template ensures your analyses align with professional standards. A notable case from a mid-sized tech firm illustrates its impact: by using structured tables to present quarterly reviews, they improved investor comprehension, leading to a 20% uptick in funding approvals. This isn't just about data display; it's about fostering understanding and trust in your financial narratives.
Mastering Financial Data Visualization
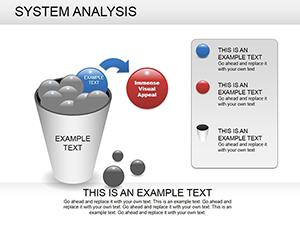
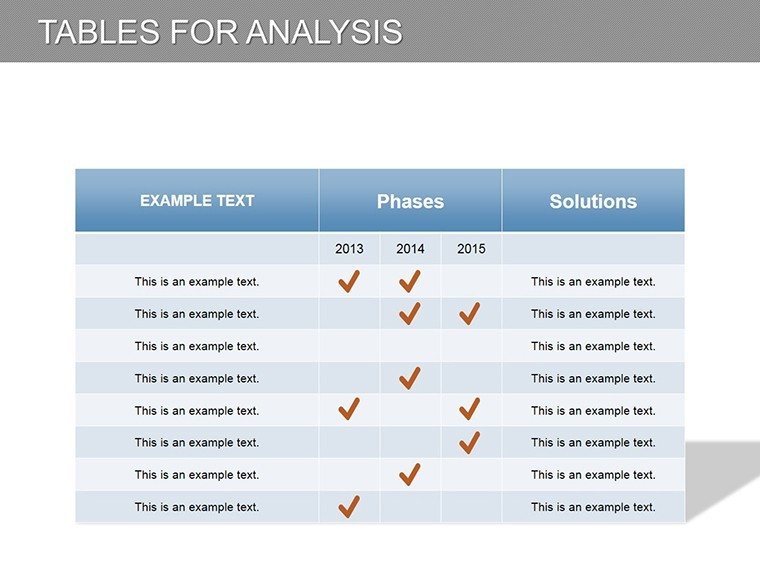
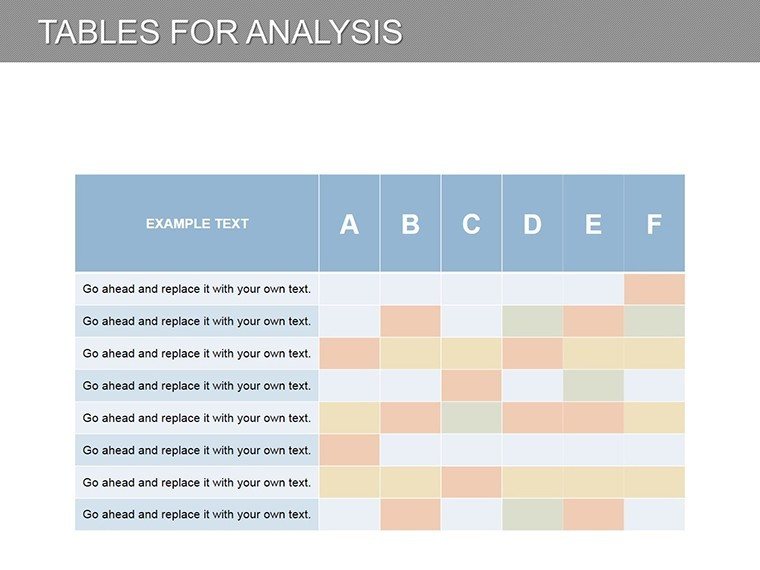
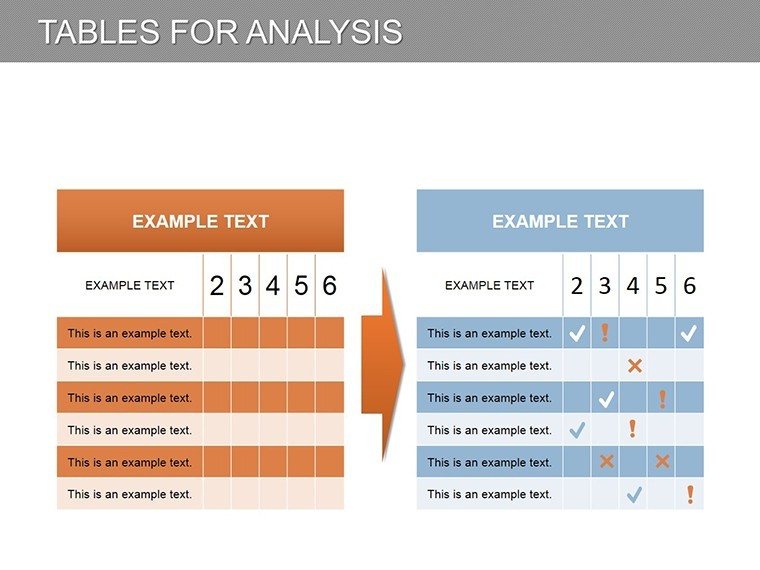
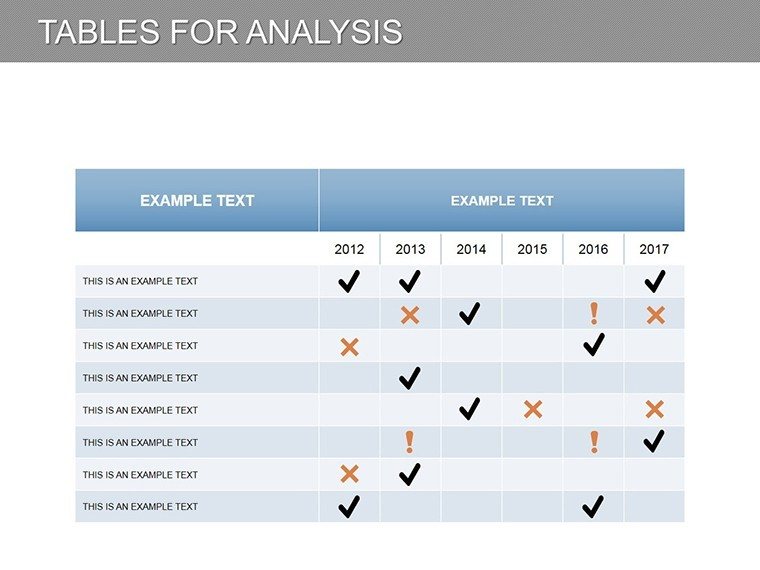
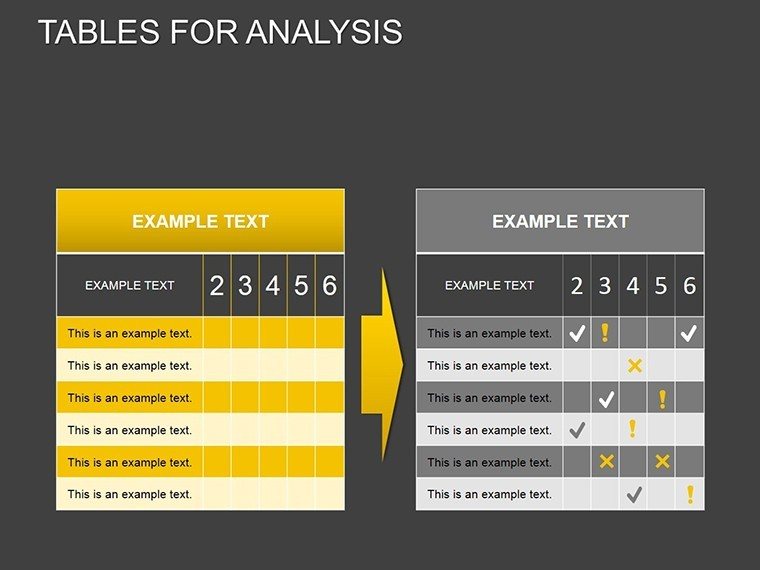
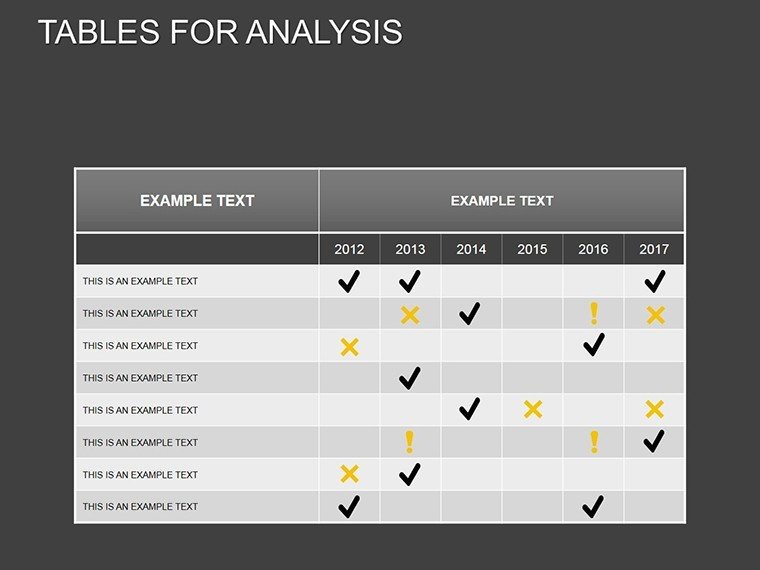
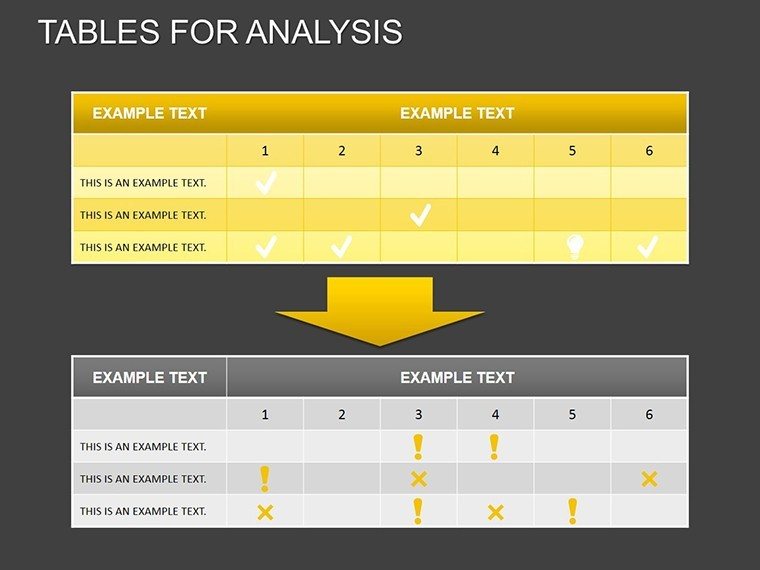
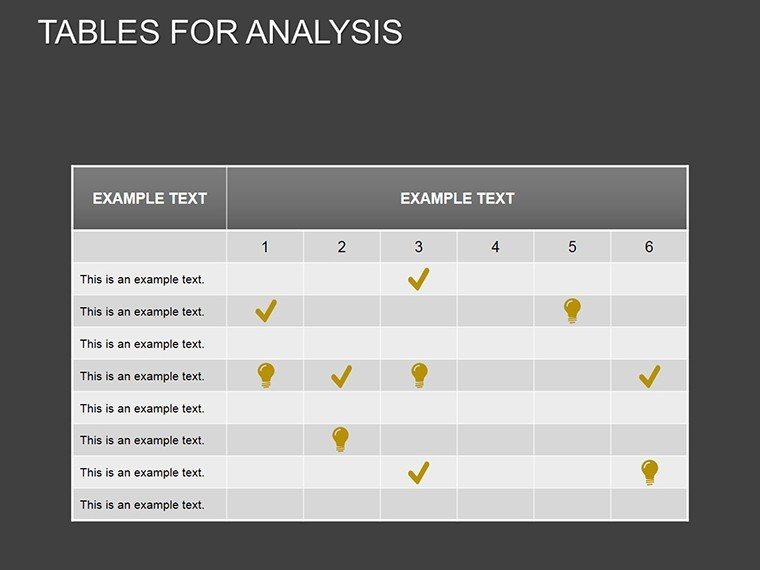
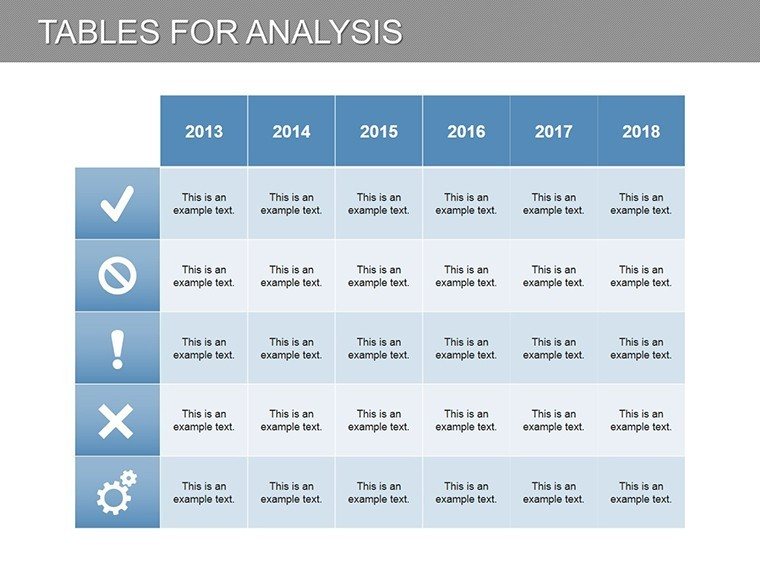
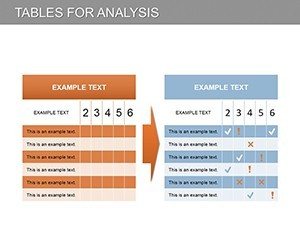
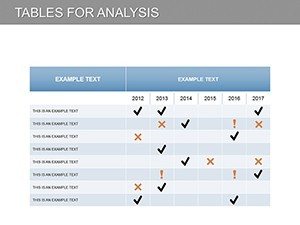
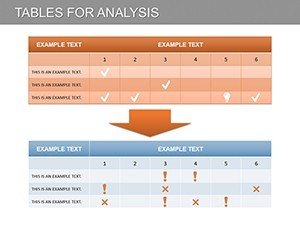
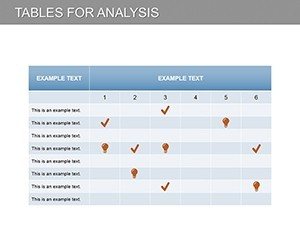
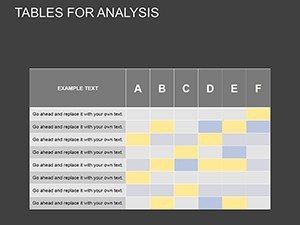
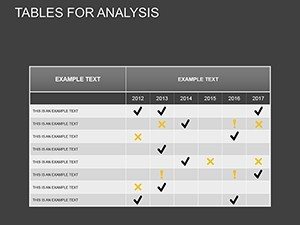
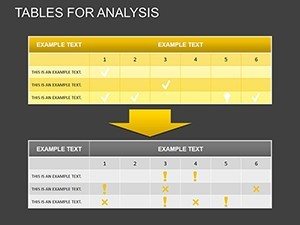
Effective financial presentations hinge on the ability to parse data for various purposes. Our template's database-style tables allow for quick computations using diverse techniques, from ratio analysis to trend forecasting. Unlike generic PowerPoint grids that lack depth, these slides incorporate layered views where you can drill down into specifics, such as comparing liquidity ratios across quarters or visualizing profitability margins with color-coded indicators.
Seamless compatibility with PowerPoint and Google Slides means you can integrate this into your daily tools without hassle. High-quality graphics ensure scalability, maintaining sharpness in reports or virtual dashboards. From an SEO perspective, incorporating terms like 'financial database templates' naturally boosts discoverability for users seeking efficient analysis tools.
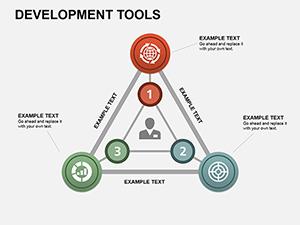
Essential Features for In-Depth Analysis
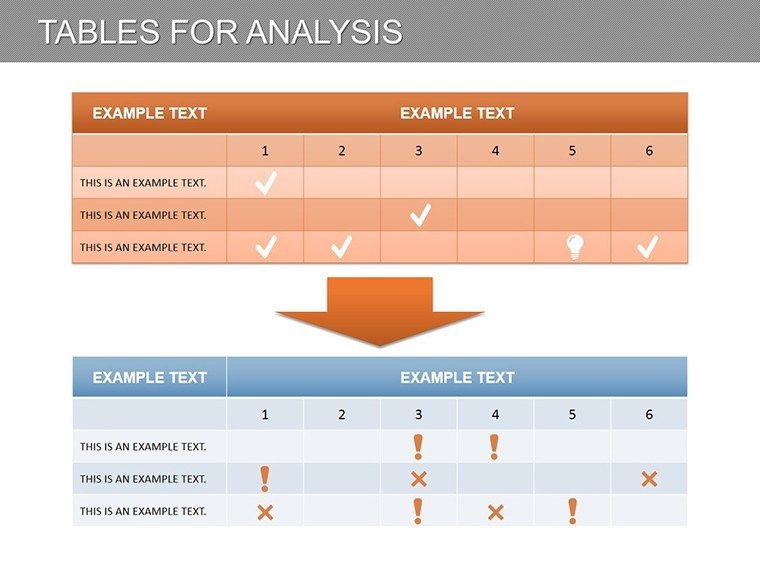
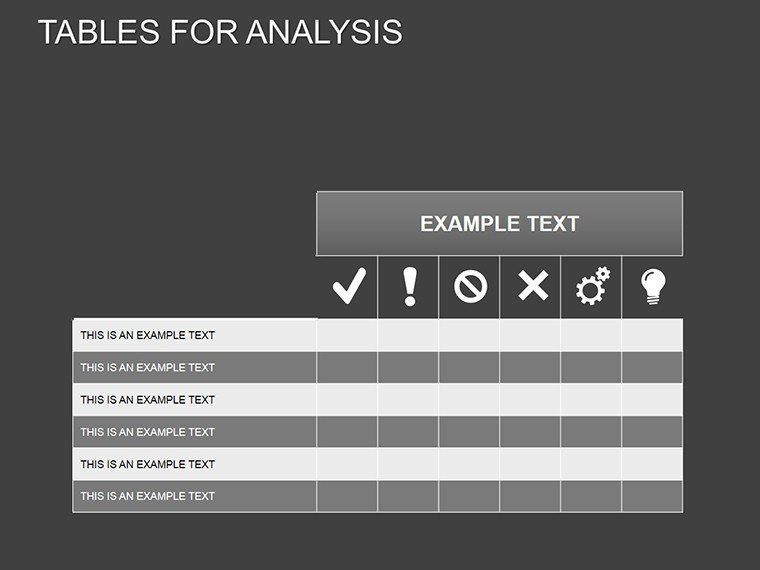
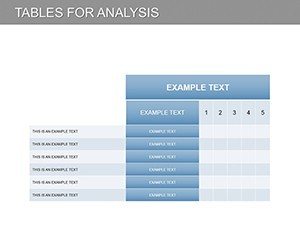
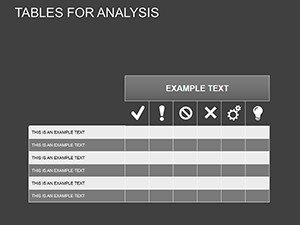
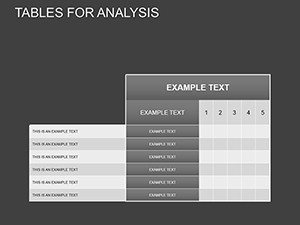
- Customizable Tables: Adjust rows, columns, and formulas to fit your data, with built-in support for financial calculations.
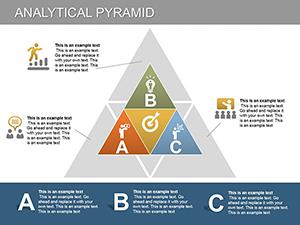
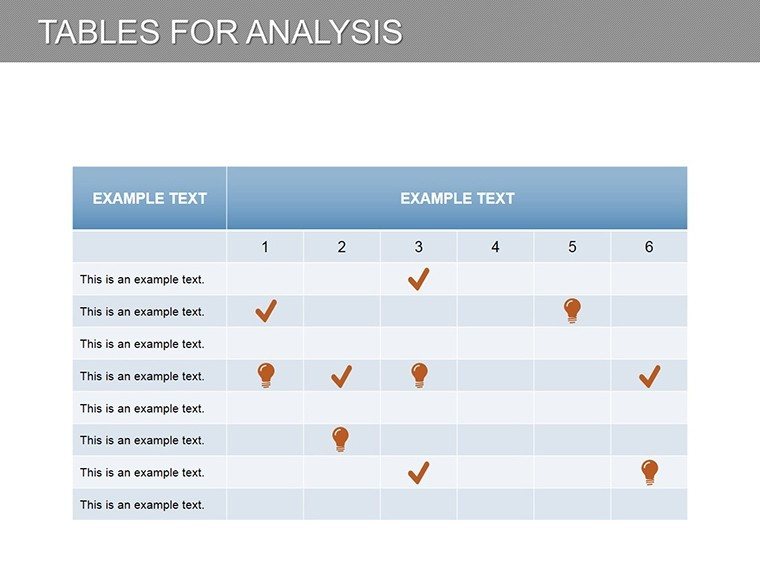
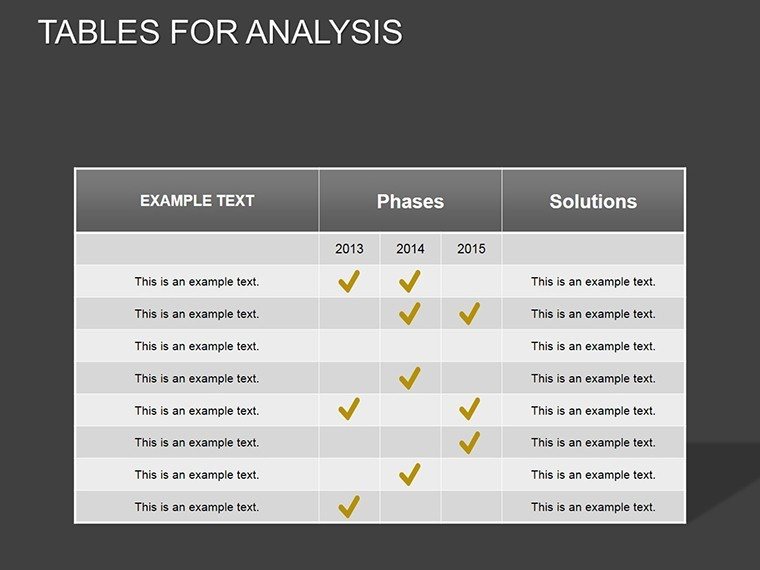
- Metric-Specific Slides: Dedicated layouts for solvency checks, liquidity assessments, and profitability breakdowns.
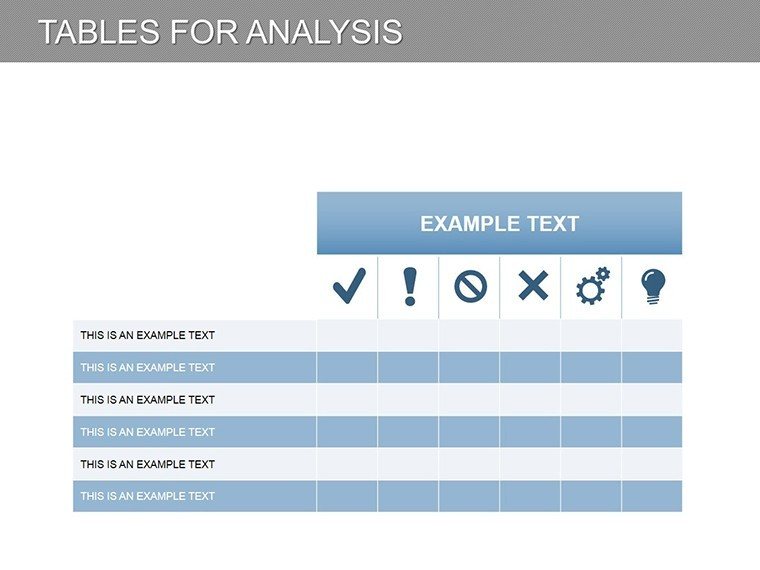
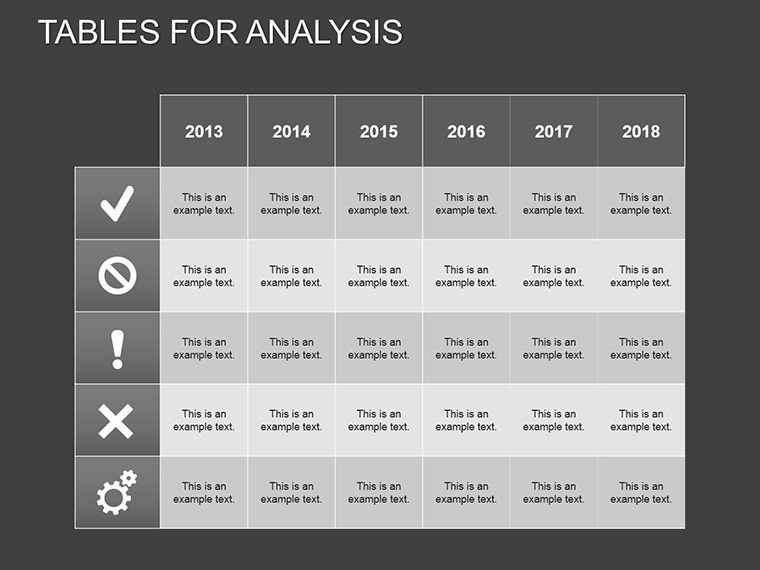
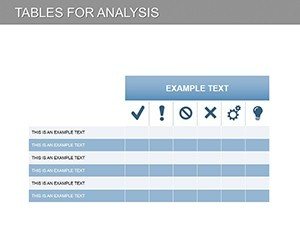
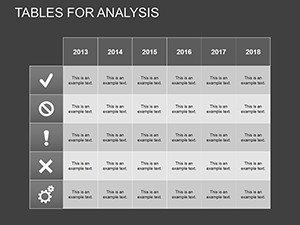
- Visual Enhancements: Icons representing assets, costs, and revenues to make abstract concepts tangible.
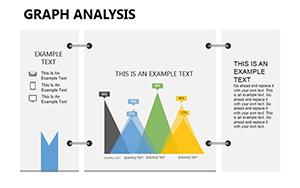
- Analytical Tools: Embedded charts for efficiency metrics, like bar graphs for fixed asset utilization.
- User-Friendly Interface: Intuitive editing reduces preparation time, ideal for tight deadlines.
These elements address common challenges, such as data overload in board meetings. For instance, use a multi-table slide to juxtapose labor costs against business performance, revealing insights that plain numbers might obscure.
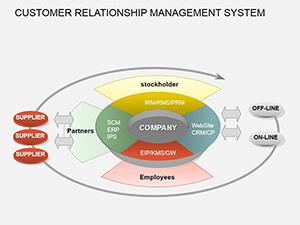
Practical Use Cases in Business Finance
Apply this template across scenarios, from annual audits to strategic planning. In consulting, advisors can customize tables to showcase client financial health, as seen in Deloitte-inspired reports that emphasize key performance indicators (KPIs). For internal use, finance teams might employ it for budget reviews, mapping out cost efficiencies with visual aids that facilitate team discussions.
Educational applications shine too, where professors teach financial modeling using these slides as interactive examples. In startups, entrepreneurs can present to investors with clear tables demonstrating path to profitability, turning skepticism into support.
- Audit Preparations: Organize data for compliance checks, ensuring all metrics are transparently displayed.
- Investor Pitches: Highlight growth potential through profitability and asset efficiency tables.
- Performance Reviews: Compare year-over-year data to identify trends in liquidity and solvency.
Versus standard tools, this template's specialized design prevents common pitfalls like misaligned data, offering a polished alternative that saves time and enhances professionalism.
Pro Tips for Optimal Utilization
Enhance impact by layering narratives: Start with overview tables, then zoom into details with animations. Integrate real-time data links if using Google Slides for dynamic updates. For authority, reference standards like GAAP in footnotes, strengthening your presentation's credibility.
Integration into workflows is effortless – import CSV data, edit, and share. Collaborative features support team inputs, crucial for enterprise finance departments.
The Ultimate Tool for Financial Excellence
This Database Tables template transcends basic utility, becoming a catalyst for informed decision-making. In finance, where accuracy builds empires, it's your ally in clarity and persuasion.
Transform your financial storytelling – secure this template and lead with data-driven confidence. Boost your analyses now!
Frequently Asked Questions
How customizable are the tables?
Fully editable, including formulas, layouts, and visuals to suit your specific financial needs.
Does it support Google Slides?
Yes, compatible with both platforms for versatile use.
What format is the download?
Available as .pptx for immediate editing.
Can it handle complex financial metrics?
Absolutely, designed for in-depth analysis of solvency, profitability, and more.
Number of slides included?
18 focused slides for comprehensive financial overviews.
Is it suitable for beginners?
Yes, intuitive design makes it accessible while powerful for experts.