Lens Division PowerPoint Diagrams - Editable PPTX | ImagineLayout


Type: PowerPoint Diagrams template
Category: Relationship, 3D
Sources Available: .pptx
Product ID: PD00129
Template incl.: 23 editable slides
23 Editable Slides: Package Contents
23 editable slides come in PPTX format ready for PowerPoint.
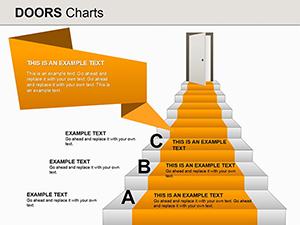
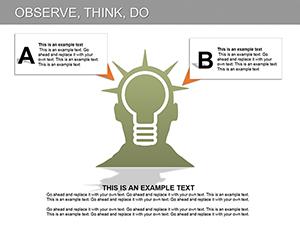
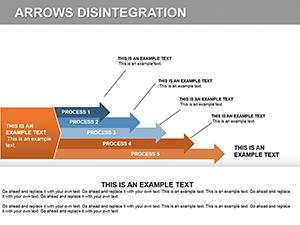
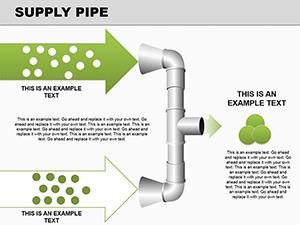
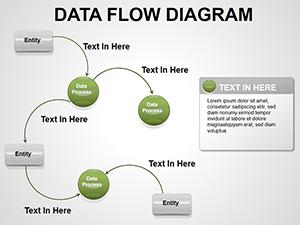
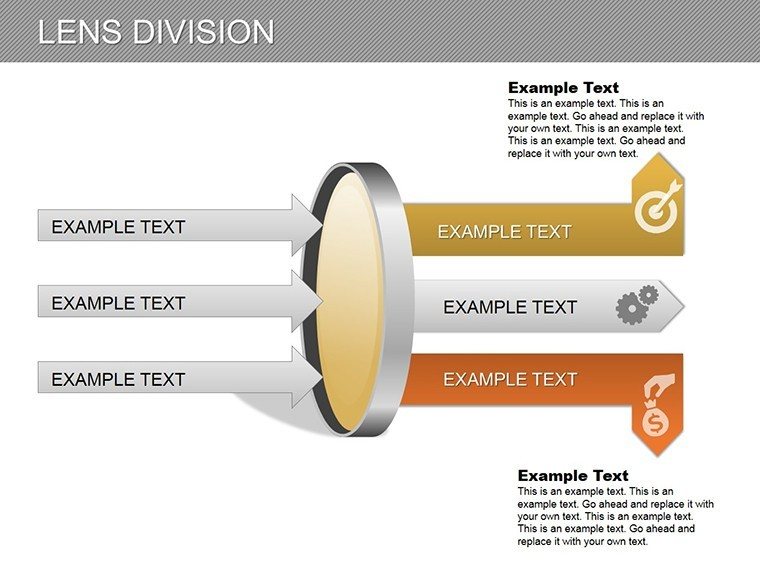
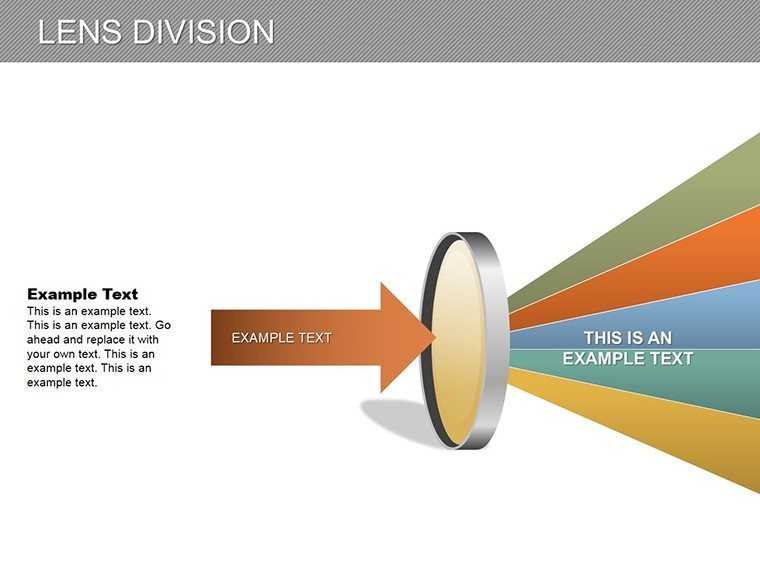
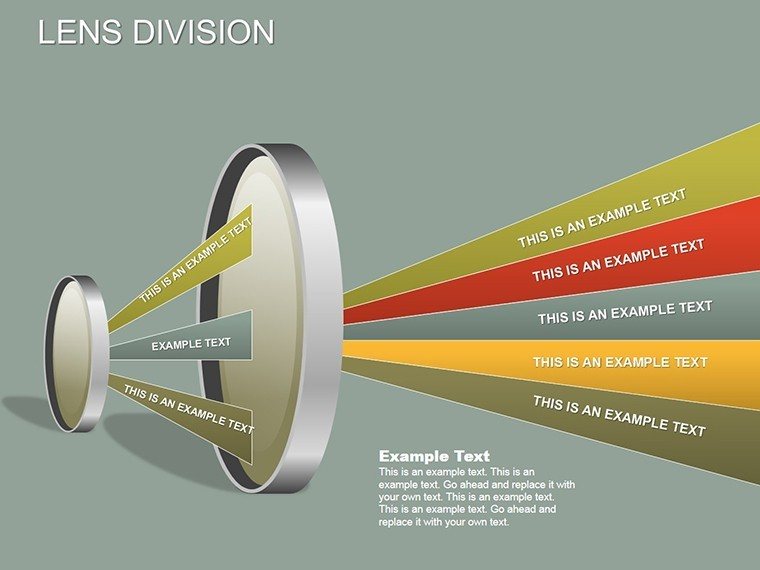
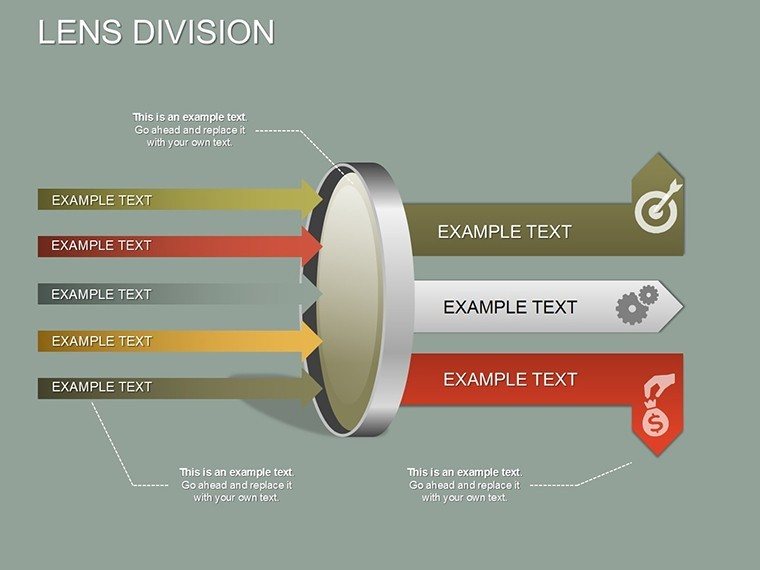
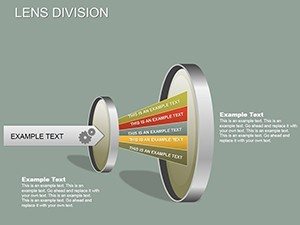
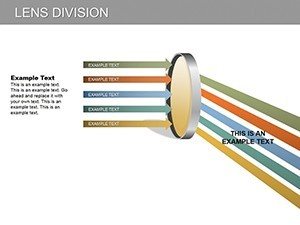
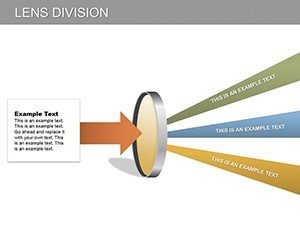
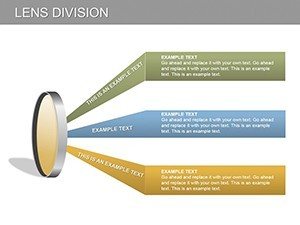
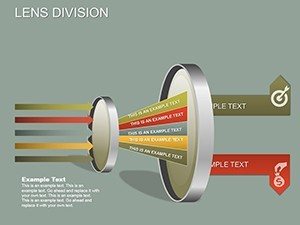
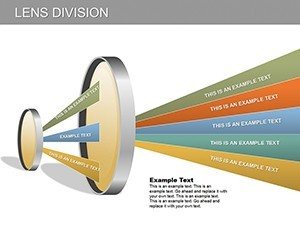
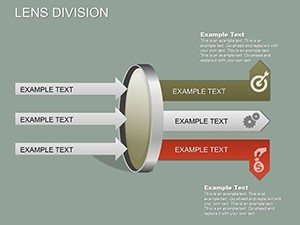
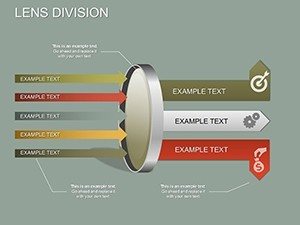
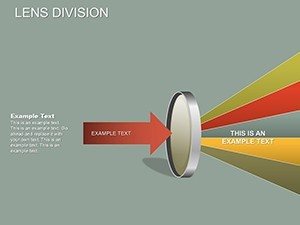
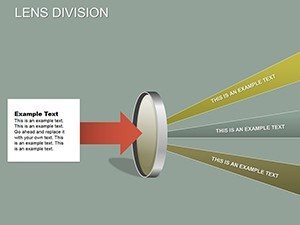
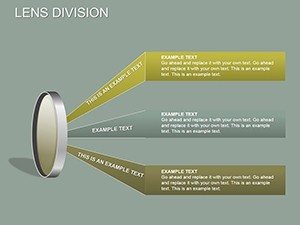
Lens divisions and flowcharts organize processes and milestones into connected segments that guide viewer attention through logical steps.
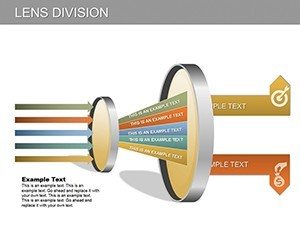
Unlike general flowchart sets this uses lens shaped divisions which suits teams that convey complex ideas in analysis decks.
Browse additional options in relationship diagram templates when structuring multi-tier strategy decks.
At a Glance
| Feature | Details |
|---|---|
| Slides included | 23 editable diagrams with lens divisions |
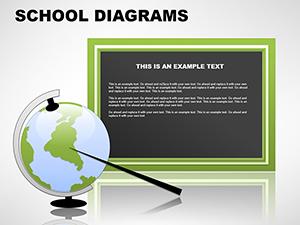
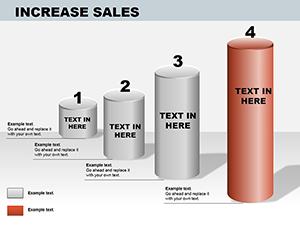
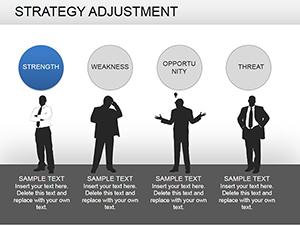
| Diagram categories | flowcharts, timelines, phase analysis |
| Editable elements | shapes resize independently, text placeholders update without group unlock |
| Aspect ratio | 16:9 standard |
| PowerPoint compatibility | 2016, 2019, 365 on Windows and Mac |
| Color schemes | adjustable through slide master palette |
| Diagram connectors | arrows and lines change weight and direction |
Customization in 5 Steps
Moderate difficulty. Follow these steps for PowerPoint.
1. Open the .pptx file in PowerPoint (1 minute)
2. Replace placeholder text with your content (3 minutes)
3. Adjust brand colors via the slide master (2 minutes)
4. Edit diagram labels and connectors (4 minutes)
5. Export as PPTX or PDF (1 minute)
Who Reaches for This Template
Consultants in education adapt the lenses for milestone mapping and cut preparation from 3 hours to 45 minutes.
Business professionals in engineering reuse the file across performance reviews by swapping divisions.
Marketers in training firms use it for client workshops with outcome of streamlined reviews.
Download the editable PPTX and start building
Building From Scratch vs. Starting Here
Building equivalent lens division diagrams from scratch requires 4 hours and advanced design skills.
Here you finish in 15 minutes with moderate skill.
Manual attempts often result in misaligned labels that fail on projection screens.
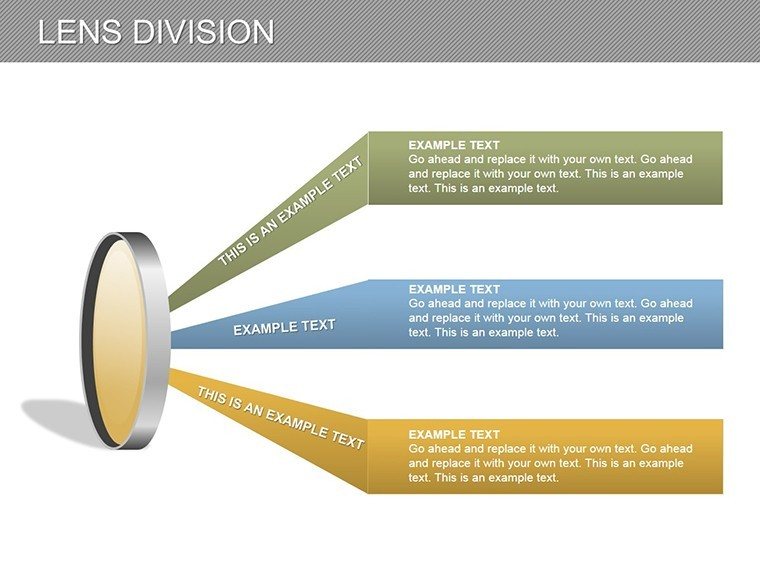
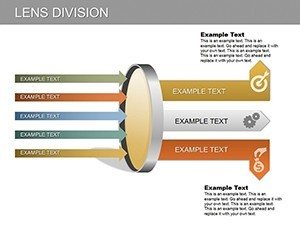
Lens divisions place labels outside shapes connected by thin lines maintaining readability during live meetings without adding editing complexity.
Get the full set today
Which PowerPoint versions support these diagrams?
The files open in PowerPoint 2016, 2019, 365 and Mac versions. You install no extra plugins. The slide master palette works across all listed releases. Older versions prior to 2016 may show limited compatibility for advanced connectors.
How do I change the color scheme?
Open the file and navigate to View then Slide Master. Select the master layout and update the theme colors there. Apply the changes to all slides with one click. The diagram connectors and shapes update automatically to match your brand.
What license permissions apply to client work?
You may use the diagrams in internal business presentations and paid client projects. Resale of the file or sublicensing remains prohibited. Attribution is not required when embedded in your decks. The license covers unlimited personal and commercial uses within presentations.
What differences exist between free and paid versions?
No free version appears listed on the page so the paid purchase delivers the complete set of editable slides. You receive all diagram types and formats in one file. Color theme adjustments and text placeholders come fully unlocked. This covers everything needed for immediate editing.
Which software opens the included file formats?
PowerPoint opens the .pptx or .ppt files directly on Windows or Mac. No conversion steps are necessary. Export options include PDF for distribution after edits. The structure remains intact across compatible versions.
Does the template include animation support?
Basic entrance animations appear on some connectors in the paid version. You remove or modify them through the Animation pane. Advanced motion paths require manual addition in PowerPoint. The core diagrams function without animations for clean delivery.
What is the refund policy?
Refunds are available within 30 days if the file does not open in your PowerPoint version. Submit the request through the purchase platform with proof of incompatibility. The process completes within 5 business days after verification. All conditions apply only to unedited files.