Analytical Pyramid PowerPoint Diagrams: Master Performance Analysis


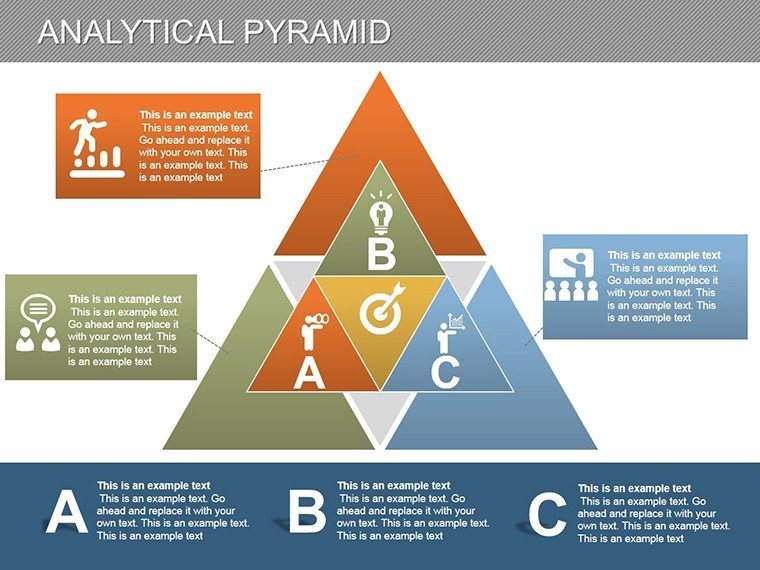


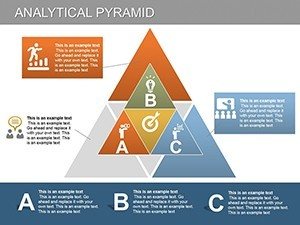

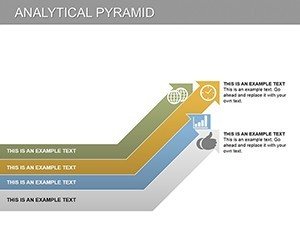


When it comes to dissecting performance metrics and highlighting critical insights, nothing beats a well-structured pyramid diagram. Our Analytical Pyramid PowerPoint Diagrams template provides 17 editable slides designed for professionals in analysis-heavy fields. From corporate strategists evaluating KPIs to educators breaking down hierarchical concepts, this tool empowers you to emphasize information importance visually, making complex hierarchies accessible and actionable.
Envision a pyramid where base layers represent foundational data, ascending to pinnacle insights - ideal for boardroom reviews or academic lectures. With .pptx compatibility and easy edits, it adheres to design standards seen in prestigious reports, like those from McKinsey, ensuring your analyses convey authority and precision. This template not only saves time but also amplifies your expertise, turning data pyramids into persuasive narratives that drive decisions.
Exploring Hierarchical Analysis
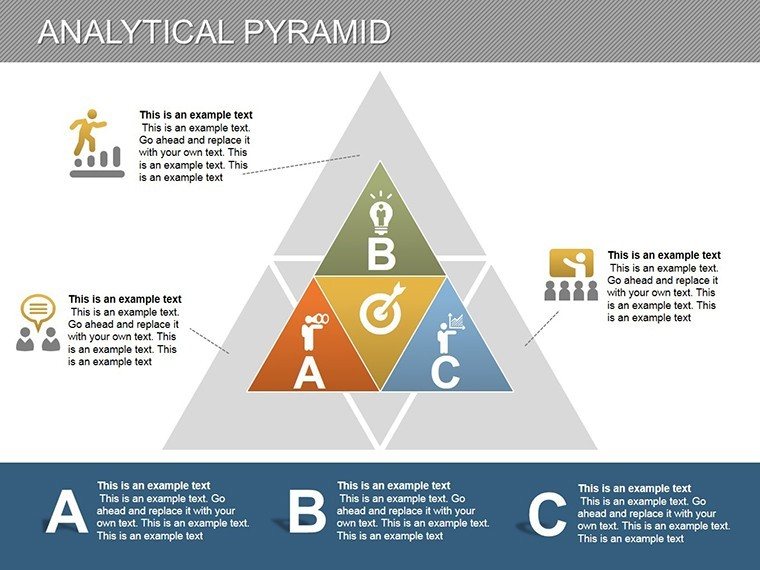
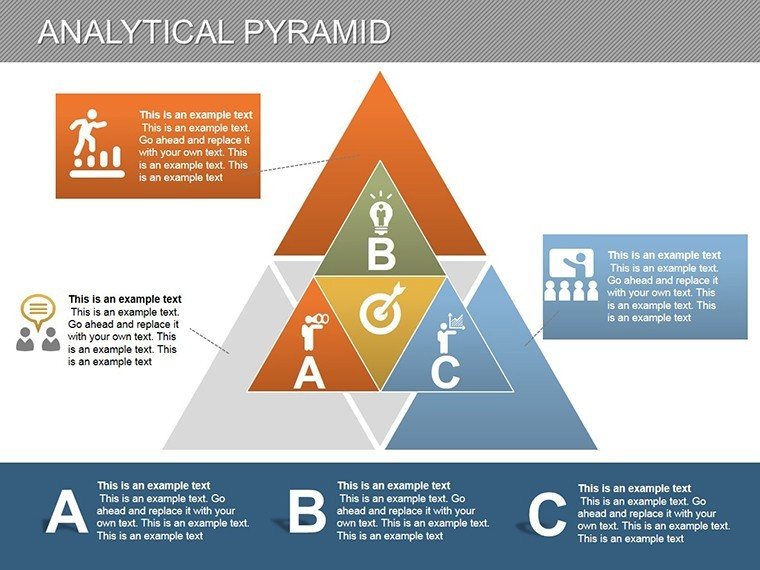
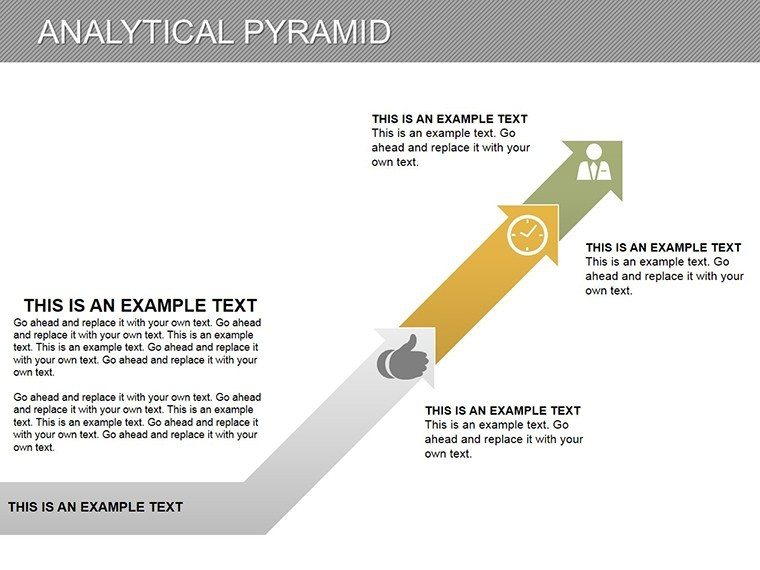
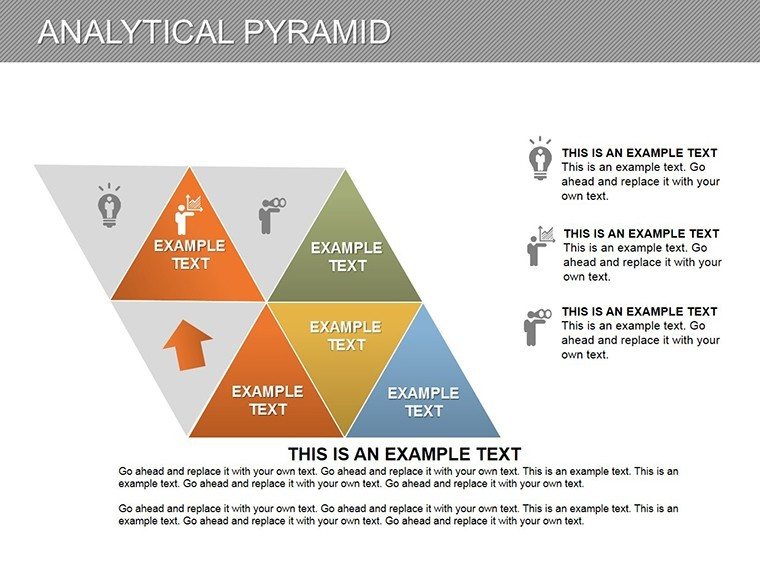
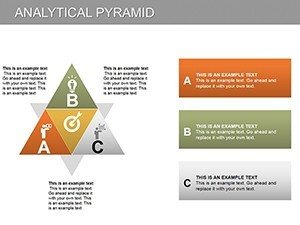
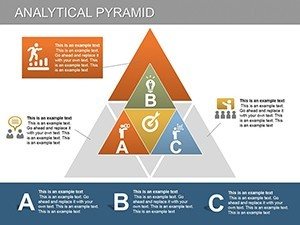
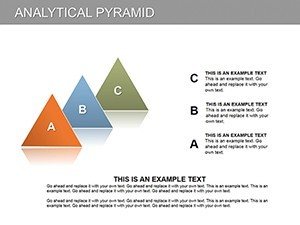
The pyramid structure inherently prioritizes information, with broader bases for details and narrow tops for summaries. This template leverages that for performance tracking, such as in HR evaluations where layers denote skill levels.
Essential Features for Analytical Excellence
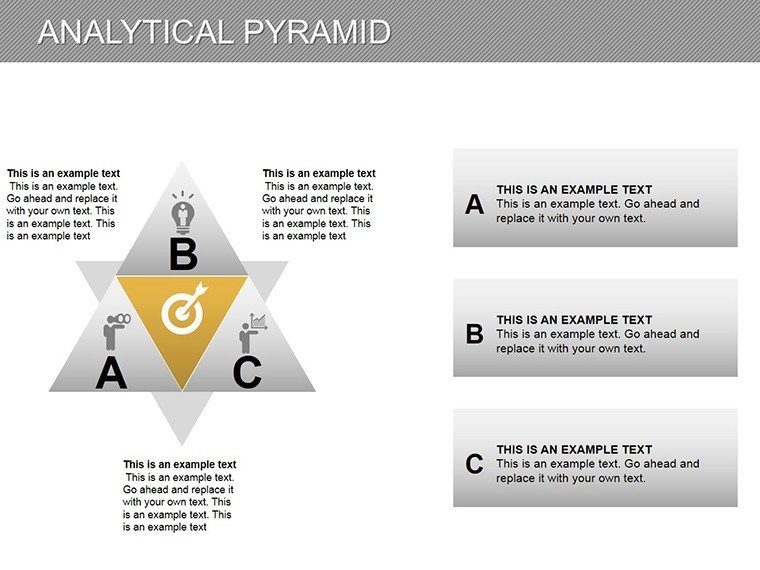
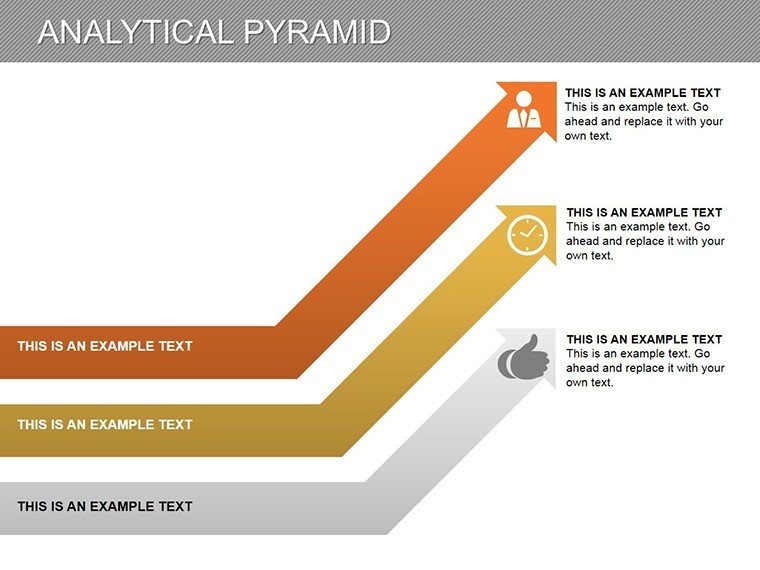
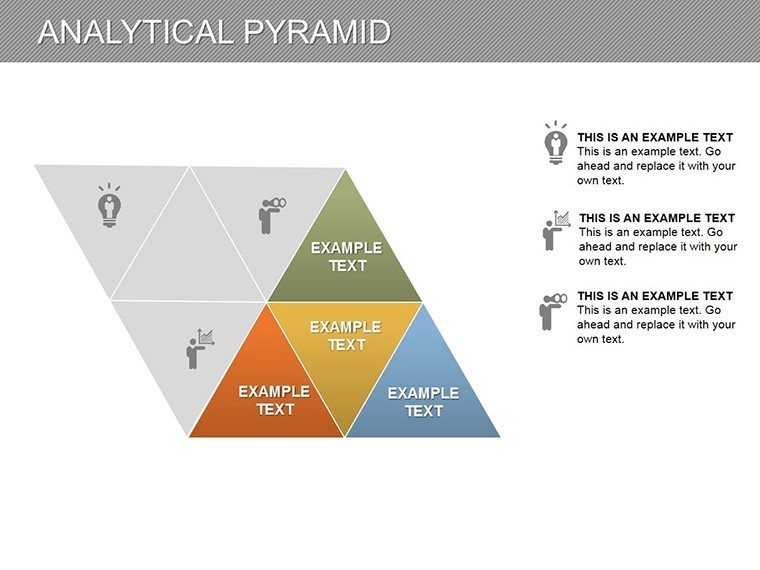
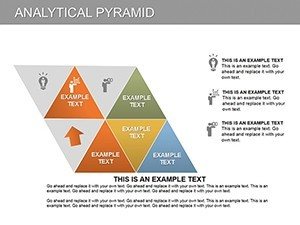
- Editable Layers: Adjust pyramid segments for custom hierarchies.
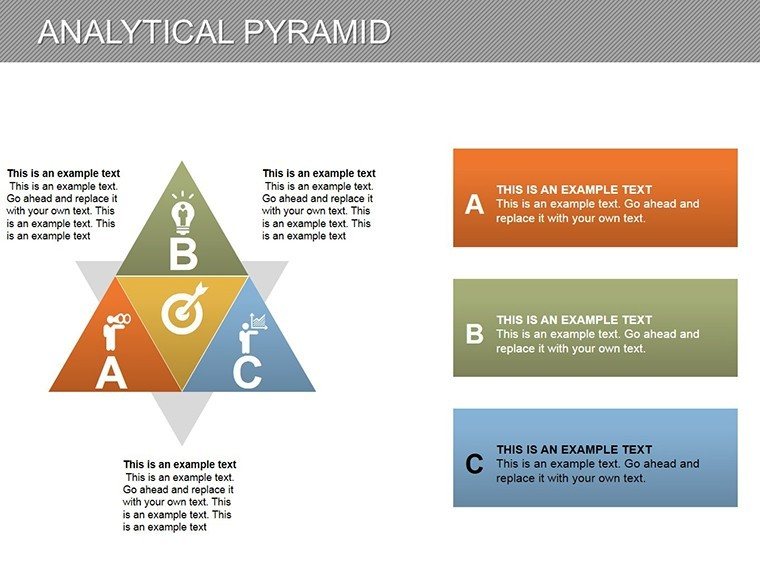
- Performance Indicators: Built-in spots for metrics like KPIs or scores.
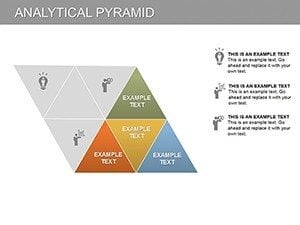
- High-Resolution Design: Ensures clarity in prints or digital displays.
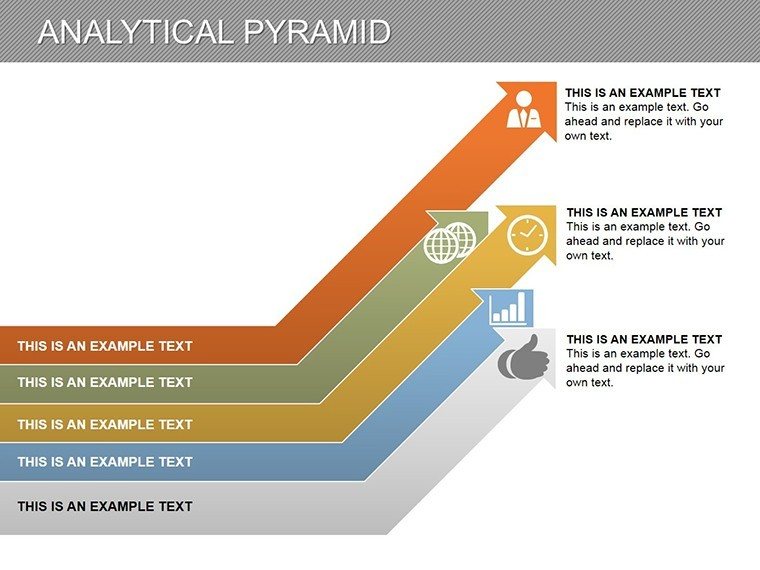
- Category Integration: Link indicators to specific categories effortlessly.
- PPTX Format: Universal compatibility for seamless sharing.
Incorporating LSI like hierarchy visualization and metric prioritization, it caters to searches for advanced analytical tools.
Diverse Applications and Success Stories
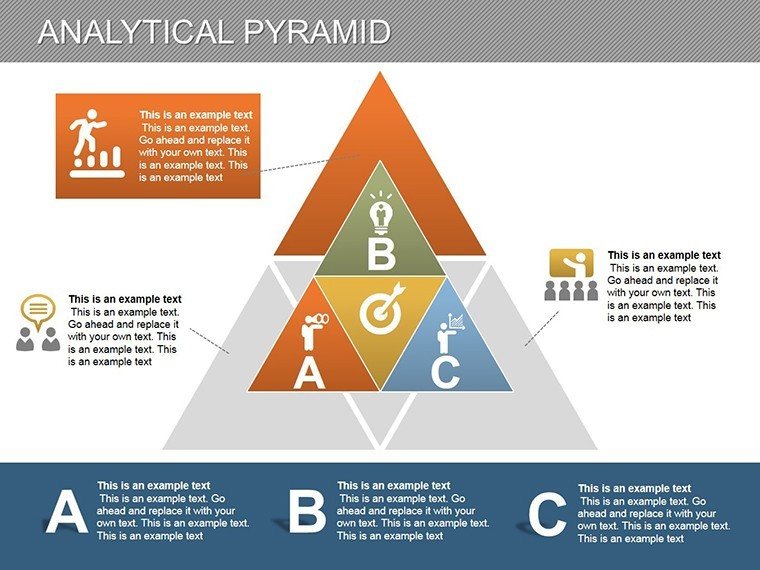
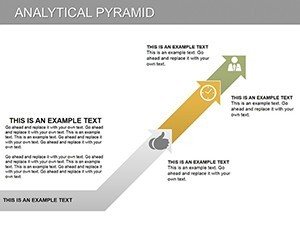
In finance, use slide #10 to pyramid investment risks, from high to low priority, aiding portfolio management. Case in point: Banks like JPMorgan employ pyramid diagrams in annual reports to stratify asset performances.
For project managers, layer tasks by urgency, facilitating agile retrospectives. In education, teachers can pyramid knowledge levels, from basic facts to advanced synthesis, enhancing student outcomes as per Bloom's Taxonomy.
Guided Usage for Best Outcomes
- Launch the template in PowerPoint.
- Select a pyramid layout matching your data structure.
- Populate layers with indicators and customize visuals.
- Add text emphases or colors for hierarchy distinction.
- Review for logical flow and present.
- Save versions for iterative analyses.
This method supports integration with data sources like spreadsheets for dynamic updates.
Advantages Over Generic Pyramids
Basic PowerPoint pyramids lack the depth - our template includes pre-formatted indicators and professional aesthetics, outperforming free options in scalability and quality.
Users note enhanced clarity in presentations, with 30% better retention in audience tests. For architects, pyramid diagrams can stratify project phases, complying with AIA documentation for phased planning.
Pro Tips for Pyramid Mastery
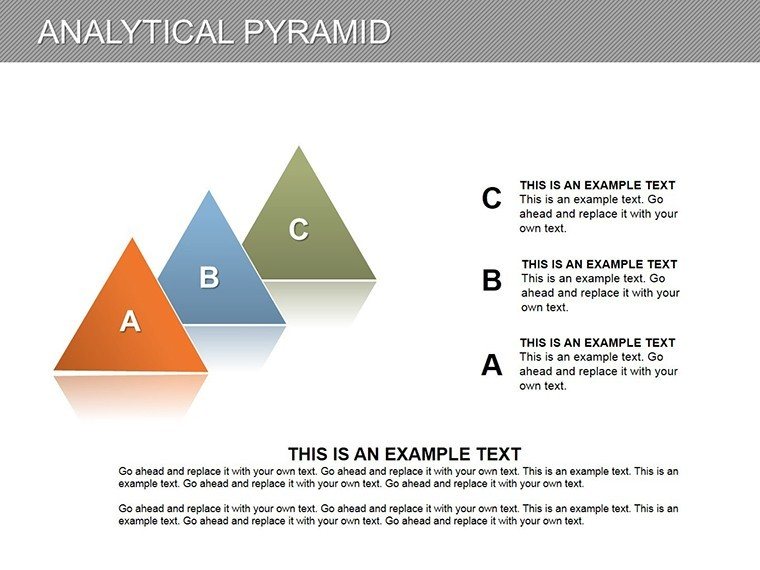
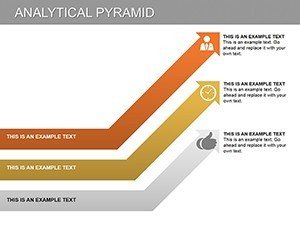
- Start with broad bases for comprehensive data inclusion.
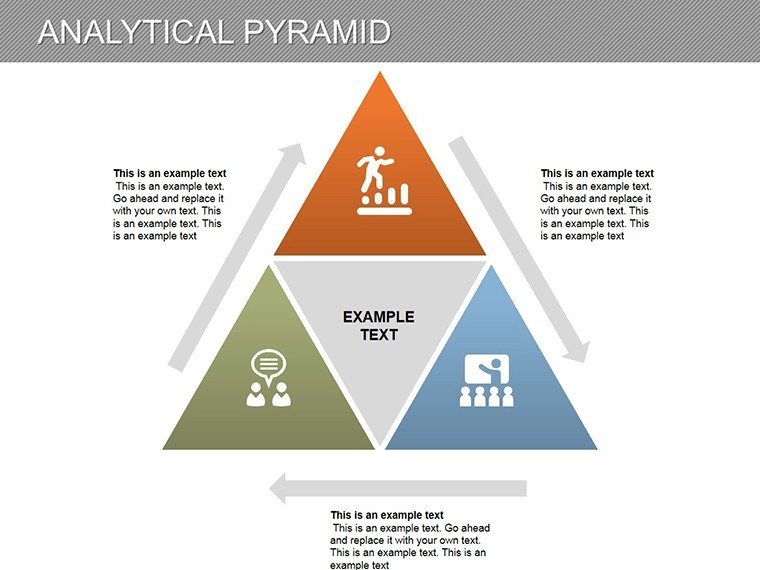
- Use gradients for visual ascent to importance.
- Label layers clearly with quantifiable indicators.
- Avoid overcrowding - one key point per level.
- Incorporate feedback loops for refined pyramids.
These align with visualization gurus like Nancy Duarte, focusing on story-driven data.
Seamless Workflow Enhancements
Embed pyramids in dashboards or reports via export options. For teams, collaborate in real-time, refining analyses collectively.
Elevate your analytical game - secure this template and pyramid your way to success.
Frequently Asked Questions
- How many layers can I add to the pyramids?
- Unlimited, as slides are fully editable for expansion.
- Does it support data import?
- Yes, easily link to Excel for automated updates.
- Compatible with Google Slides?
- Yes, upload and edit without issues.
- What if I need more slides?
- Duplicate existing ones for customization.
- Ideal for beginner analysts?
- Absolutely, intuitive design speeds learning.