Promo code "00LAYOUTS"
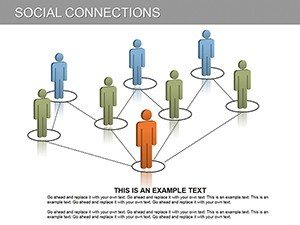
Social Network PowerPoint Diagrams: Connect Ideas Visually


Type: PowerPoint Diagrams template
Category: Relationship, Illustrations, Silhouettes & People
Sources Available: .pptx
Product ID: PD00120
Template incl.: 13 editable slides
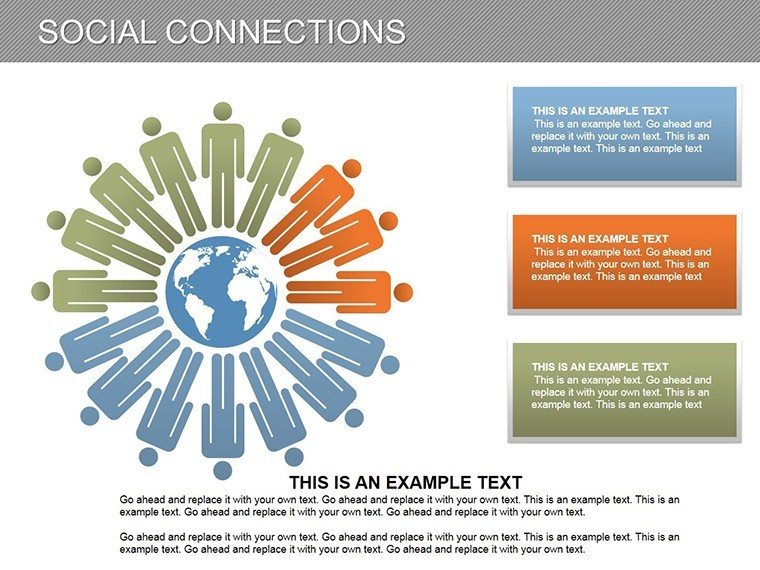
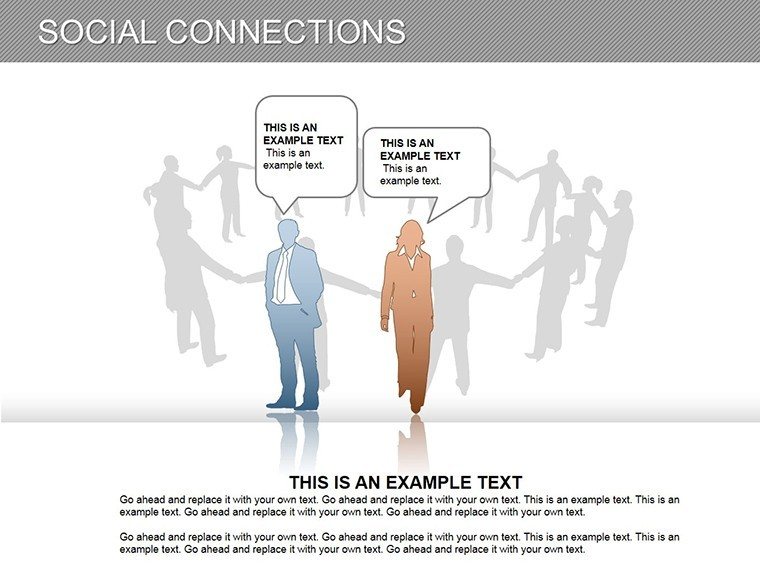
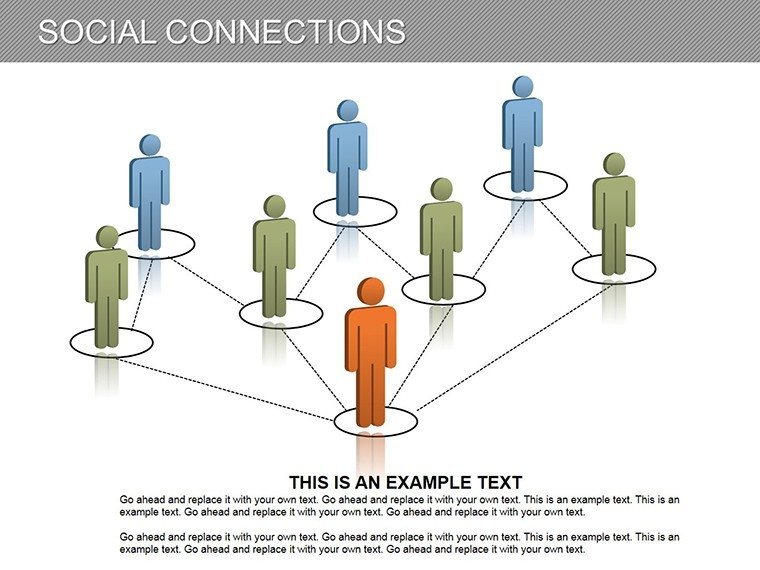
Navigating the web of relationships in today's interconnected world demands powerful visuals. Our Social Network PowerPoint Diagrams template, with 13 editable slides, is engineered for those who illustrate networks - be it social media strategies, organizational charts, or community mappings. This resource helps professionals convey links and hierarchies dynamically, turning tangled data into clear, engaging diagrams that resonate with viewers.
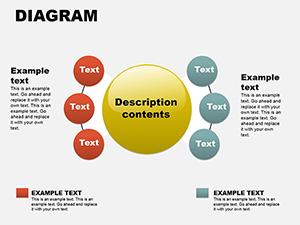
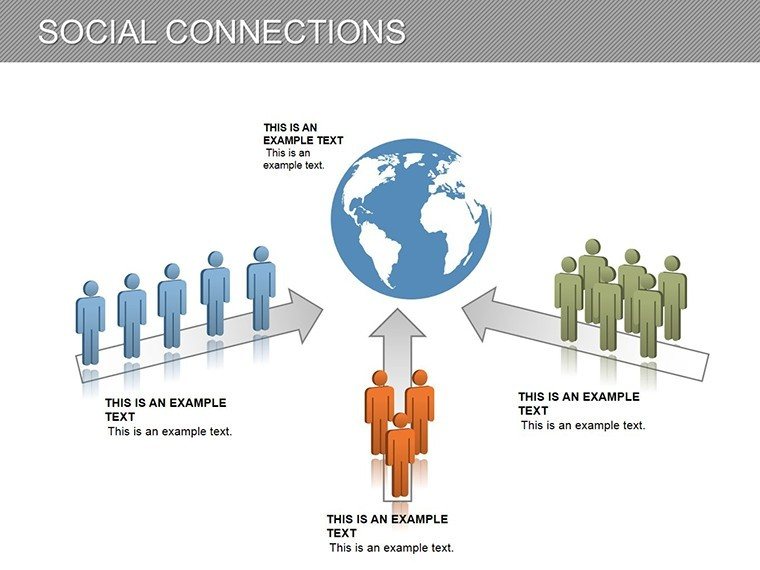
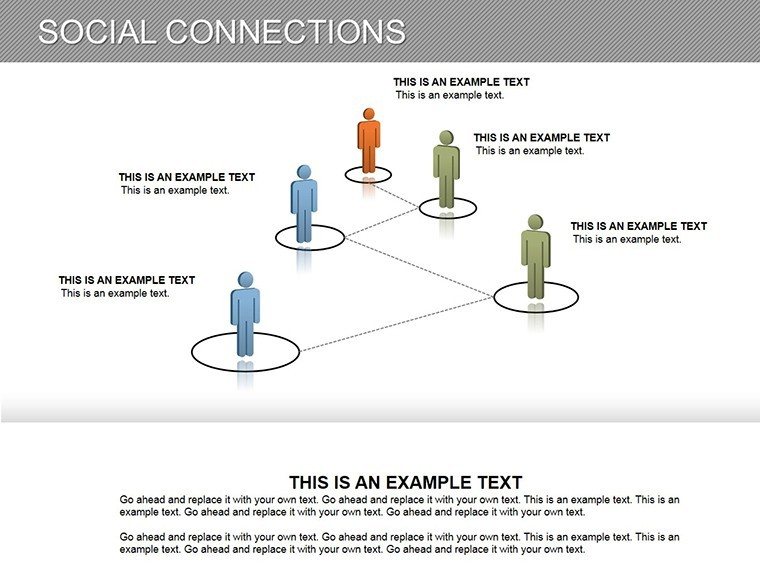
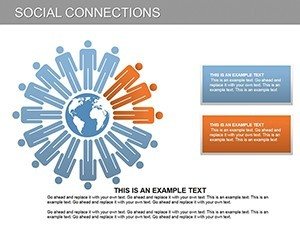
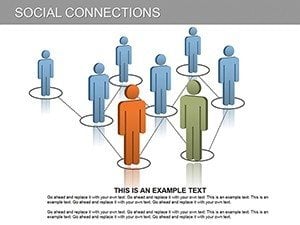
Think of a slide depicting a bustling network hub, with nodes branching out like conversations in a forum. Featuring social media icons and customizable layouts, it's inspired by network theory from sources like LinkedIn's design teams, ensuring your presentations foster understanding and spark discussions. Perfect for boosting in content, it positions you as an authority in relational visualizations.
Crafting Connected Narratives
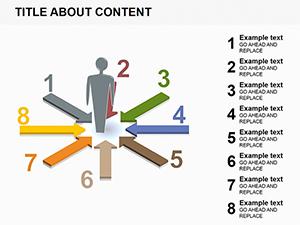
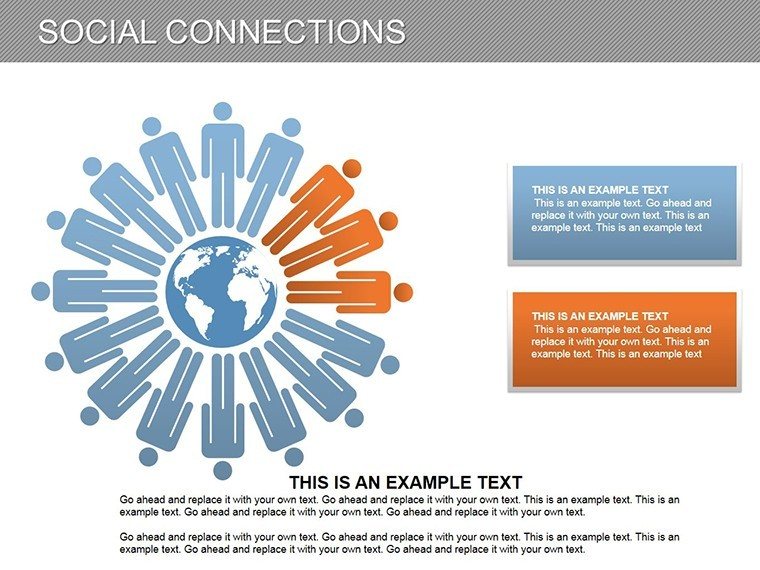
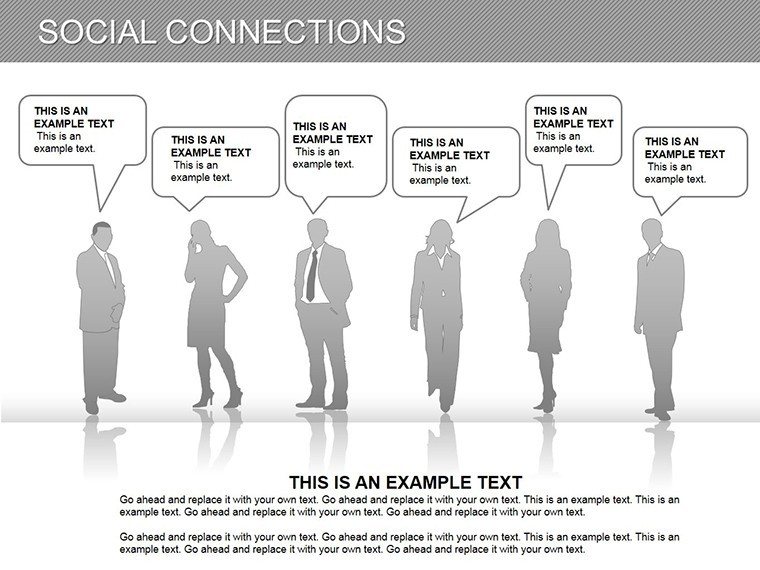
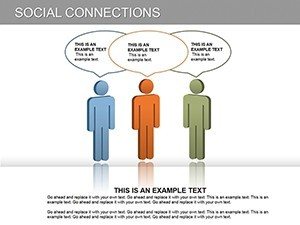
Social networks thrive on relationships; this template mirrors that with diagrams showing interconnections. For instance, map influencer ecosystems in marketing, highlighting key nodes for campaign targeting.
Core Features for Network Mastery
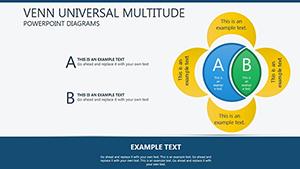
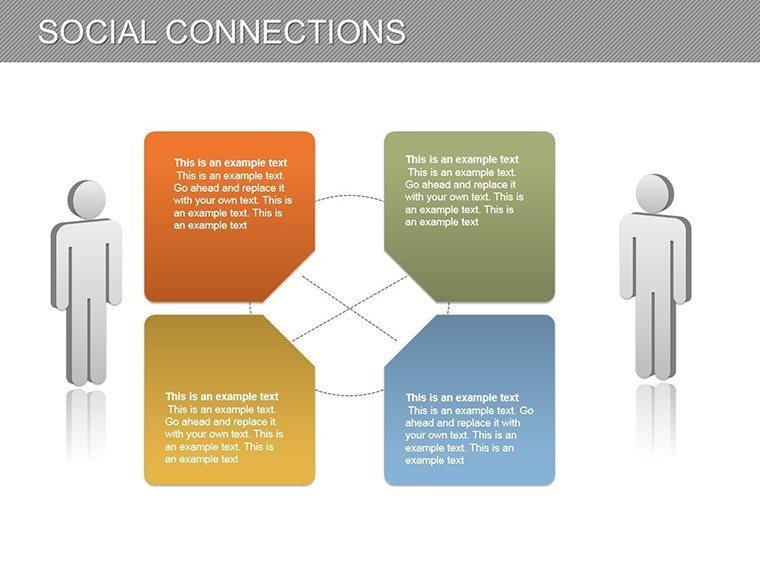
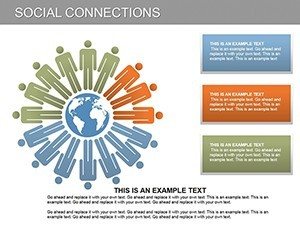
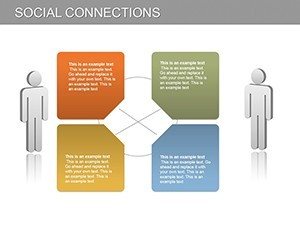
- Visualization Tools: Graphs for links, hierarchies, and flows.
- Icon Library: Social media symbols to add relevance.
- Data Charts: Integrate stats for research-backed networks.
- Customization Ease: Tweak colors, fonts, and layouts swiftly.
- Creative Designs: Unique setups to keep presentations fresh.
With LSI integration like connection mapping and relational graphics, it targets users seeking innovative diagram solutions.
Applications Across Sectors
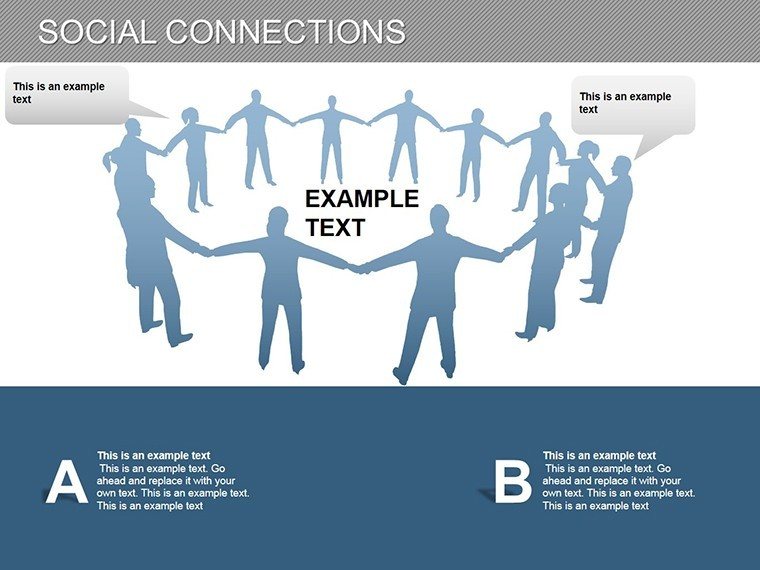
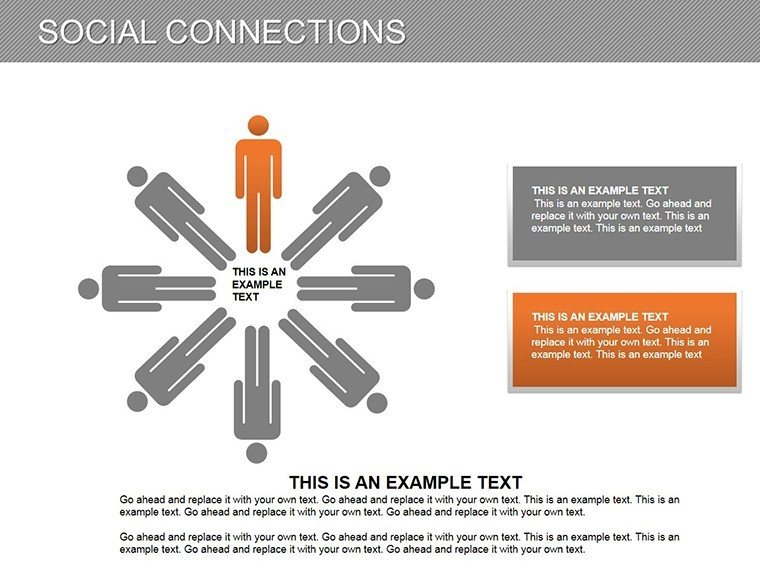
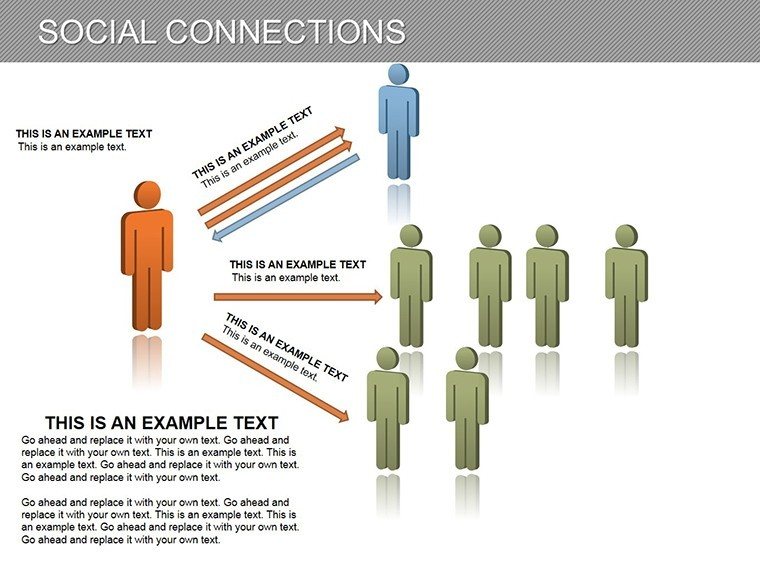
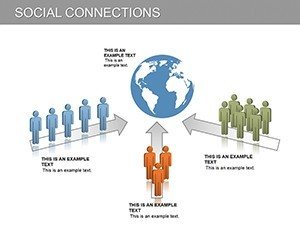
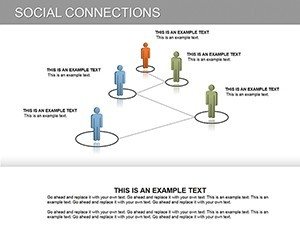
In business, use for org charts showing team interconnections, as seen in Google's hierarchical models. Educators can illustrate social theories, like Milgram's six degrees, enhancing classroom interactions.
Marketers benefit by visualizing audience segments, optimizing outreach. A case: Brands like Nike use network diagrams in strategy sessions to track endorsement webs.
Step-by-Step Network Building
- Open in PowerPoint and select a base diagram.
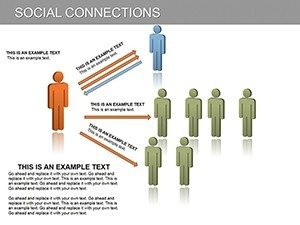
- Add nodes for entities and lines for connections.
- Customize with icons and colors for branding.
- Incorporate data via embedded charts.
- Animate for sequential reveals.
- Share for feedback and finalize.
This approach facilitates hybrid workflows, blending with tools like MindMeister for brainstorming.
Outshining Basic Network Tools
Generic PowerPoint lacks the themed icons and layouts here, offering superior engagement over freeware. Users experience quicker comprehension, vital in fast-paced environments like startup pitches.
For architects, network diagrams can represent stakeholder relations in projects, aligning with AIA collaboration standards.
Tips to Amplify Network Impact
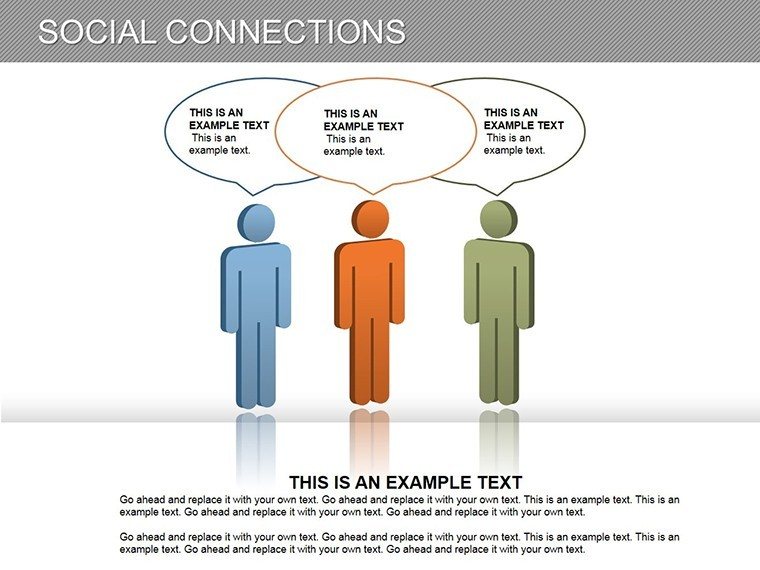
- Cluster nodes for thematic grouping.
- Use line weights to indicate strength of ties.
- Include legends for complex networks.
- Avoid dense clusters - space for readability.
- Layer interactivity with hyperlinks.
Grounded in graph theory experts like Albert-László Barabási, these enhance efficacy.
Workflow Optimization with Networks
Export to collaborative platforms or integrate with CRM data for live updates. Ideal for conferences, where networks visualize attendee interactions.
Build stronger connections - download this template and network your ideas effectively.
Frequently Asked Questions
- Can I expand the network diagrams?
- Yes, add nodes and connections freely.
- Are icons editable?
- Fully, for personalized touches.
- Suitable for large-scale networks?
- Yes, but use multiple slides for complexity.
- Compatible with other software?
- Yes, exports well to various formats.
- How to animate connections?
- Use PowerPoint's animation pane for paths.
- Any templates for specific industries?
- Customizable for any, including marketing or education.