Block Diagram PowerPoint Template: Simplify Complex Flows
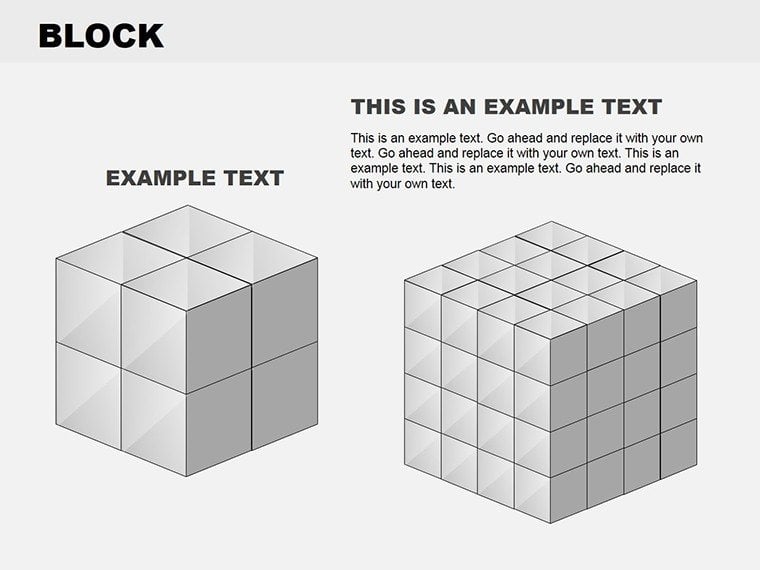


Imagine turning tangled workflows into crystal-clear visuals that your team grasps at a glance. That's the magic of the Block Diagram PowerPoint Template, crafted for professionals who need to map out systems, processes, and interactions without the hassle of starting from scratch. Whether you're a project manager outlining a new initiative or a consultant breaking down client operations, this template steps in as your reliable partner. With 16 fully editable slides, it uses simple shapes - rectangles for components, arrows for flows - to make even the most intricate ideas accessible and engaging.
Designed for real-world demands, it shines in business strategy meetings where every connection matters. Picture a marketing lead using these blocks to illustrate campaign funnels, showing how leads move from awareness to conversion. Or a financial analyst linking budget allocations with outcomes, ensuring stakeholders see the big picture. The beauty lies in its flexibility: tweak colors to match your brand, resize elements for emphasis, and layer in data seamlessly. Compatible with PowerPoint 2016 and later, it works across Windows and Mac, so your presentations stay polished no matter the setup.
This isn't just about pretty slides - it's about driving decisions. In environments like agile teams or executive briefings, where time is tight, these diagrams cut through noise, fostering discussions that lead to action. And with high-resolution graphics, your visuals hold up on any screen, from conference room projectors to laptop shares. Ready to streamline your next pitch? Grab this template for $20 and watch your ideas connect effortlessly.
Core Features That Streamline Your Workflow
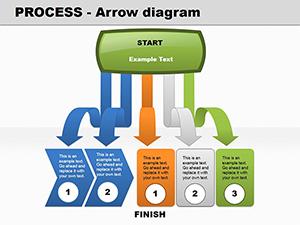
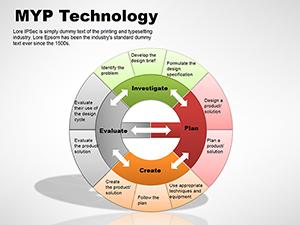
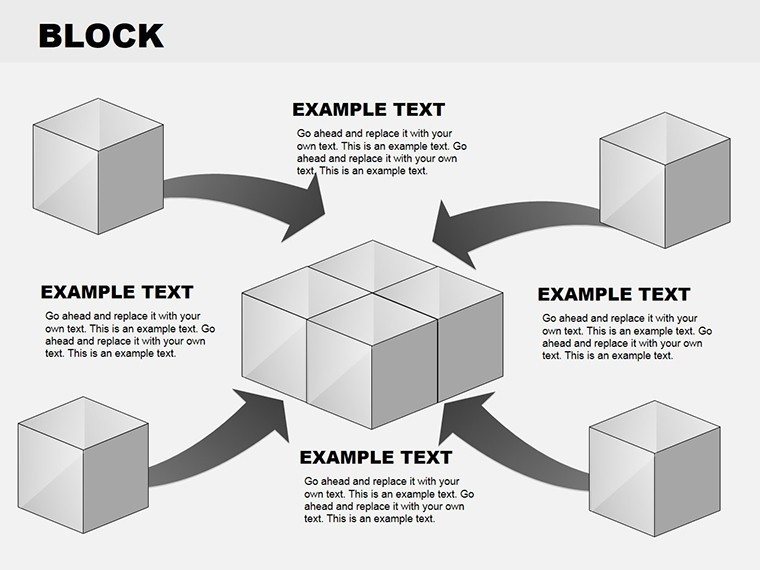
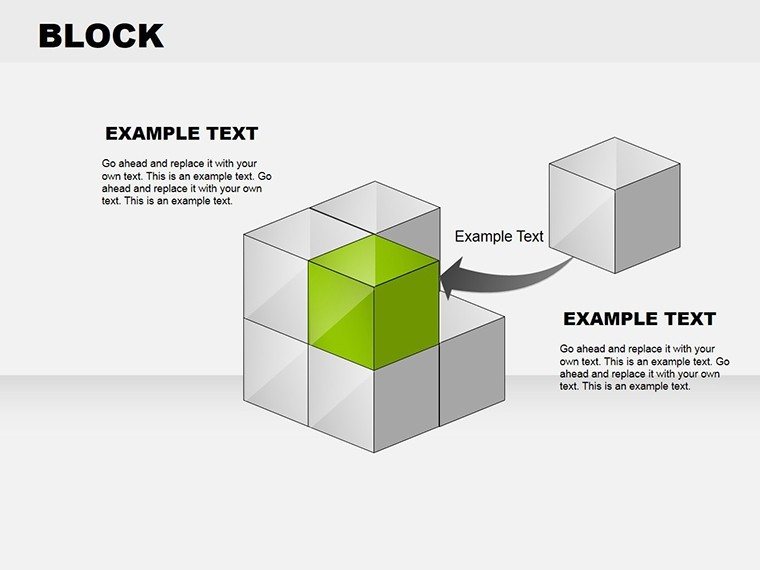
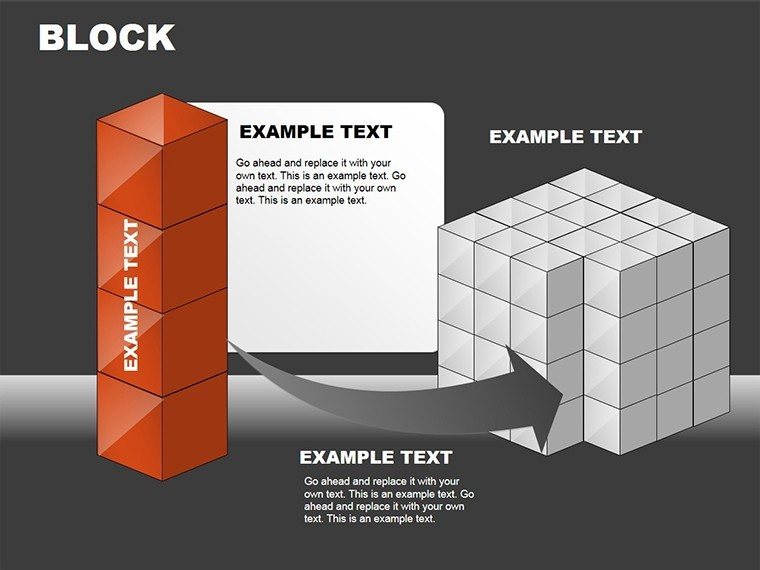
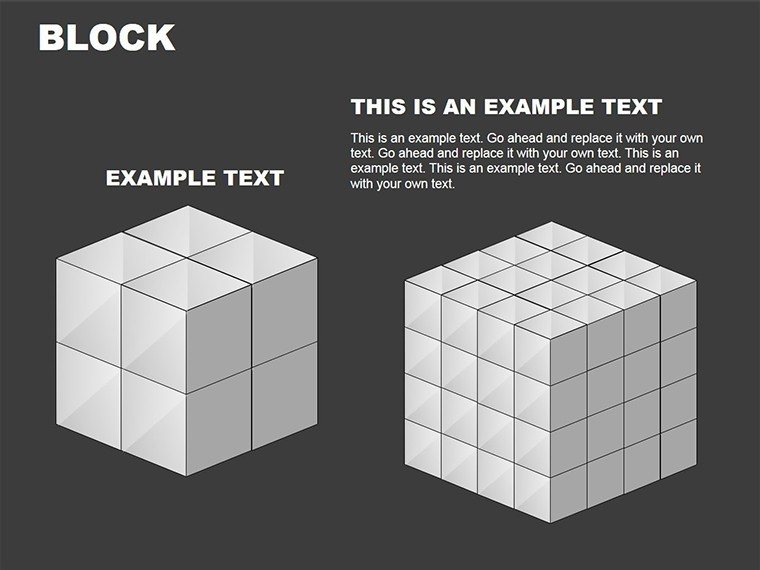
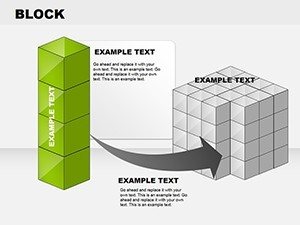
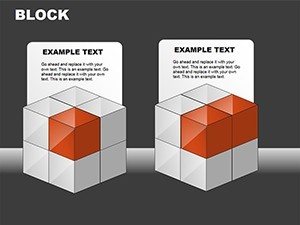
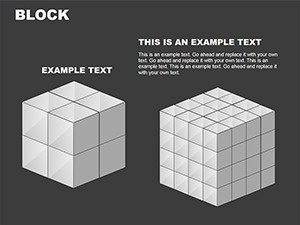
At the heart of this template are features built for efficiency and impact. Each slide starts with a clean canvas, populated with vector-based shapes that resist pixelation when scaled. You'll find variations like linear block chains for sequential processes, clustered blocks for parallel systems, and nested designs for hierarchical structures - giving you options to fit any narrative.
- Editable Everything: From text placeholders to line styles, nothing is locked. Swap a rectangle for a circle to represent a cycle, or adjust arrow thickness to denote priority levels.
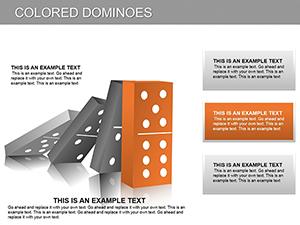
- Theme-Ready Icons: Integrated symbols for common elements like databases or decision points, sourced from professional libraries to ensure consistency.
- Animation Presets: Subtle builds that reveal blocks one by one, keeping audiences focused without overwhelming transitions.
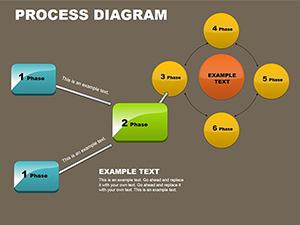
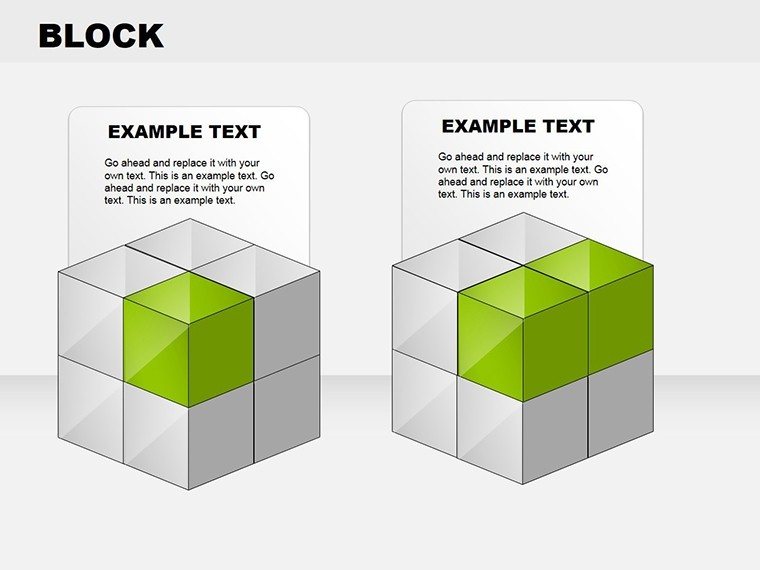
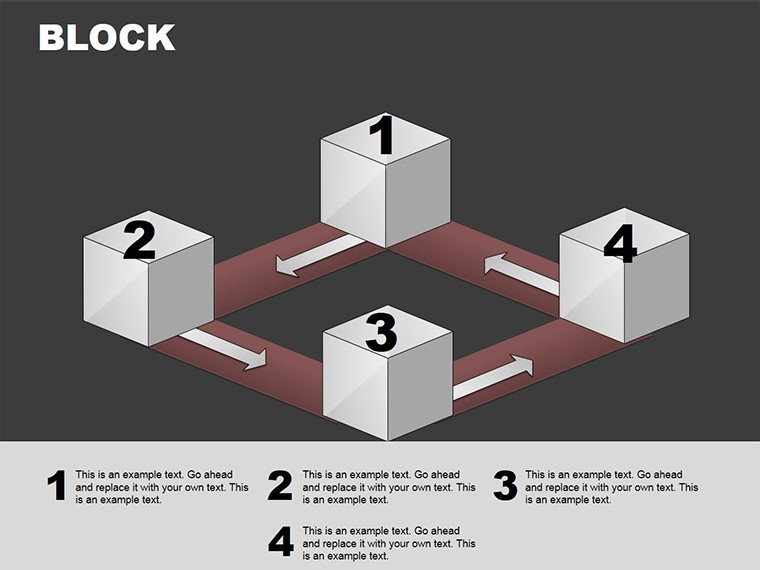
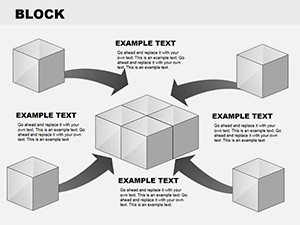
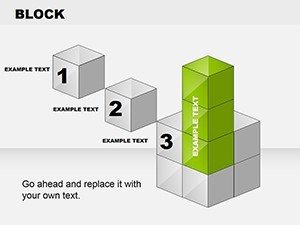
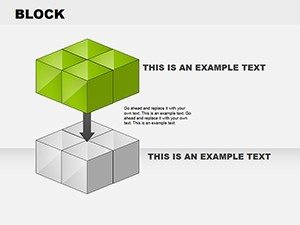
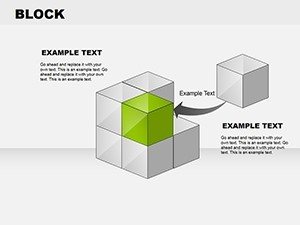
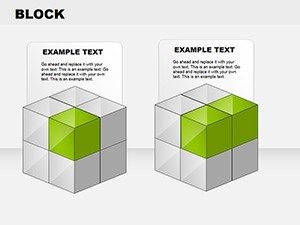
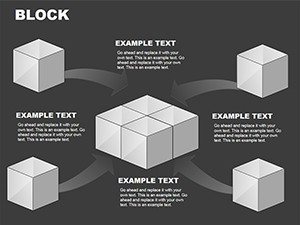
Take slide 5, for instance: a modular block setup ideal for SWOT analysis. Position strengths and opportunities in green-tinted blocks, threats in red - visually guiding viewers through your strategy without a word. Or slide 12, with interconnected nodes, perfect for supply chain overviews, where you can hyperlink blocks to detailed appendices.
Customization Tips for Maximum Impact
- Start with your core message: Identify the main flow, then build blocks around it.
- Color-code strategically: Use brand hues for familiarity, neutrals for clarity.
- Test on projections: Ensure line weights pop in low-light settings, adjusting as needed.
These tweaks, drawn from design practices in firms like McKinsey-inspired decks, ensure your diagrams don't just inform - they persuade.
Real-World Applications Across Industries
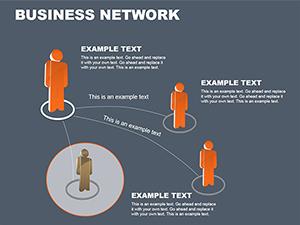
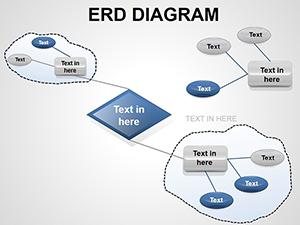
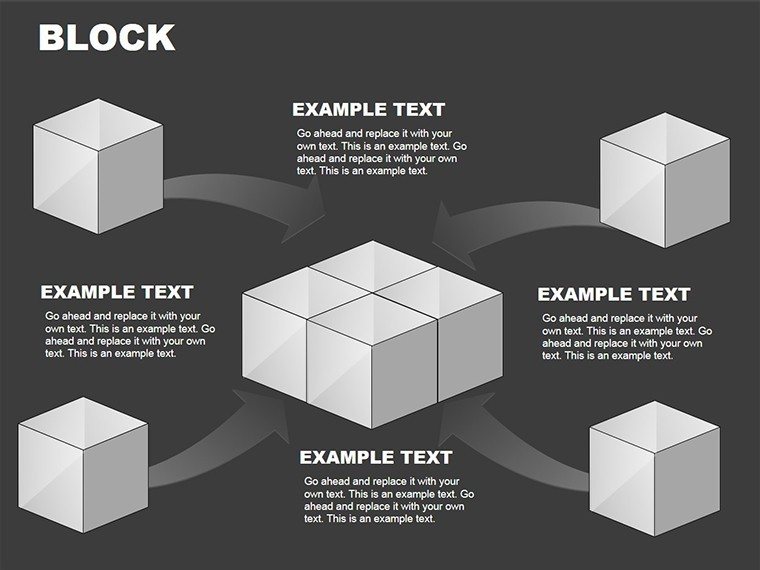
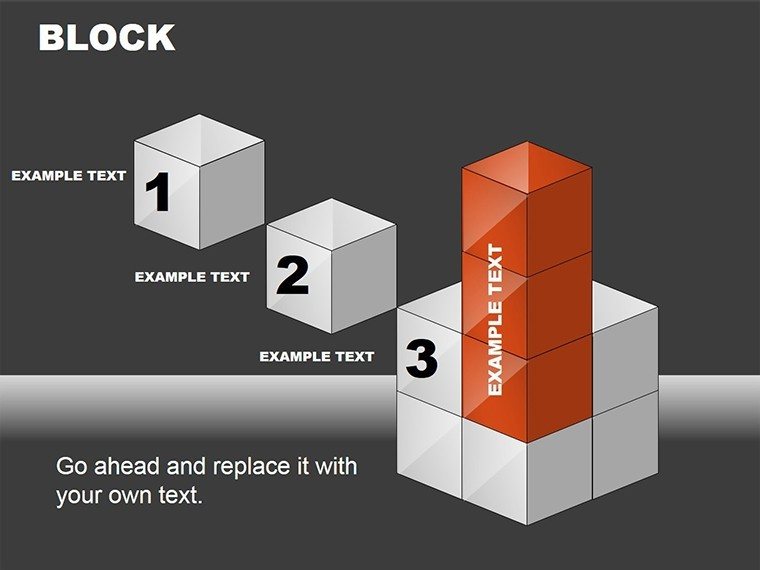
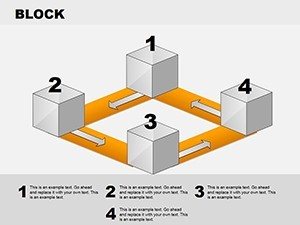
Block diagrams excel where clarity trumps complexity, making them indispensable in diverse scenarios. In project management, use them to chart timelines: Slide 8's timeline variant aligns milestones with dependencies, helping teams spot bottlenecks early. For IT professionals, slide 3's network layout visualizes server interactions, simplifying audits or upgrades.
Marketing teams love the funnel slides (like slide 10), where blocks narrow to show conversion rates - ideal for client reviews. Even in education, instructors adapt these for lesson plans, linking concepts in a way that resonates with visual learners. Consider a sales VP mapping territory coverage: Blocks represent regions, arrows sales pipelines, turning abstract goals into tangible plans.
Compared to basic PowerPoint shapes, this template saves hours by pre-arranging layouts, so you focus on content, not alignment. It's not generic clipart; these are purpose-built for professional storytelling, ensuring your audience leaves informed and inspired.
Integrating Blocks into Your Presentation Flow
Seamless integration starts with audience analysis. For executive overviews, lead with a high-level block map (slide 1), then drill down. In workshops, pair diagrams with interactive elements - add clickable blocks linking to polls or resources.
Workflow tip: Import your data via Excel links for dynamic updates, keeping financial reports fresh. Or embed icons from your asset library to personalize. The result? Presentations that feel custom-tailored, boosting engagement and retention.
One user, a operations consultant, shared how this template clarified a client's logistics overhaul, leading to quicker buy-in. Such outcomes highlight why versatile tools like these are game-changers.
Why Choose This Template for Your Next Project
Beyond aesthetics, it's the thoughtful details: Aspect-ratio optimized slides for widescreen, sans-serif fonts for readability, and grid-aligned elements for precision. Whether pitching to investors or training staff, these blocks bridge gaps, turning data dumps into dialogues.
Don't let disjointed slides dilute your message. Download the Block Diagram PowerPoint Template today for $20 and craft visuals that connect, convince, and convert.
Frequently Asked Questions
What formats does the template support?
It comes in .ppt and .pptx formats, fully compatible with PowerPoint 2016 and newer versions.
How many slides are included?
There are 16 editable slides, covering a range of block configurations.
Can I customize the colors and shapes?
Yes, all elements are vector-based and fully editable to match your branding.
Is it suitable for Mac users?
Absolutely, it works seamlessly on both Windows and Mac PowerPoint installations.
What industries is this best for?
It's ideal for business strategy, project management, marketing, and consulting presentations.