Business Communication PPT Diagrams: Weave Words into Impact


Type: PowerPoint Diagrams template
Category: Process, Relationship, Organizational
Sources Available: .pptx
Product ID: PD00080
Template incl.: 14 editable slides
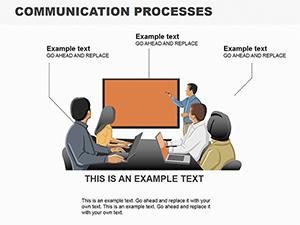
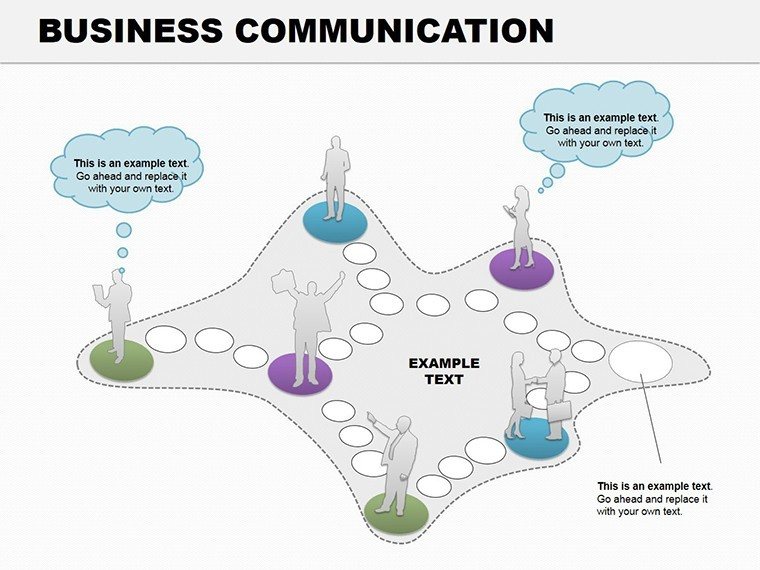
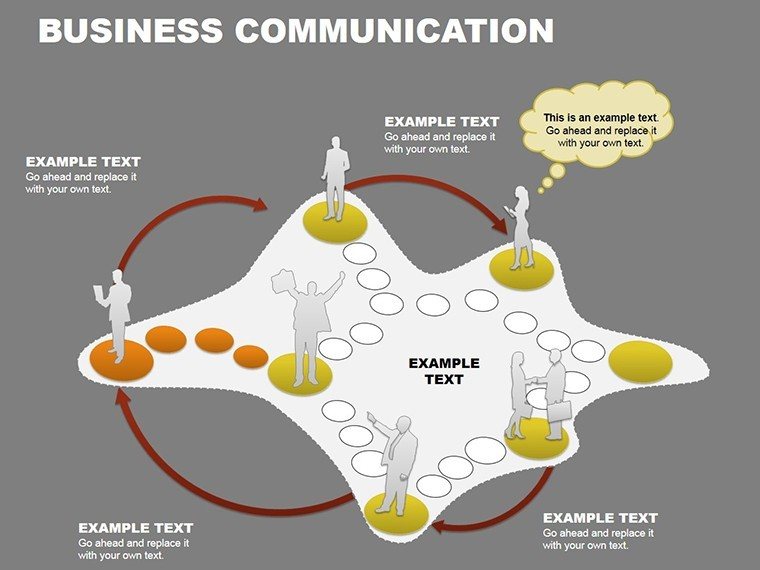
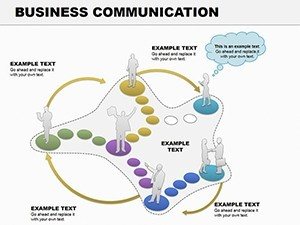
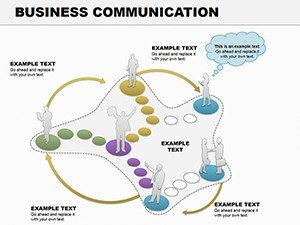
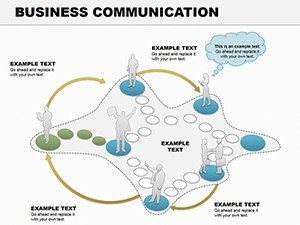
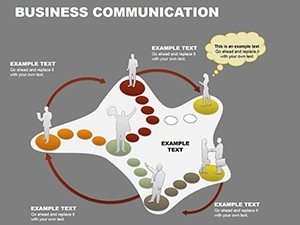
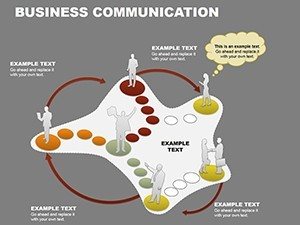
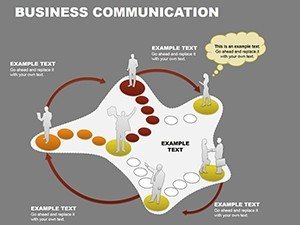
Communication in business thrives on clarity, yet too often it's lost in jargon jungles. Enter the Business Communication PPT Diagrams template: 14 editable slides arming professionals with flowcharts, timelines, infographics, and org charts to convey ideas crisply. At $14 for PowerPoint .pptx (2016+), it's crafted for reports, pitches, and updates - helping marketers map campaigns, managers chart projects, and consultants illuminate strategies.
This deck transcends bullets, fostering visual storytelling that captivates, from executive summaries that stick to team huddles that align. Modern designs ensure polish, while deep customizability lets you infuse brand voice seamlessly.
Robust Features for Expressive Visuals
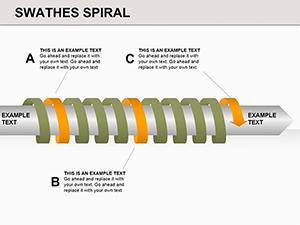
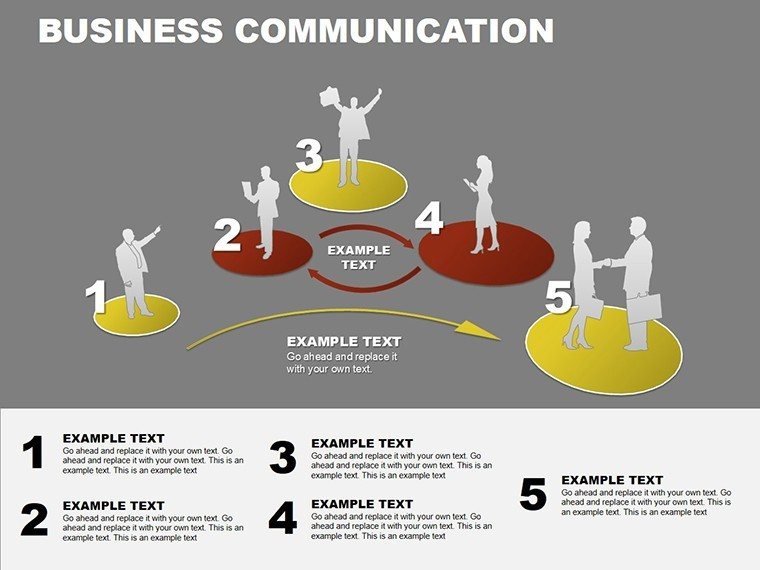
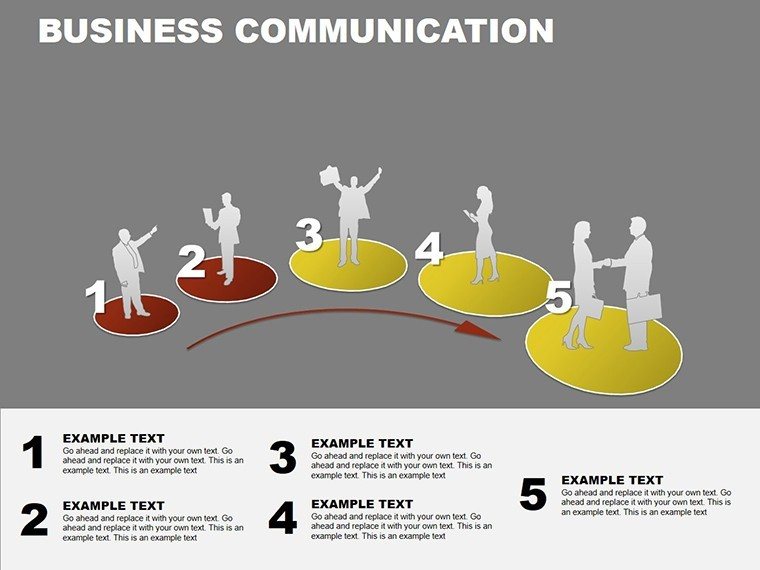
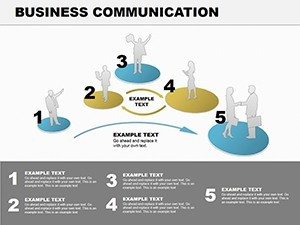
Slide 1's flowchart traces decision trees, nodes branching with yes/no paths - ideal for process overviews, editable shapes morphing to fit. Slide 2 timelines horizontal sweeps for milestones, Gantt overlays for dependencies.
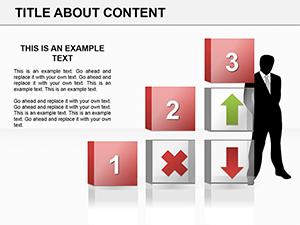
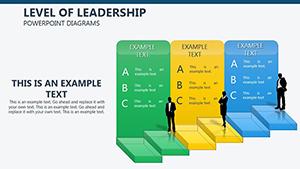
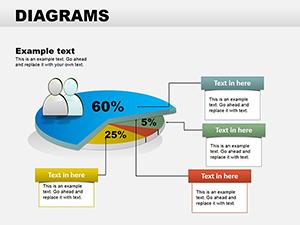
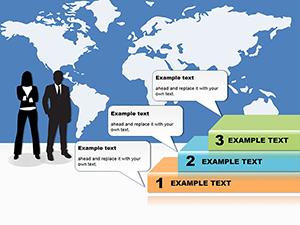
Infographics dominate Slides 3-6: pie deconstructions for market shares, bar evolutions for trend lines, pyramid hierarchies for priority stacks, and Venn overlaps for synergies. Org charts in Slides 7-9 layer roles with photo placeholders, connector styles varying from flat to traditional.
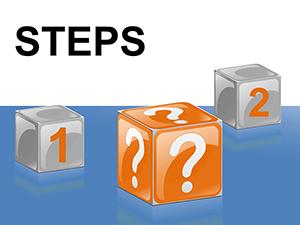
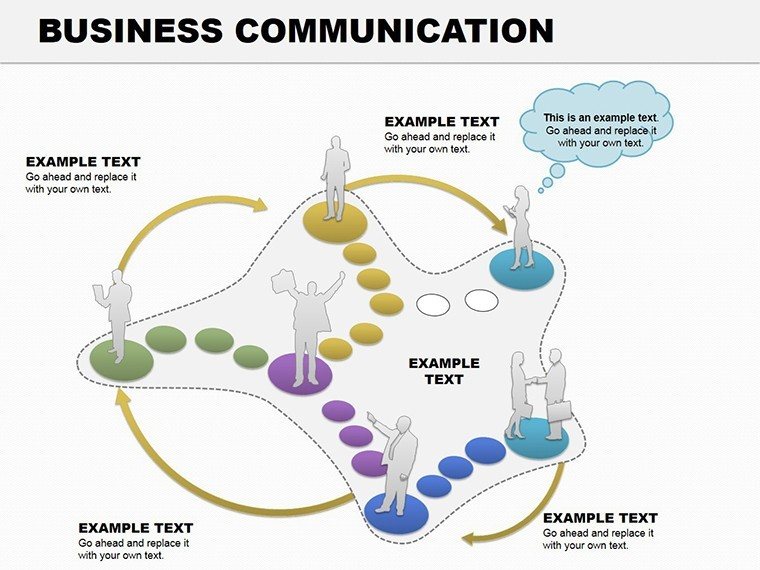
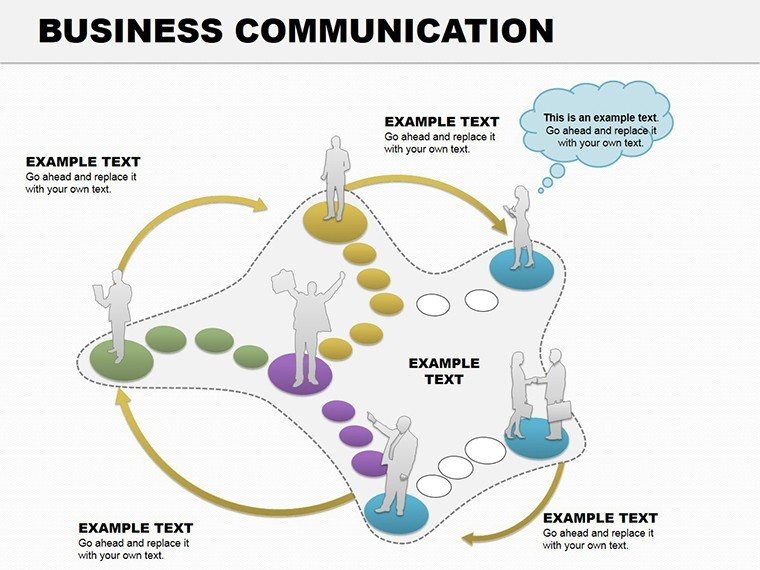
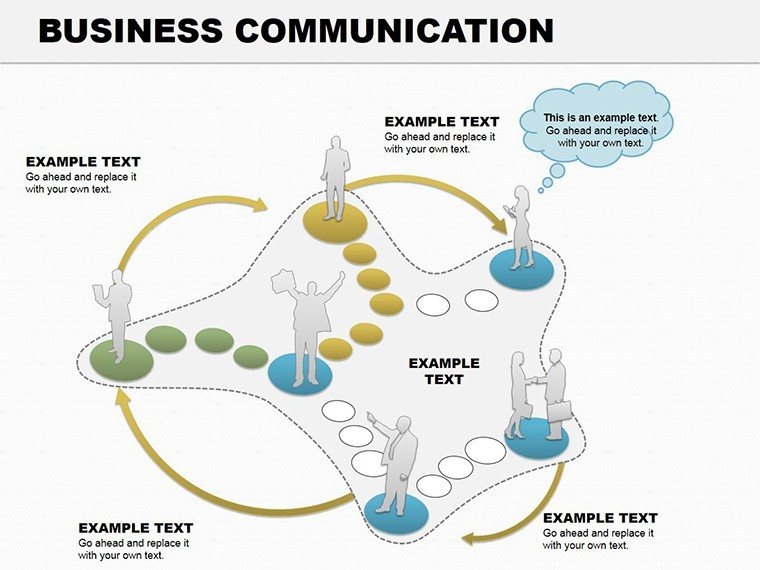
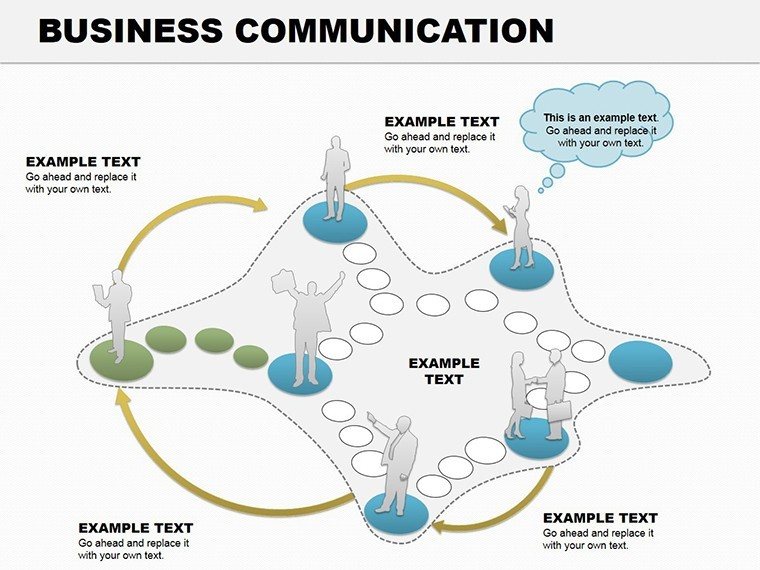
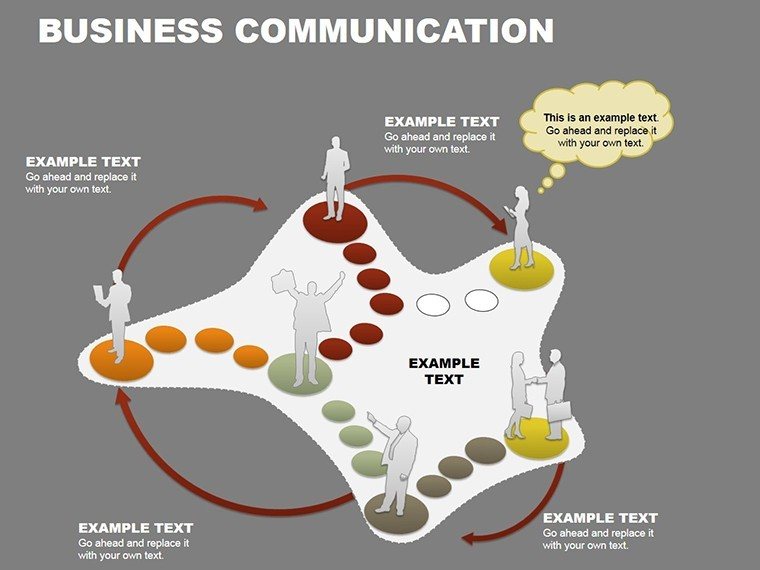
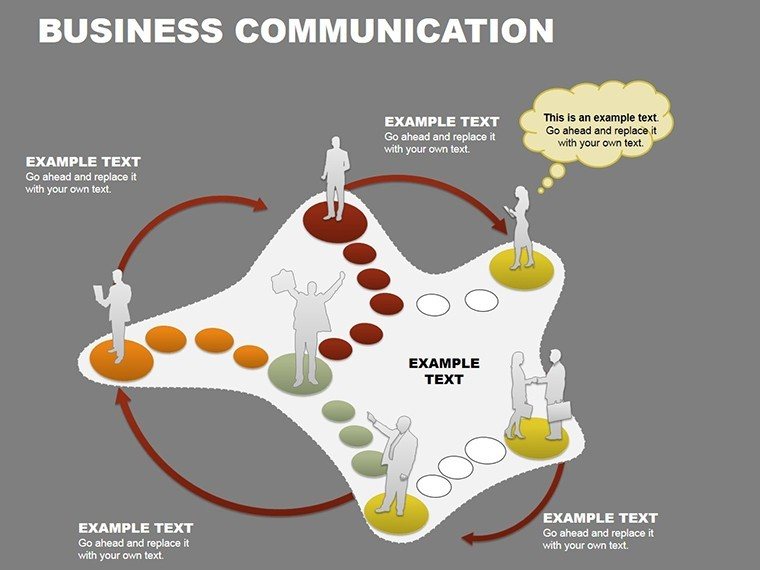
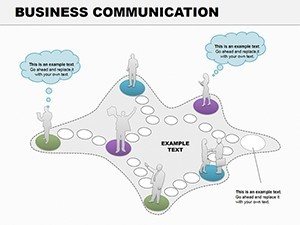
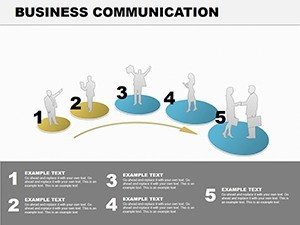
Slides 10-12 tackle narratives: cycle diagrams for feedback loops, radial mindmaps for brainstorming, and step funnels for sales pipelines. Slide 13 aggregates data dashboards, and 14 closes with a call-to-action canvas.
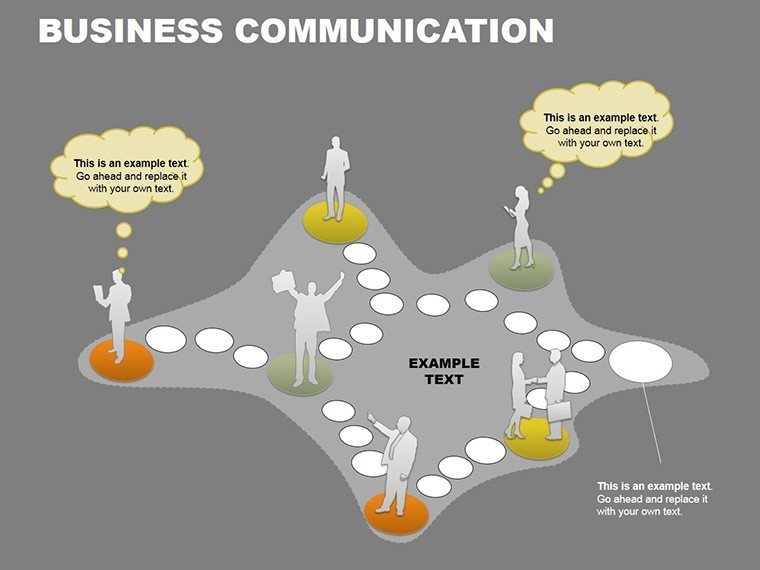
- Modern Aesthetics: Clean lines, sans-serif fonts for readability across rooms.
- Shape Versatility: All elements vector, resize freely without pixelation.
- Font Flexibility: Embed custom typefaces for consistent branding.
These empower your slides to communicate as effectively as your words, bridging gaps effortlessly.
Dynamic Use Cases Across Roles
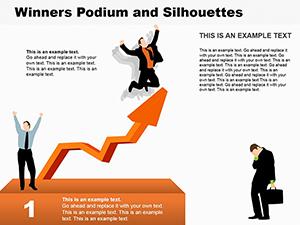
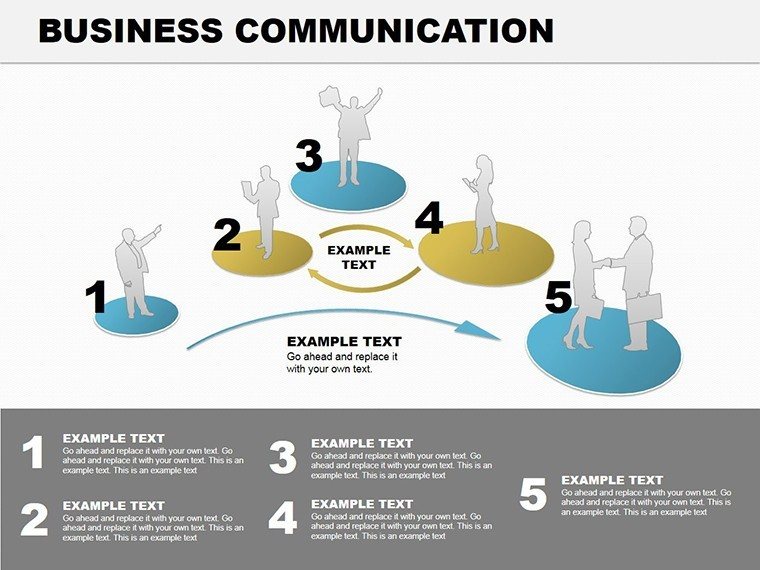
A marketing coordinator, facing campaign ROI scrutiny, deployed Slide 5's pyramid to layer objectives from awareness to conversion - stacked metrics animated top-down, clarifying attribution. Project managers favor Slide 2: input dates, watch bars fill, revealing crunch points for reallocation.
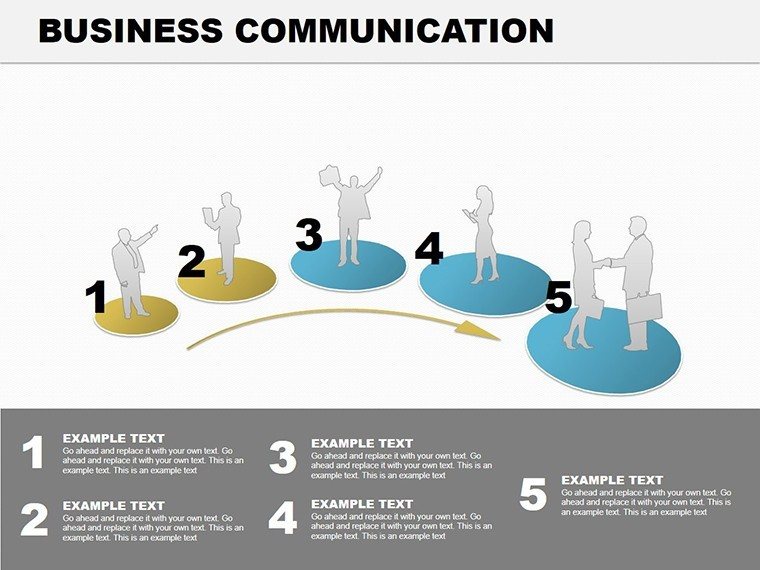
In consulting, Slide 10's cycles visualized client retention loops, linking service touchpoints to loyalty lifts. Educators use org charts for role clarifications in case studies. Guide: 1) Outline message core. 2) Select apt diagram, populate via paste. 3) Harmonize colors. 4) Animate reveals for pacing.
- Define Goal: Pinpoint key message per slide.
- Input Content: Bullet to visual conversion quick.
- Polish: Align to grid for pro finish.
- Deliver: Notes guide verbal ties.
Such integrations make communication a strength, not a struggle.
Tips to Amplify Your Message
Sync with PowerPoint's designer for auto-suggestions, but override for precision. Keep visuals to 3-5 elements; as in Aristotle's rhetoric, ethos via polish, pathos through relatability. For remote, high-contrast ensures visibility.
A sales VP adapted funnels for pipeline forecasts, color-coding stages - boosting forecast accuracy via visual cues. Save masters for reuse; hyperlink to appendices for depth without deck bloat.
Connect and Convert Now
Transform talks into triumphs - secure the Business Communication PPT Diagrams template and speak volumes visually.
Frequently Asked Questions
Diagram variety?
Flowcharts, timelines, infographics, org charts - broad toolkit.
PowerPoint versions?
2016+ fully supported.
Brand adaptation?
Colors, fonts swap easily for cohesion.
Team collaboration?
Cloud sharing compatible for joint edits.
Time to adapt?
10-25 minutes average per slide.
Export versatility?
To images, PDFs, or interactive HTML.