Promo code "00LAYOUTS"
Process Block Schemes PowerPoint Template
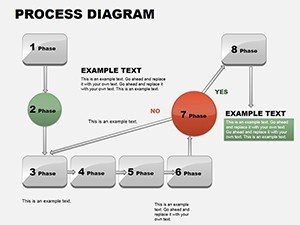
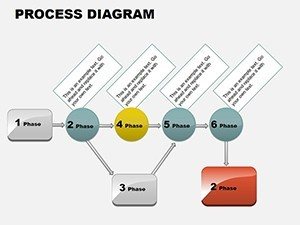
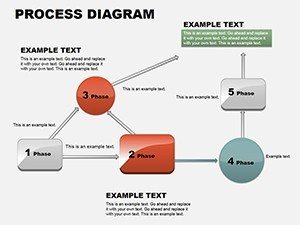
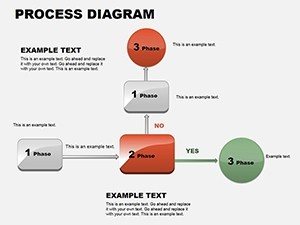
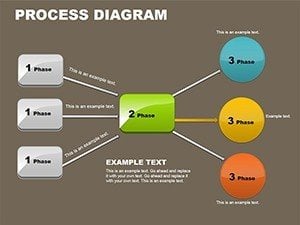
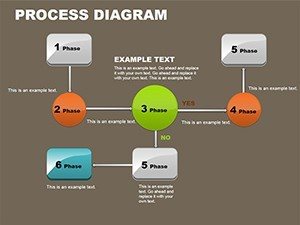
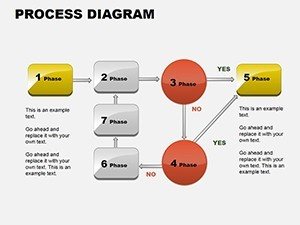
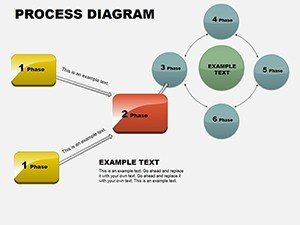
Imagine turning intricate production lines or administrative workflows into clear, engaging visuals that everyone on your team can grasp at a glance. That's the power of our Process Block Schemes PowerPoint diagram template. Designed for professionals in manufacturing, operations management, and business analysis, this template offers 18 fully editable slides that break down processes into their fundamental operations, interactions, and sequences. Whether you're mapping out a new assembly process or optimizing office procedures, these diagrams help foster a shared understanding among stakeholders, making it easier to identify bottlenecks and implement enhancements.
Core Features That Set This Template Apart
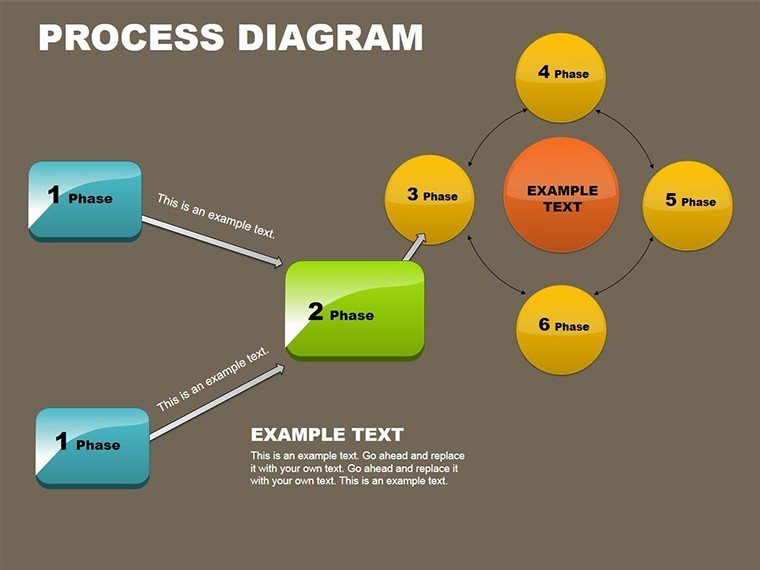
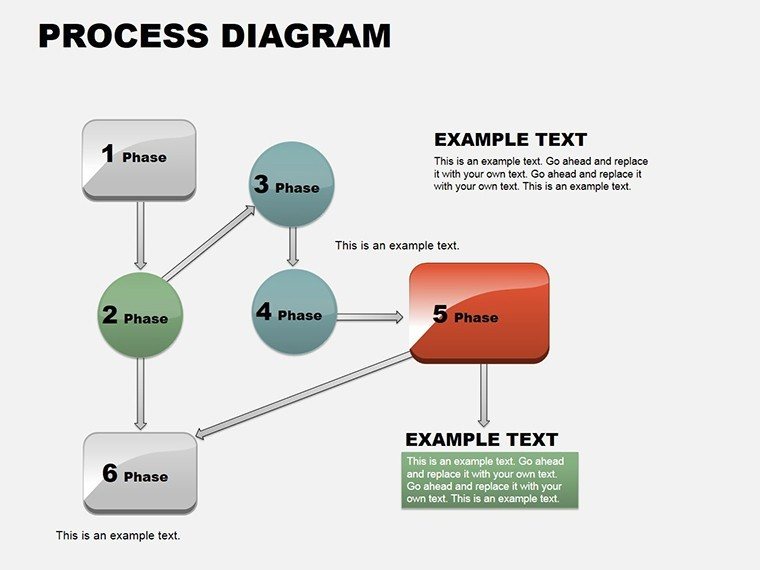
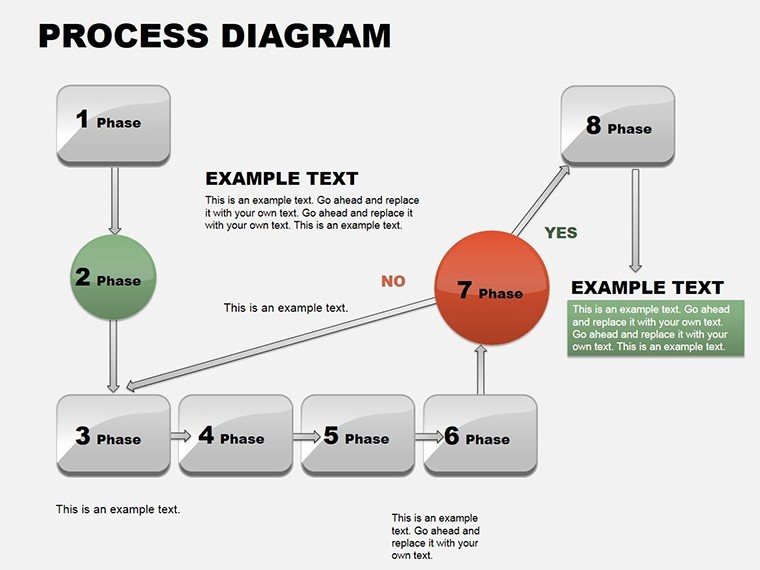
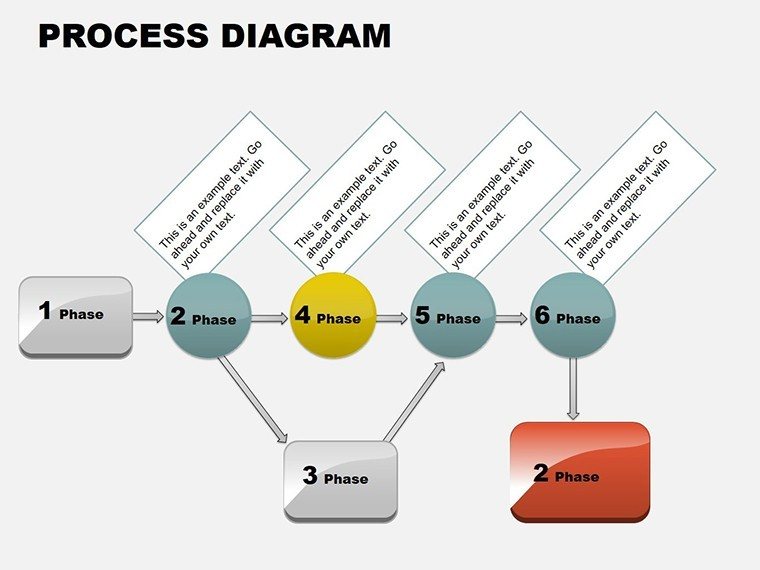
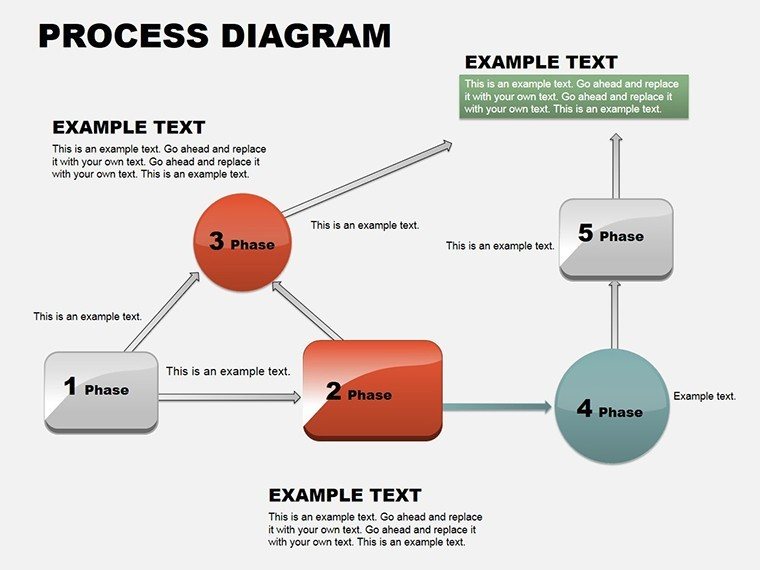
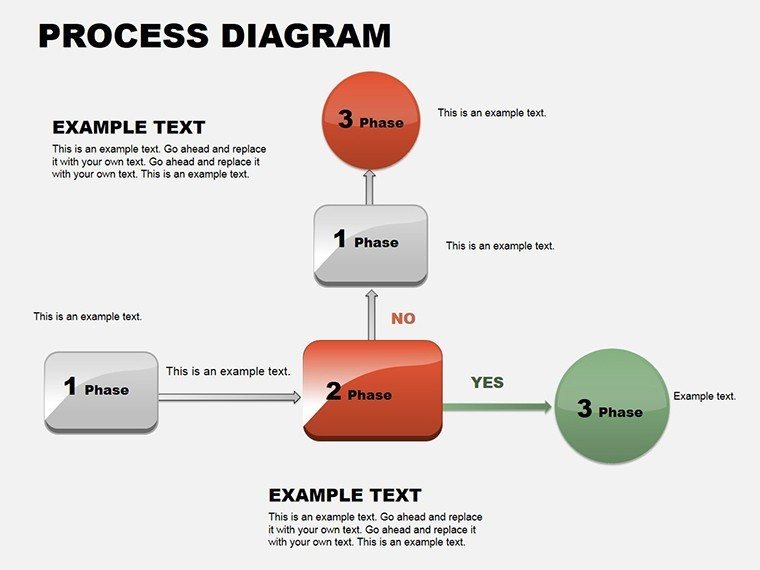
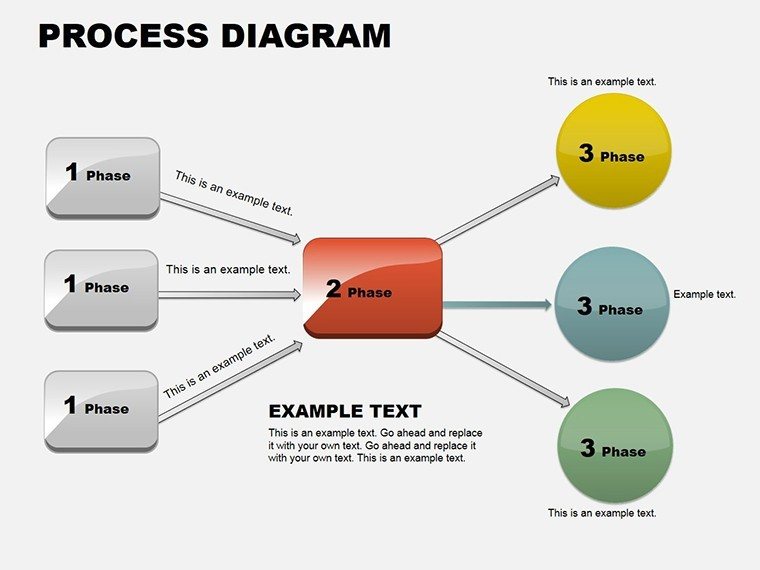
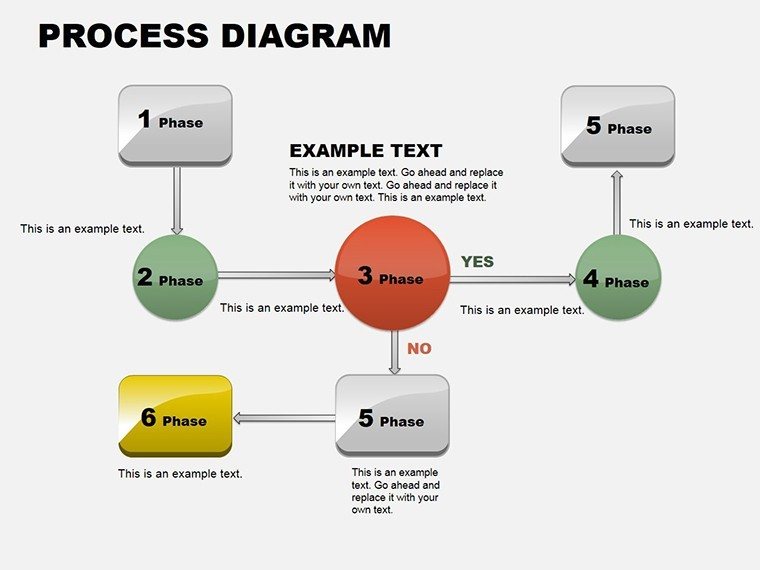
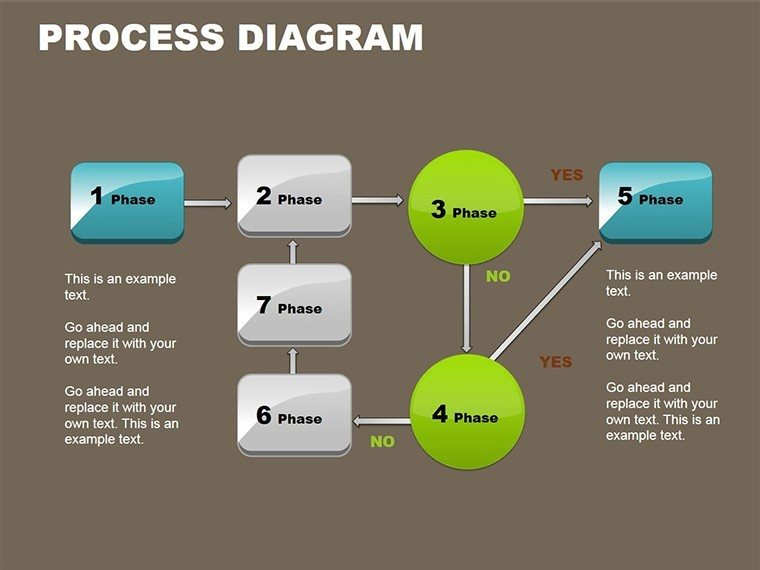
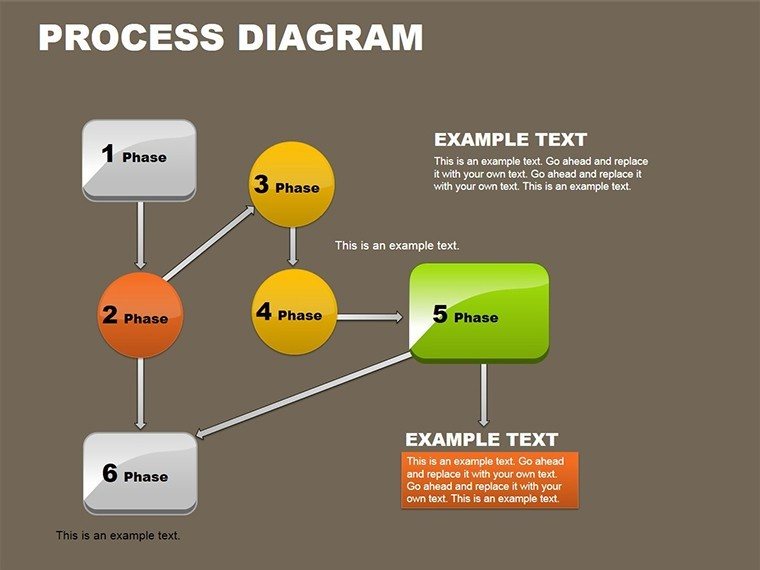
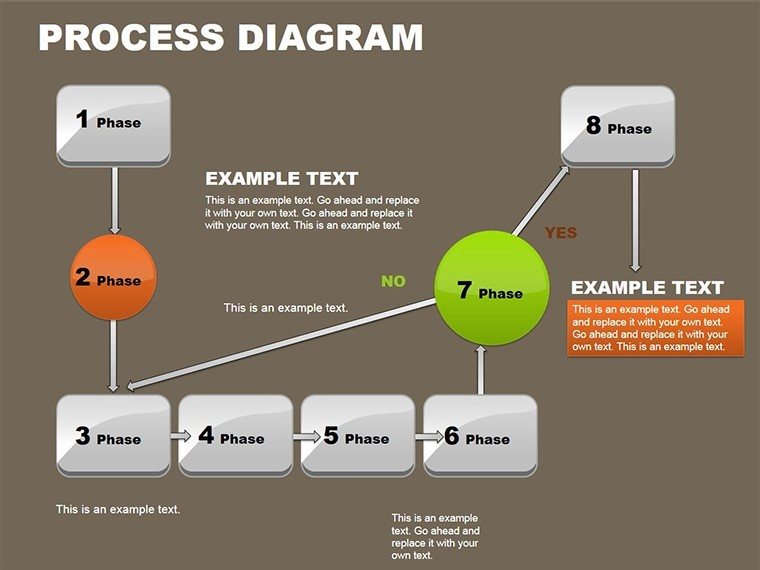
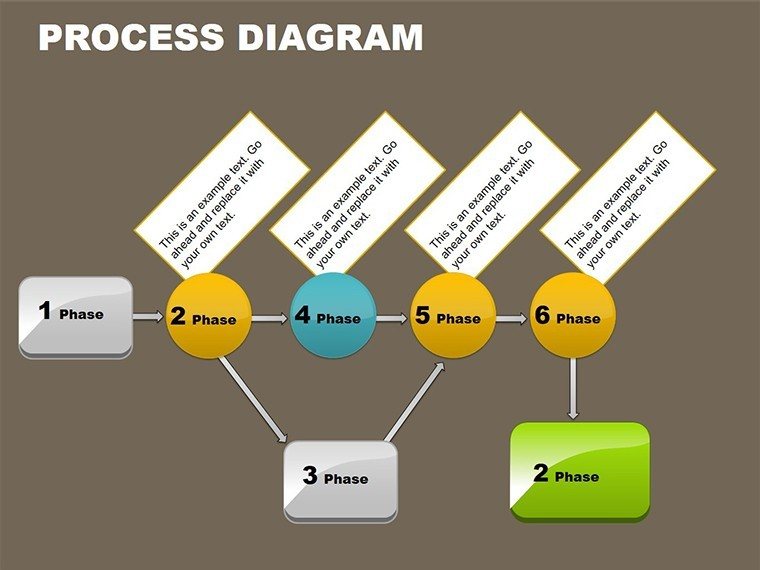
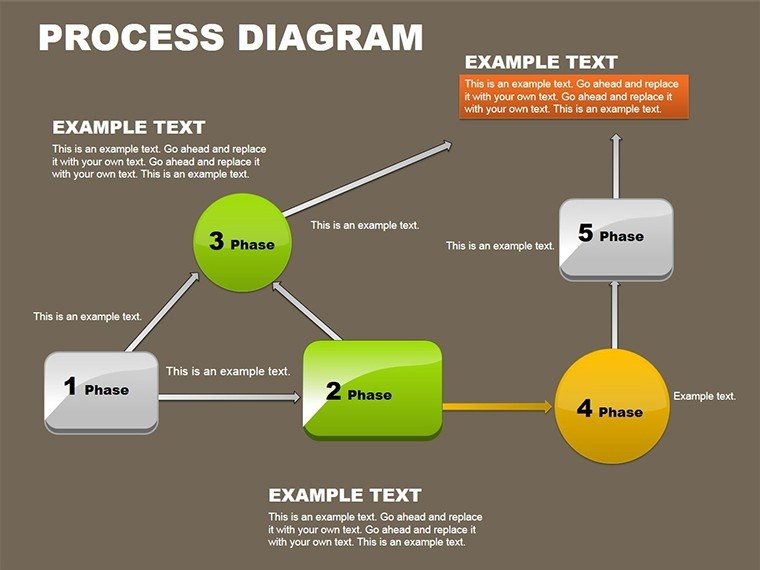
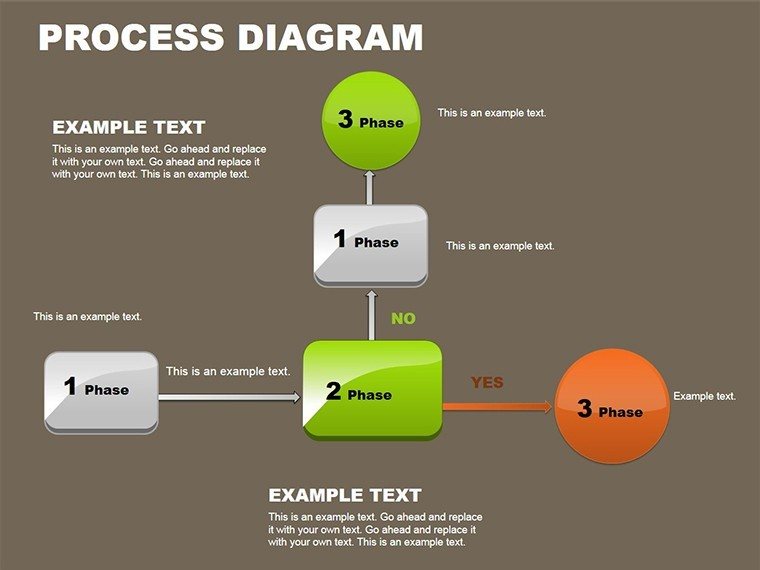
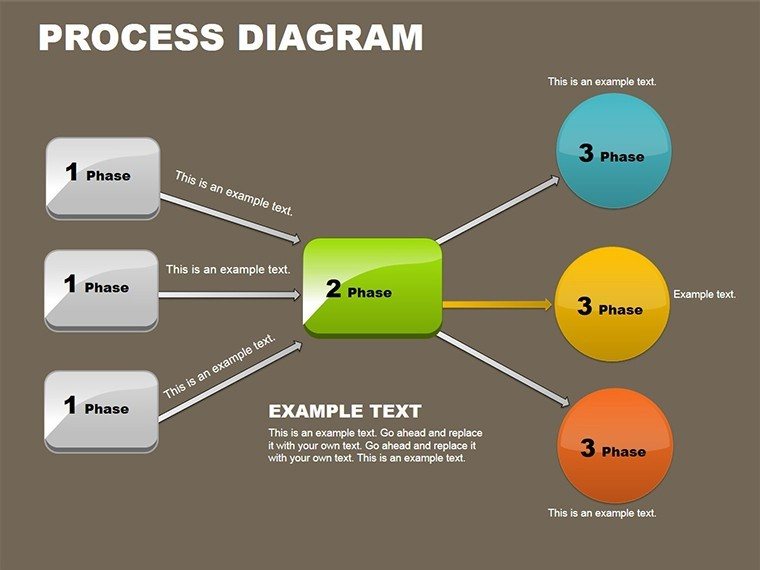
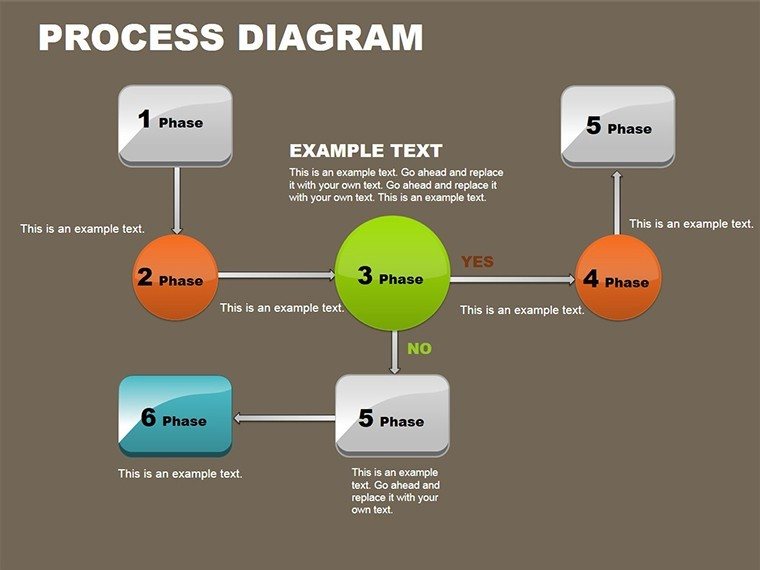
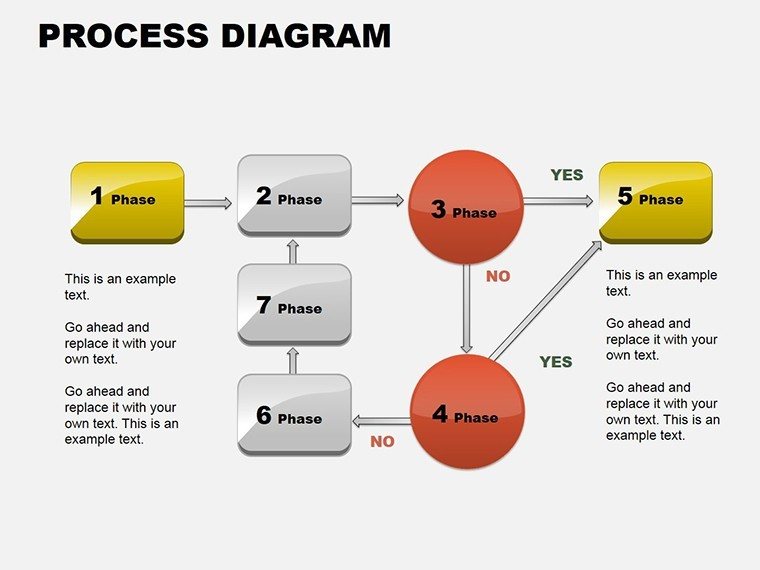
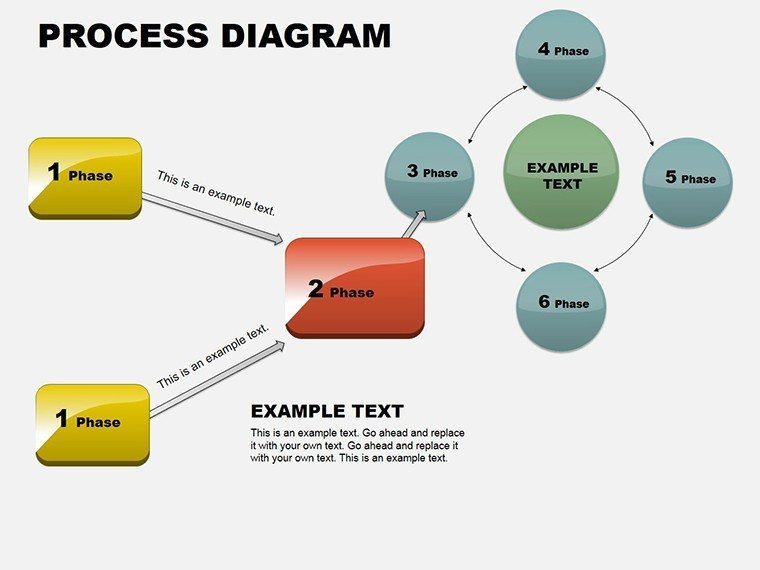
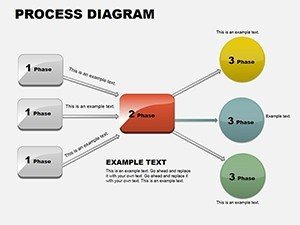
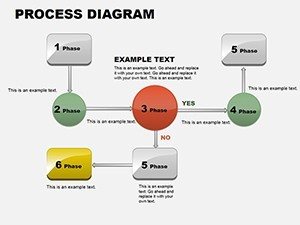
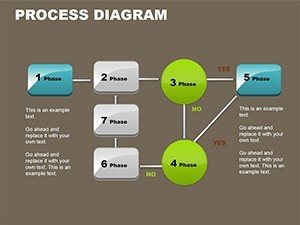
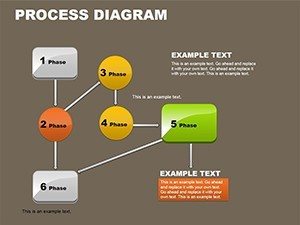
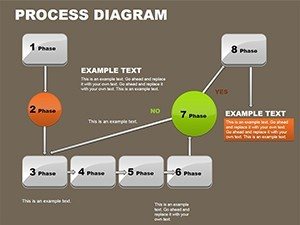
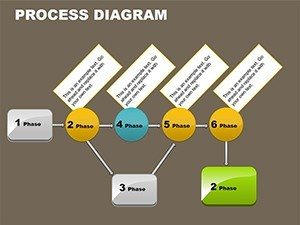
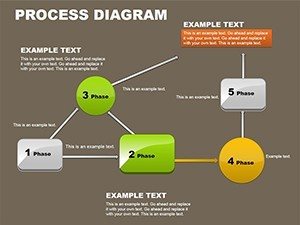
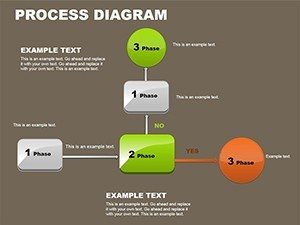
At the heart of this template are versatile block schemes that adapt to your specific needs. Each slide incorporates elements like tables for data organization, arrows for directional flow, and process icons that highlight key steps. Compatible with PowerPoint 2016 and later versions, the template ensures seamless integration into your existing workflow. You can resize, recolor, and rearrange components without losing quality, thanks to vector-based graphics. For instance, one slide might feature a linear block scheme ideal for sequential tasks, while another uses branched arrows to depict decision points in administrative approvals.
Think about how these features play out in real scenarios. A quality control manager could use the table-integrated blocks to chart inspection stages, adding custom text to note compliance checks. The arrows provide visual cues for progression, ensuring presentations remain dynamic rather than static lists. This level of customization not only saves time but also elevates the professionalism of your decks, much like how lean manufacturing experts use similar visuals to train teams on efficiency gains.
Practical Applications Across Industries
Dive deeper into how this template shines in various settings. In production environments, visualize assembly processes where each block represents a machine operation, connected by arrows showing material flow. This approach mirrors techniques used in automotive plants to reduce downtime. For administrative tasks, map out HR onboarding with blocks for document submission, training sessions, and final approvals - helping new hires navigate the system effortlessly.
Consider a project manager preparing for a quarterly review. Start with a basic slide outlining the project's phases, then layer in tables for timelines and resources. The result? A compelling narrative that persuades executives of your strategy's viability. Or, in educational contexts, instructors might adapt these schemes to teach supply chain concepts, using arrows to illustrate vendor-to-customer journeys.
Step-by-Step Customization Guide
- Open the template in PowerPoint and select a slide that matches your process type, such as a multi-arrow block for complex interactions.
- Edit text placeholders with your operation details - keep it concise for impact.
- Adjust arrow directions and colors to align with your brand or to emphasize critical paths.
- Incorporate tables for data like time estimates or responsible parties, using built-in formatting tools.
- Preview in slideshow mode to ensure smooth transitions, then save and share.
This methodical process ensures your diagrams not only inform but also inspire action, drawing from proven visualization principles that enhance comprehension.
Why Choose This Over Standard PowerPoint Tools
Built-in PowerPoint shapes can feel limiting - rigid grids and basic arrows that require hours of tweaking. Our template bypasses that with pre-designed, harmonious elements tailored for process mapping. Unlike generic options, these slides include thematic consistency, such as subtle gradients on blocks for depth, making your presentations stand out in boardrooms or client meetings. A logistics coordinator, for example, might contrast a cluttered default diagram with our polished version to better communicate supply routes.
Moreover, the template's focus on user-tested designs means less trial and error. Professionals who've used similar tools in process reengineering projects appreciate the intuitive layout, which aligns with standards like those in operations management textbooks.
Enhancing Your Workflow Integration
Integrate this template into your daily tools effortlessly. Link slides to Excel data for dynamic updates, or embed them in reports for comprehensive documentation. For teams using collaborative platforms, the editable nature supports real-time edits during virtual sessions. Picture a cross-functional team refining a service delivery process: one member adds blocks for customer touchpoints, another inserts arrows for feedback loops - all within minutes.
To maximize value, pair with complementary assets like timeline charts for long-term planning. This holistic approach turns isolated diagrams into a full presentation arsenal, boosting overall productivity.
Ready to make your processes visually compelling? Download this Process Block Schemes PowerPoint template now and start mapping success.
Frequently Asked Questions
- How editable are the diagrams in this template?
- Every element, from blocks to arrows, is fully customizable. You can change colors, sizes, and text using standard PowerPoint tools.
- Is this compatible with older PowerPoint versions?
- It's optimized for PowerPoint 2016 and above, but basic features work in earlier versions with minor adjustments.
- Can I use these for non-business processes?
- Absolutely - adapt them for educational, personal planning, or any sequential mapping needs.
- What file formats are included?
- You'll receive .ppt and .pptx files for broad compatibility.
- How many slides are there?
- 18 editable slides, each offering unique variations on process block schemes.

