Versatile Pentagon PowerPoint Diagrams Template
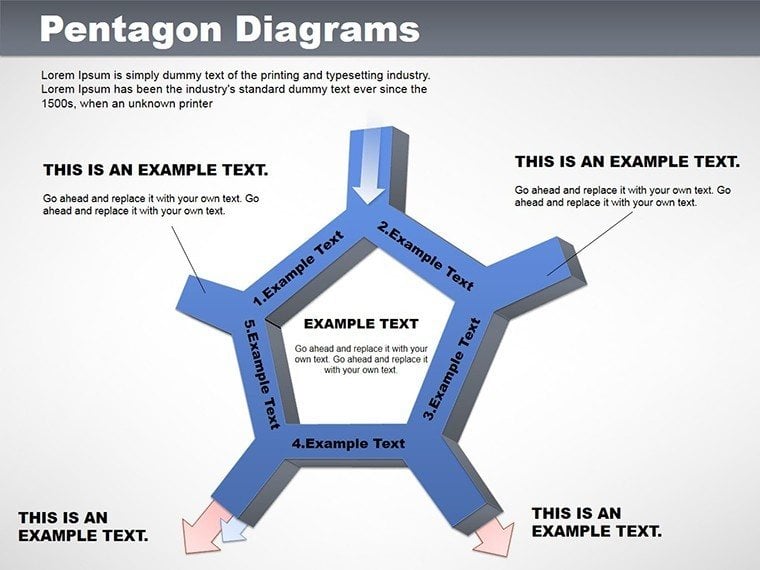


Picture distilling a multifaceted business model into a single, intuitive shape that reveals connections at a glance. Our Pentagon PowerPoint Diagrams template delivers exactly that, with 9 editable slides centered on a five-sided figure tailored for depicting processes, cycles, and interdependencies. Suited for analysts mapping economic ties or managers outlining operational flows, this template turns abstract ideas into concrete visuals. Compatible with PowerPoint 2010 onward, it allows quick modifications via simple clicks, ensuring your diagrams align perfectly with your content's demands.
Standout Features for Effective Visualization
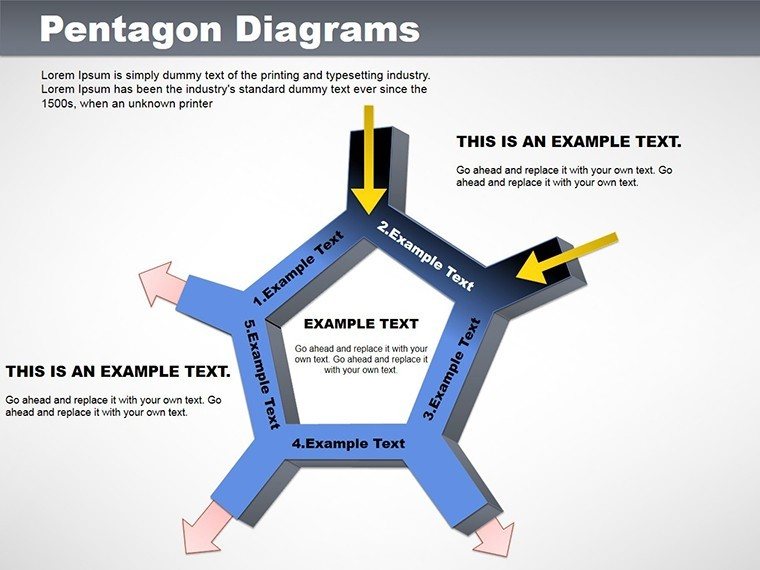
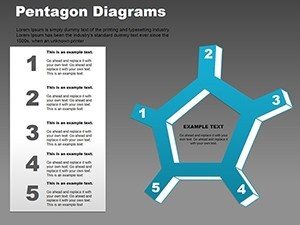
The core of this template lies in its adaptable pentagon structure, where each side can represent a distinct element - inputs on one half, outputs on the other, with central nodes for key interactions. Default themes use balanced color gradients for emphasis, but you can tweak them to highlight priorities, such as using bolder shades for critical paths in risk assessments. Text placeholders are strategically placed for labels, and the layout supports integration of icons or bullets, making it straightforward to populate with your specifics.
In-Depth Look at the Slides
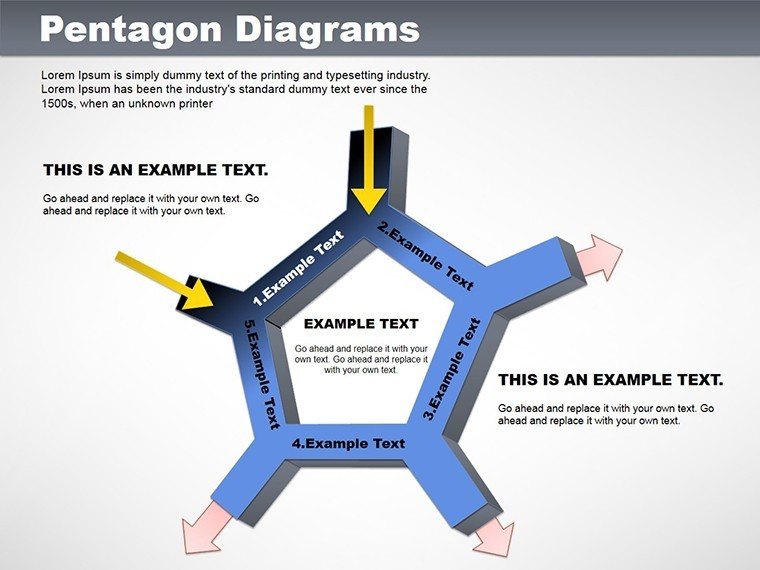
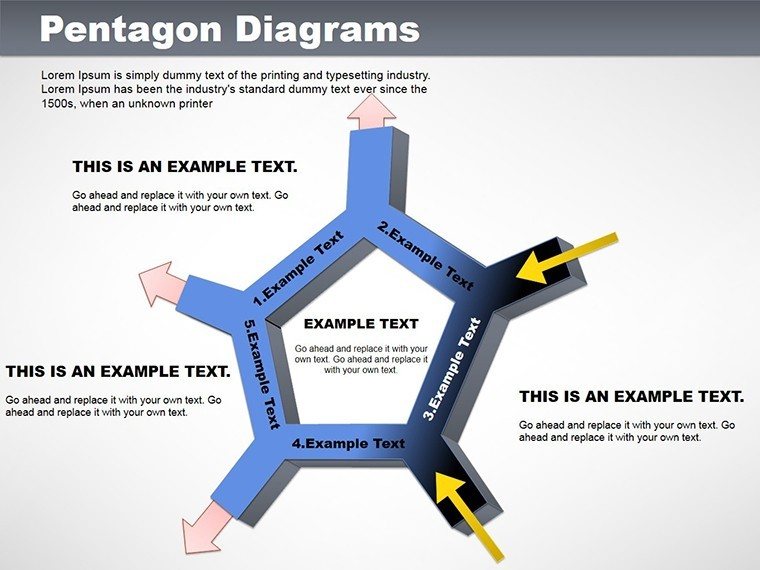
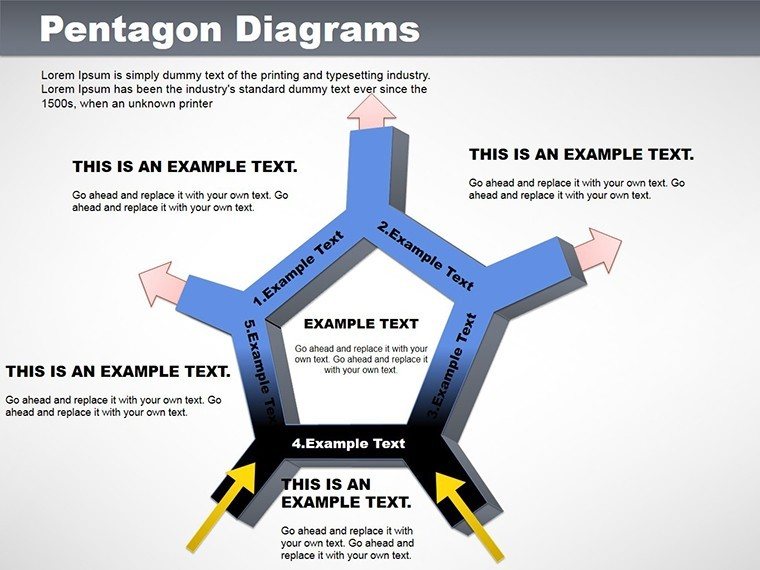
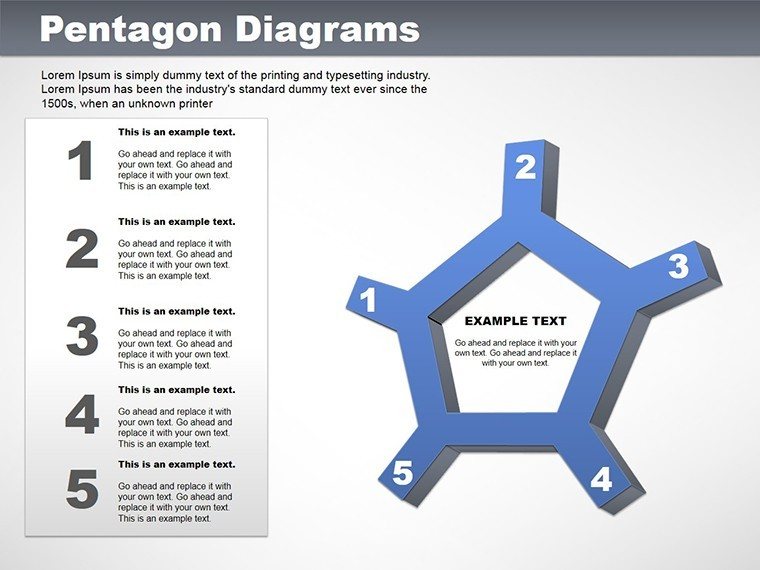
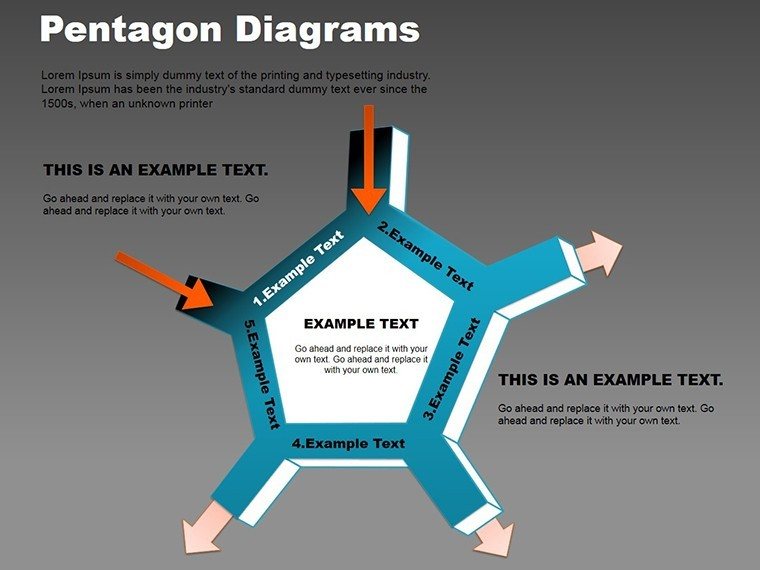
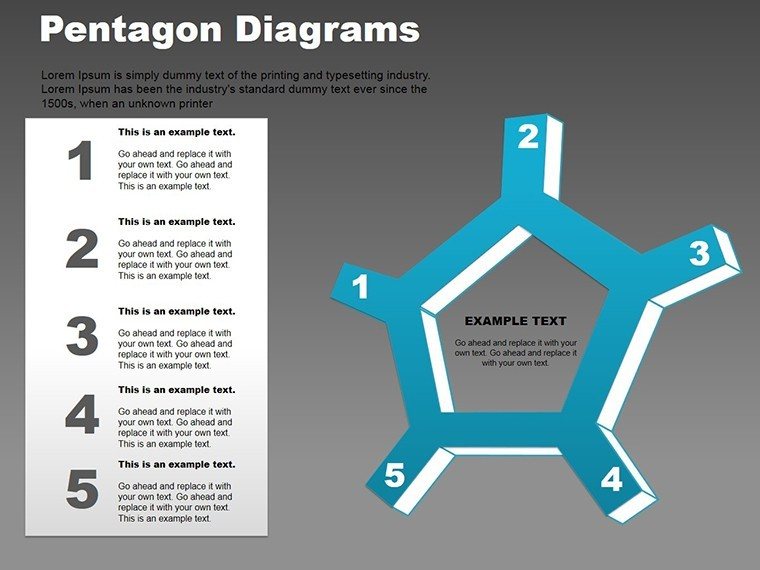
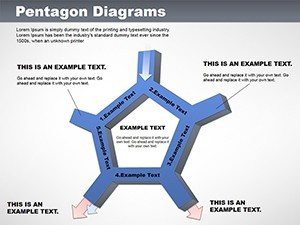
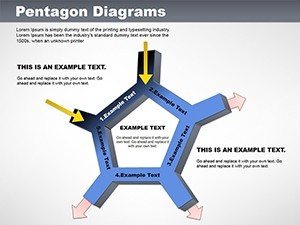
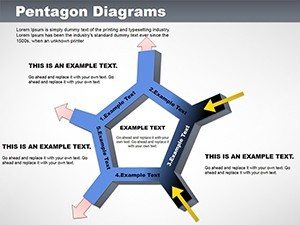
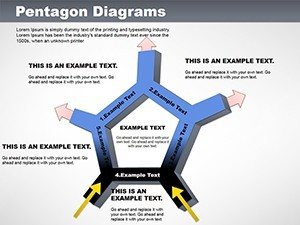
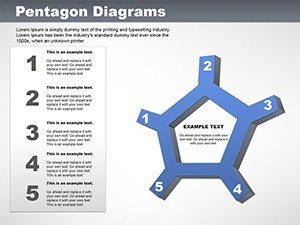
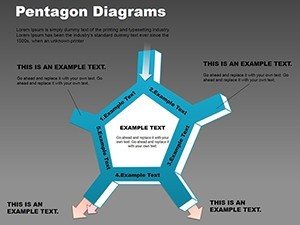
Slide 1 presents a basic pentagon with labeled vertices, great for foundational overviews like five-pillar strategies in corporate planning. Slide 2 adds directional arrows, transforming it into a cycle diagram for recurring processes, such as supply chain loops. Slide 3 incorporates table elements within the shape, allowing data entry for quantitative comparisons, like economic indicators across sectors. Slides 4 and 5 introduce layered pentagons for hierarchical views, useful in organizational charts showing departmental interconnections. Slide 6 features a segmented design with fillable sections, ideal for pie-like distributions without the circular constraint, perhaps allocating budget shares. Slides 7-9 offer variations with embedded text paths and connectors, enabling complex relationship mappings, like stakeholder influences in project ecosystems.
Built on scalable vectors, these diagrams maintain crispness even when enlarged for posters or digital displays, supporting diverse delivery formats.
Real-World Uses in Professional Settings
For economists, these pentagons can illustrate market dynamics, with sides representing supply, demand, pricing, competition, and regulation - clarifying how shifts in one affect the whole. In manufacturing, a production lead might use them to diagram input materials flowing into output products, identifying bottlenecks during team briefings. Trainers in workshops could adapt them for skill development models, where each facet covers a competency area, fostering interactive discussions.
Guide to Tailoring Your Diagrams
- Launch the template and pick a slide that aligns with your data structure.
- Edit vertex labels by double-clicking, inputting terms like 'Raw Materials' or 'Final Output'.
- Adjust colors through the shape format options, perhaps coordinating with your report's theme for cohesion.
- Incorporate arrows or lines via the insert tab to denote flows, enhancing directional clarity.
- Run a slideshow test to verify readability, refining as necessary for audience comprehension.
Such customization mirrors how experts in fields like systems thinking employ geometric models to unpack complexities, drawing from principles seen in balanced scorecards.
Enhancement Strategies for Your Diagrams
- Balance elements: Ensure even spacing around the pentagon to avoid visual bias toward any side.
- Layer information: Use tooltips or hyperlinks for deeper dives without overcrowding the main view.
- Align with narrative: Sequence slides to build your argument progressively, from simple to detailed.
- Vary for emphasis: Employ gradients or shadows sparingly to draw eyes to focal points.
Implementing these tips elevates your diagrams from mere illustrations to persuasive tools that facilitate understanding and decision-making.
Eager to clarify your processes? Grab this Pentagon PowerPoint Diagrams template and refine your visual communication.
Frequently Asked Questions
What makes the pentagon shape particularly useful?
It accommodates five interconnected elements seamlessly, ideal for balanced representations like multi-factor analyses.
Can I integrate data tables into these diagrams?
Yes, several slides include built-in table features for embedding numerical data directly within the shape.
Is compatibility extended to Mac versions of PowerPoint?
Absolutely, it functions smoothly on both Windows and Mac PowerPoint 2010 and later.
How do I handle complex interconnections?
Use connector lines and layered designs from the advanced slides to map intricate relationships.
Are the files royalty-free?
Yes, post-download, you have full rights to use and adapt for any professional purpose.