Schematic PowerPoint Diagrams: 18 Editable PPTX Slides


Type: PowerPoint Diagrams template
Category: Cycle, Relationship, Pie
Sources Available: .pptx
Product ID: PD00050
Template incl.: 18 editable slides
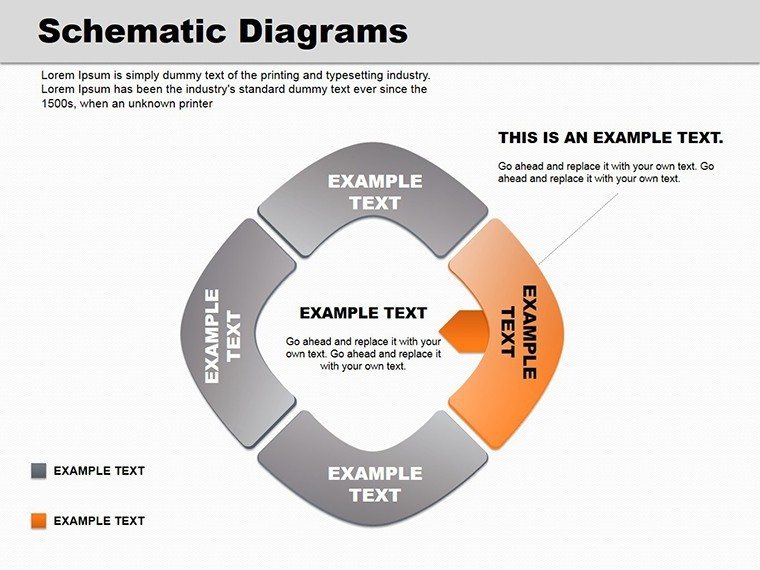
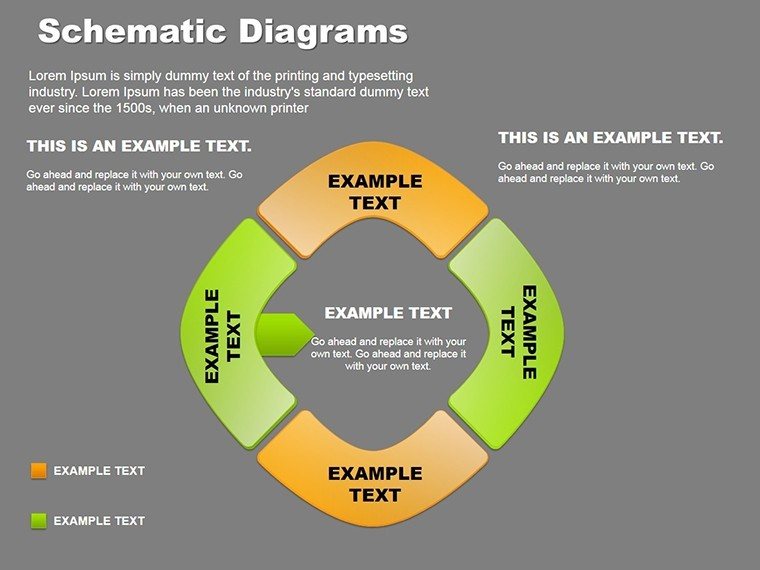
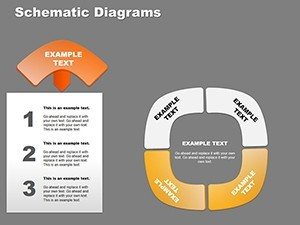
In the realm of presentations where every line counts, Schematic PowerPoint Diagrams emerge as your secret weapon for distilling complexity into compelling clarity. This 18-slide powerhouse, available as a downloadable PPTX template, crafts original schematics that blend artistry with accuracy, ensuring your ideas land with precision. Geared toward business pros crafting sales pitches, educators simplifying theories, or designers brainstorming breakthroughs, these diagrams make intricate concepts accessible and unforgettable.
Spanning cycle flows, relationship webs, and pie breakdowns, the pack offers a curated selection that fits diverse scenarios - from quarterly reports unpacking metrics to creative sessions sparking innovation. Each slide is a canvas of visual hierarchy, with seamless integration into your existing decks via .pptx format, compatible with PowerPoint 2016 and later. Edit freely: swap data, refine lines, or infuse your brand's hue, turning generic slides into tailored narratives that captivate.
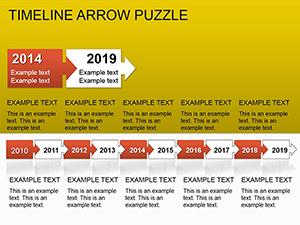
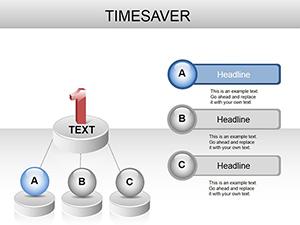
Envision a cycle diagram orbiting key milestones, arrows pulsing with progress - suddenly, your timeline isn't a list, but a story of momentum.
Key Features Powering Professional Polish
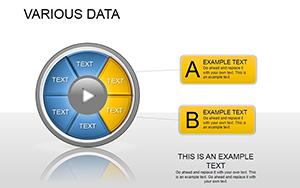
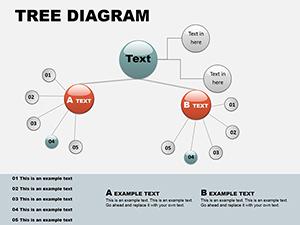
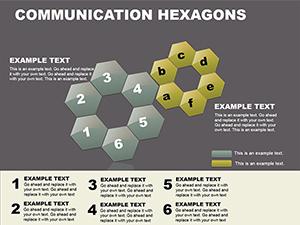
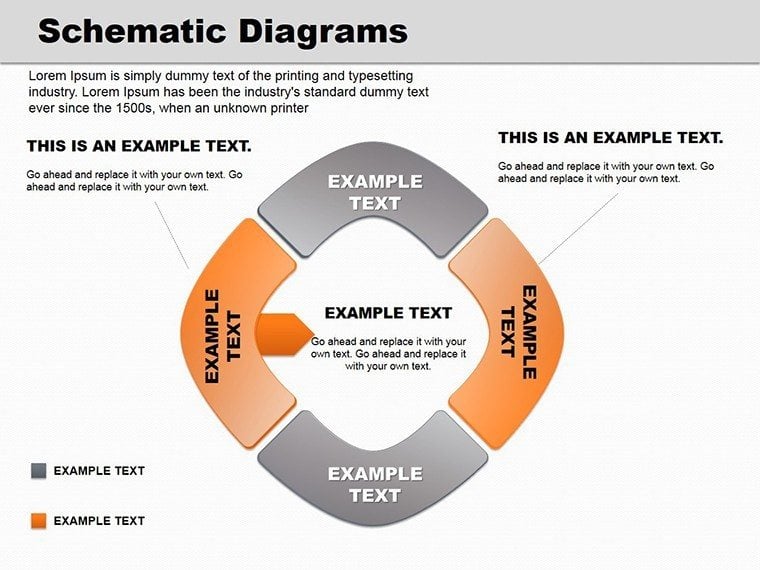
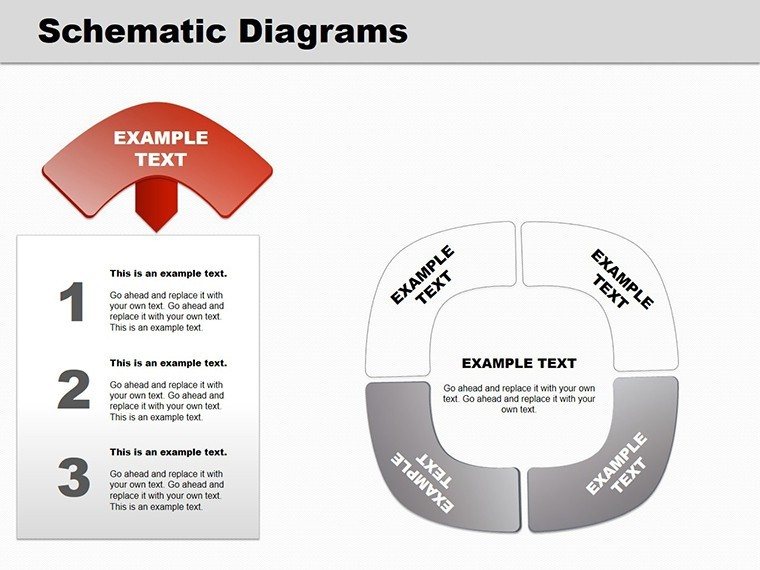
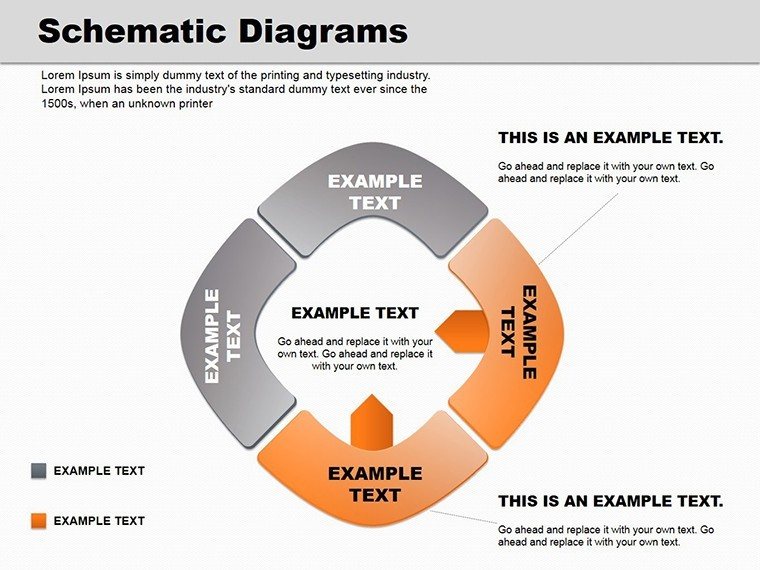
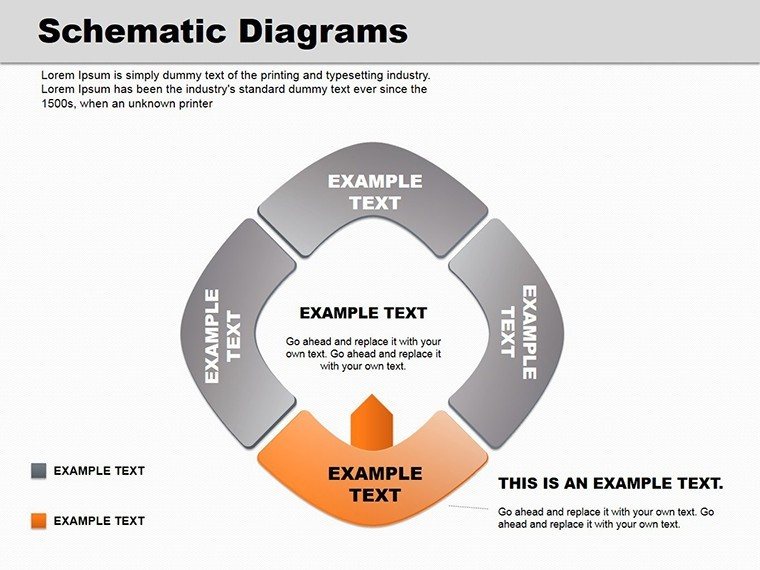
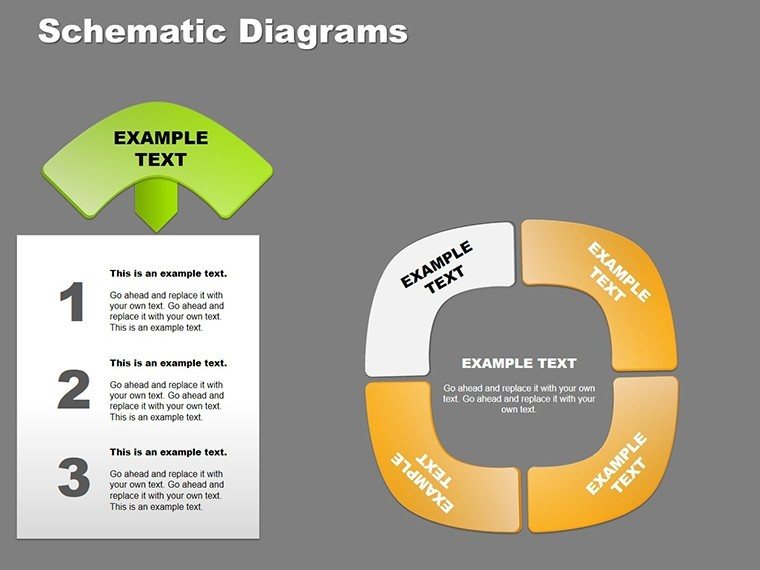
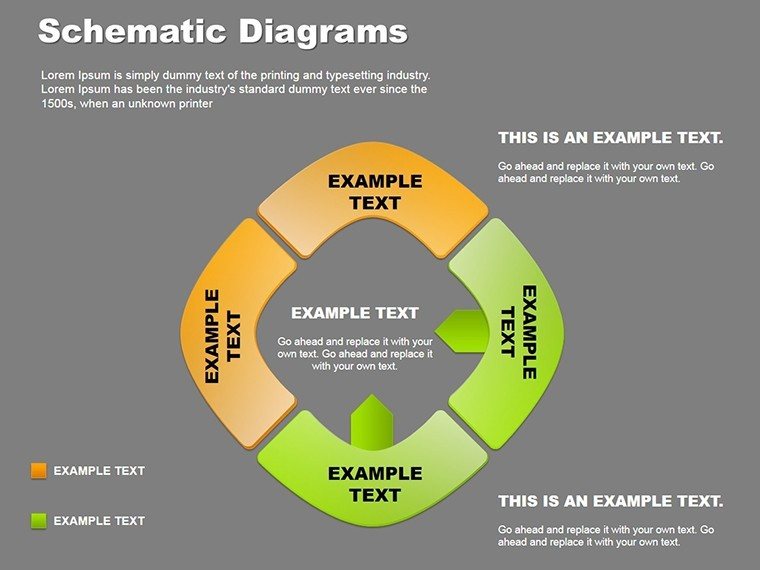
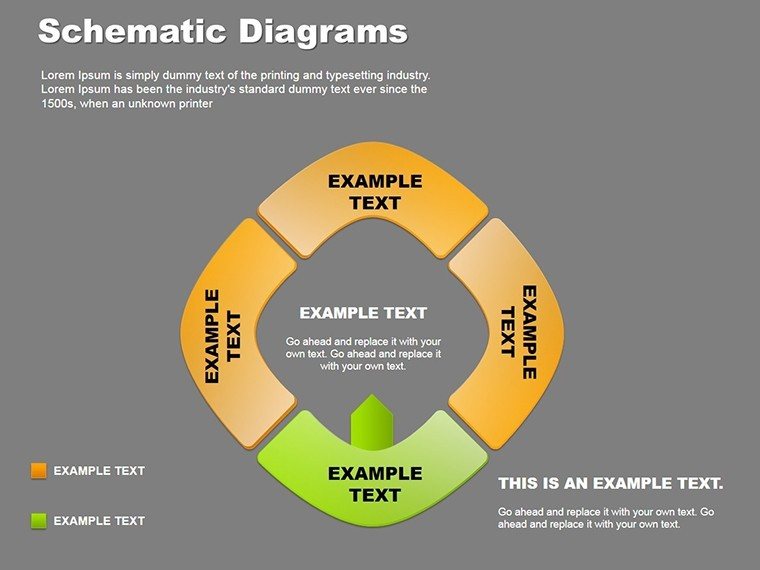
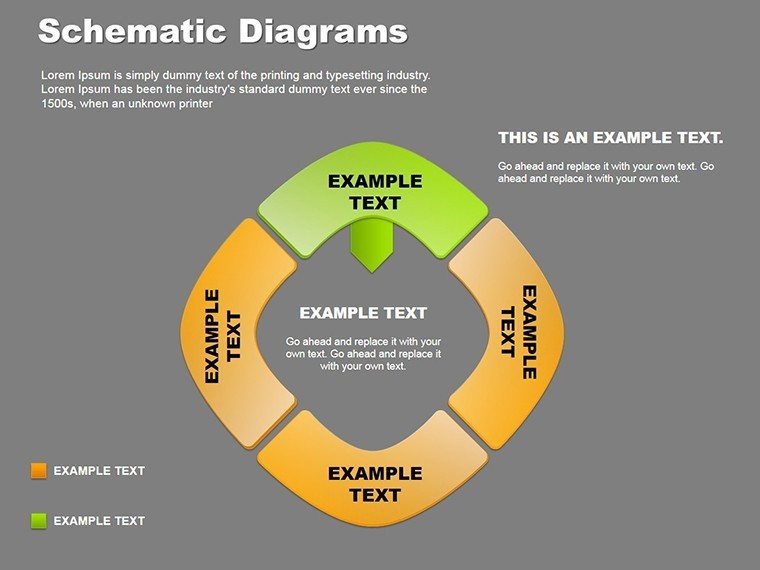
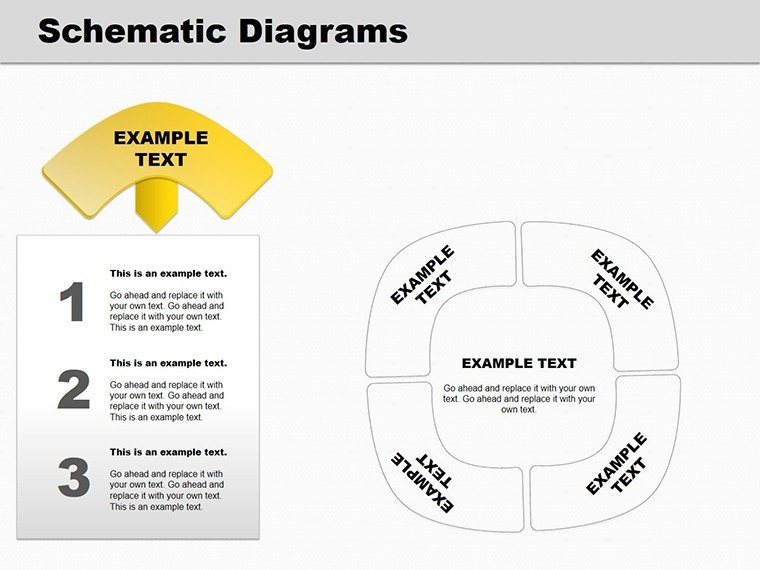
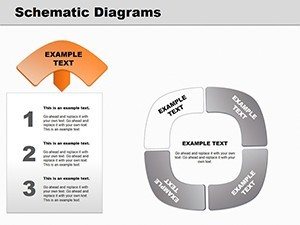
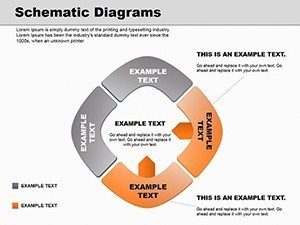
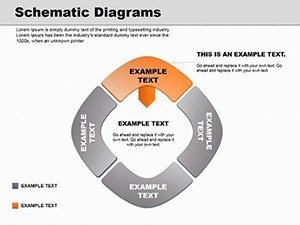
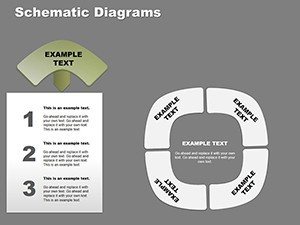
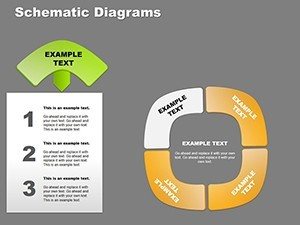
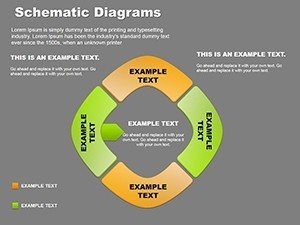
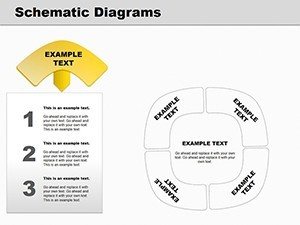
These schematics prioritize both form and function. The relationship diagram, for instance, uses interconnected nodes to map dependencies, while pie variants slice data into digestible wedges with exploded segments for emphasis.
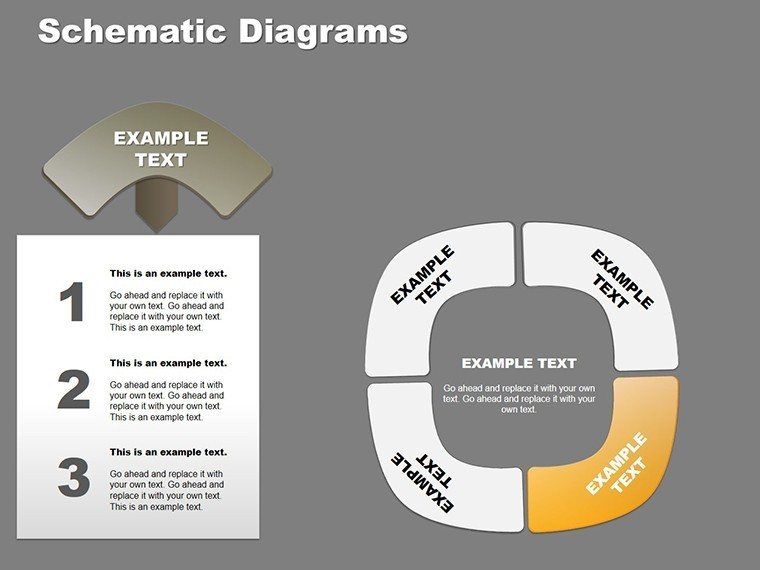
- Vector Precision: Scalable elements that stay sharp on high-res screens, ideal for large-format projections.
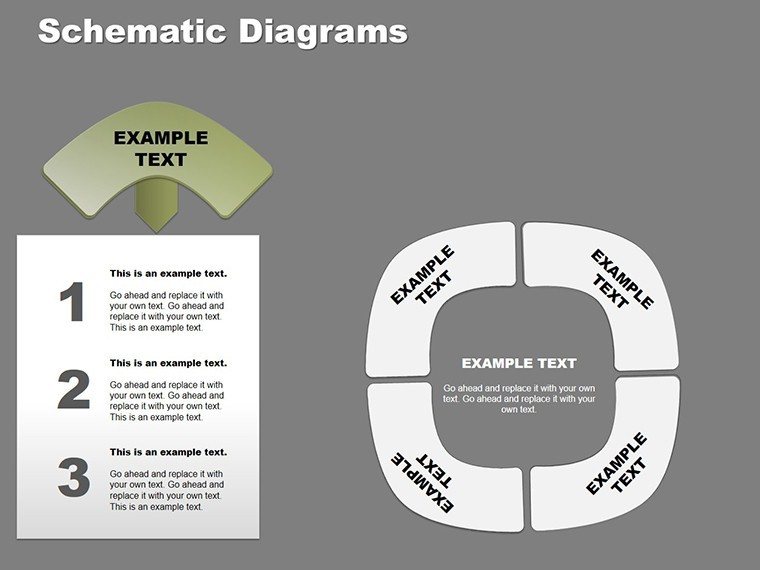
- Layered Layouts: Intelligently stacked components for easy access, preventing overlap mishaps during edits.
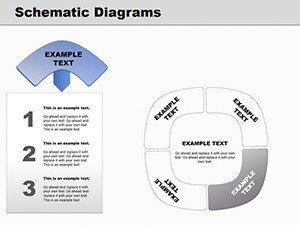
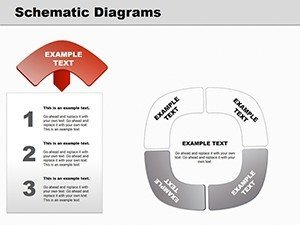
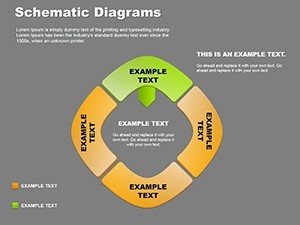
- Theme Harmony: Neutral bases that absorb your color schemes, ensuring cohesive deck flow.
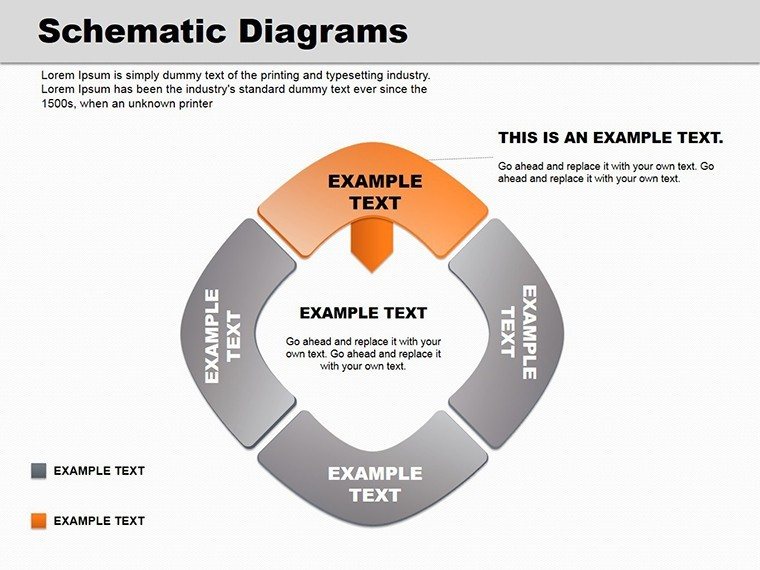
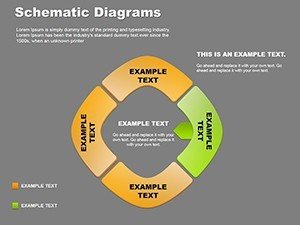
A highlight is the hybrid slide merging cycle and pie elements, perfect for visualizing phased market shares. Animate the wedges to fill sequentially, drawing eyes to growth arcs.
Step-by-Step Guide to Seamless Integration
Drop this into your workflow effortlessly. Open in PowerPoint, ungroup if needed, then:
- Select and Adapt: Click a schematic, use the format pane to tweak stroke weights or fills.
- Populate Content: Replace placeholders with your figures, leveraging alignment tools for symmetry.
- Enhance Dynamics: Add entrance effects to paths, timing them to reveal insights progressively.
- Export Test: Render to PDF or video, confirming fidelity across mediums.
This mirrors techniques from award-winning decks, like those in design-forward firms, yielding results that feel bespoke.
Targeted Use Cases for Everyday Impact
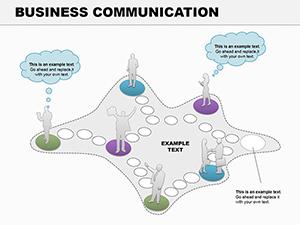
Business pitches thrive with these: a sales lead employs the relationship schematic to link client needs to solutions, forging emotional ties. Quarterly reports gain traction via pie diagrams charting variances, with color-coded slices spotlighting wins.
Educators favor cycle layouts for lesson progressions, looping back to reinforce learning loops. In creative huddles, schematics brainstorm idea clusters, branching into feasible prototypes.
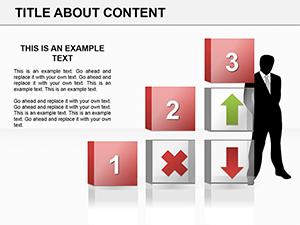
For strategy sessions, the full 18-slide arsenal covers everything from SWOT interlinks to funnel deconstructions, each fostering dialogue over dictation.
Customizing for Sector-Specific Needs
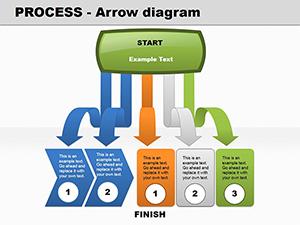
In tech, arrow-infused cycles map dev sprints; healthcare uses relationship webs for care pathways. Outshining stock shapes with built-in balance, they embed without reformatting hassles.
Delivering Tangible Benefits
These diagrams engage by design, simplifying absorption so audiences focus on your message, not deciphering charts. They elevate perceived expertise, turning routine updates into strategic showcases.
Teams collaborate better post-presentation, armed with clear visuals. Grab the Schematic PowerPoint Diagrams now for $20 and infuse your slides with schematic sophistication.
Frequently Asked Questions
What types of diagrams are included?
Cycle, relationship, and pie variants, totaling 18 editable options for varied needs.
Compatible with older PowerPoint versions?
Optimized for 2016+, but test in earlier for full feature support.
Can I mix these with other templates?
Yes, copy slides directly to maintain formatting integrity.
Are animations pre-set?
Basic builds are included, fully adjustable via PowerPoint's animation pane.
Suitable for non-business uses?
Definitely - great for academic or creative visualizations too.