Medicine Test Tube PowerPoint Diagrams: Visualize Data Dependencies


Type: PowerPoint Diagrams template
Category: Medicine - Pharma, Illustrations
Sources Available: .pptx
Product ID: PD00040
Template incl.: 15 editable slides
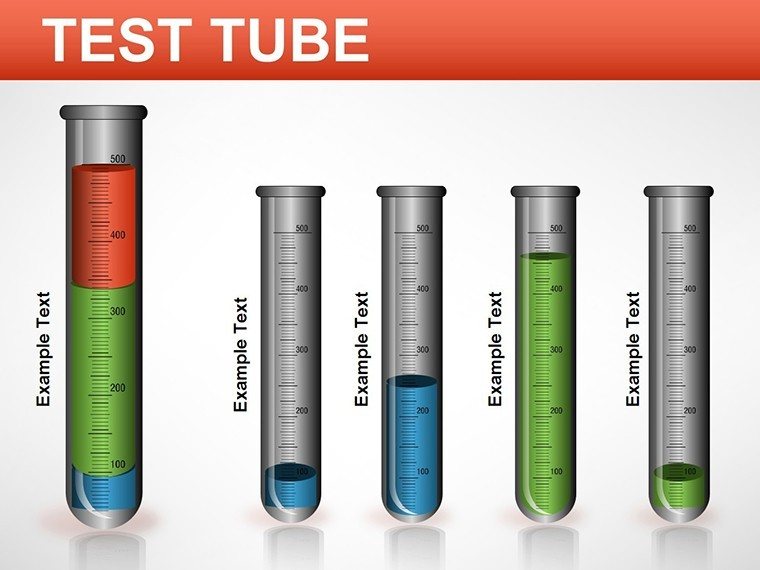
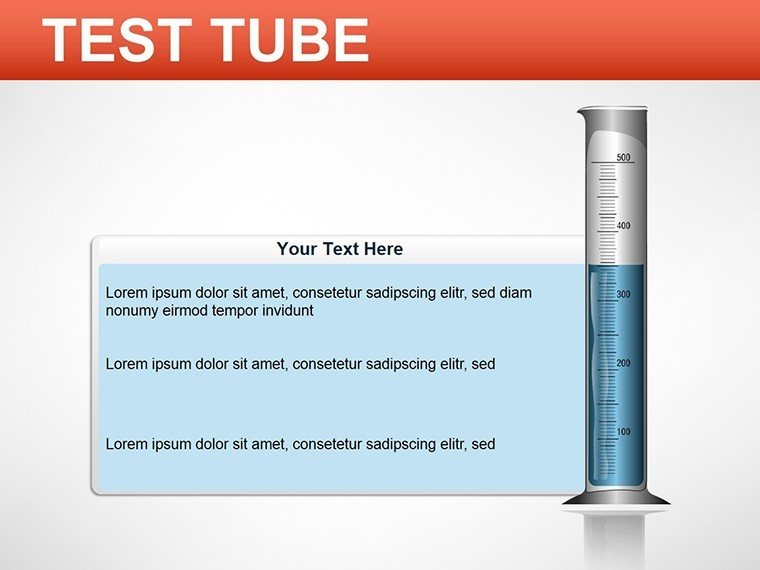
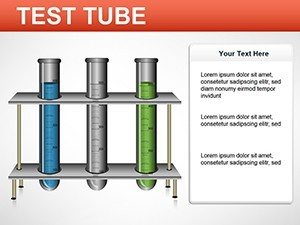
In the realm of medical and pharmaceutical presentations, clarity is crucial. Our Medicine Test Tube PowerPoint Diagrams template brings studies to life through thematic visuals, ideal for researchers and educators. With 15 editable slides, it uses test tube motifs to illustrate comparisons and relationships, making complex data teachable. Compatible with PowerPoint 2016+, it includes .pptx, .potx, vectors, and JPGs for versatility. Picture a pharmacologist demonstrating drug efficacy - the diagrams graph dependencies vividly. Or a lecturer explaining lab results, where shapes highlight correlations. The template's animated effects add dynamism, ensuring your audience grasps interconnections in conferences or classes.
Core Features for Scientific Precision
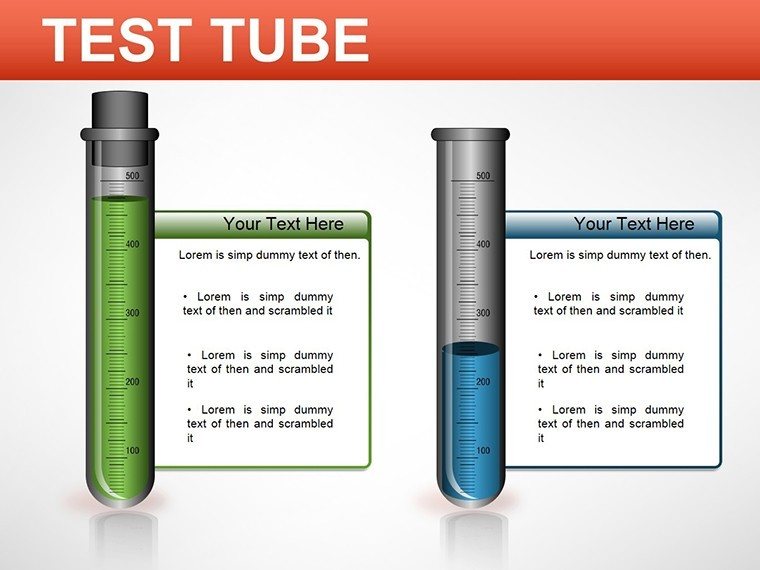
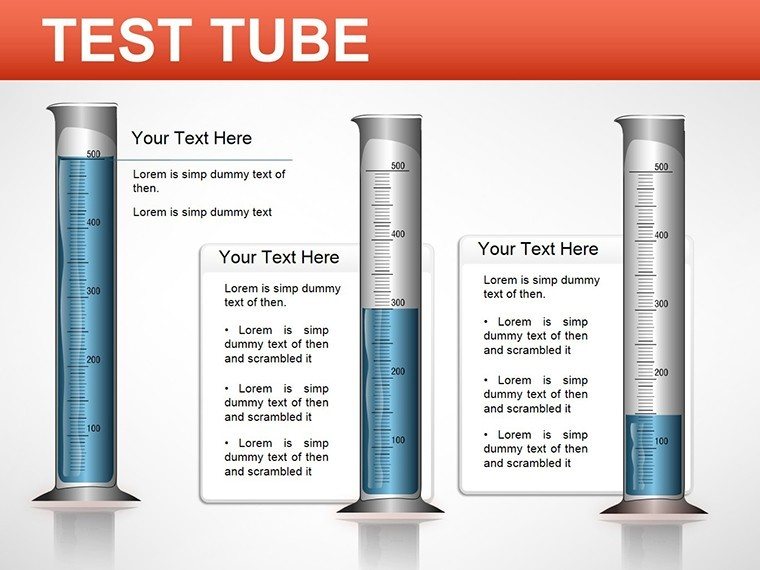
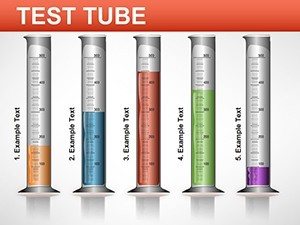
Editable shapes form test tube-based diagrams, with color variations for data differentiation. Custom animations reveal elements progressively, enhancing focus. Vector icons depict medical concepts, scalable without loss. Full editability allows resizing or recoloring to suit themes. This setup, informed by lab visualization needs, supports professionals in conveying precise insights.
Use Cases in Medical Fields
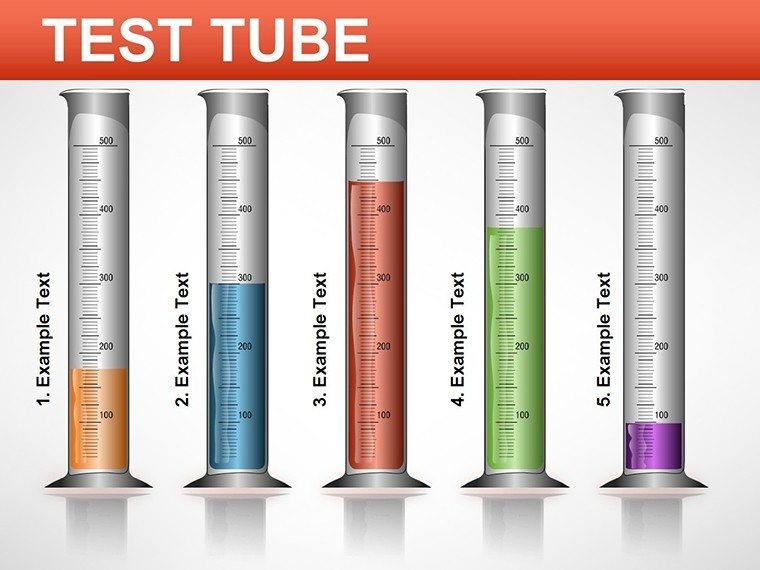
Researchers compare trial data, using tubes to represent variables. Educators teach biochemistry, graphing reactions. In pharma sales, it showcases product benefits versus competitors. A clinician might map patient responses, clarifying treatment paths. The template adapts to virtual seminars, maintaining impact remotely. It addresses dense data challenges, promoting memorable retention.
Step-by-Step for Diagram Creation
- Open in PowerPoint.
- Select a slide with desired tube layout.
- Input data into shapes.
- Apply animations for sequential display.
- Adjust colors for emphasis.
- Present to illustrate findings.
A researcher could follow this to prepare a conference slide that clearly shows study outcomes.
Advancing Presentations with Thematic Elements
Incorporate icons for reagents or outcomes, adding context. This aids in reports where visuals simplify jargon. Unlike static charts, animations guide attention, improving comprehension in technical talks.
Edges Over Built-in Features
PowerPoint defaults lack medical themes, but this provides specialized test tube designs. Free resources often skip animations, while this includes them for engagement.
Tips for Impactful Medical Visuals
- Label clearly: Use concise terms.
- Color code: Differentiate data sets.
- Animate wisely: Build suspense.
- Scale appropriately: Fit content.
- Validate: Check accuracy.
An educator using these might create slides that students reference long after class.
Bring your data to life - download this template for compelling medical narratives.
Frequently Asked Questions
What formats are included?
.pptx, .potx, vectors, JPGs.
Compatible versions?
PowerPoint 2016 and later.
Can I edit animations?
Yes, fully customizable.
Suitable for non-medical?
Adaptable, but themed for medicine.
Icon library size?
Included vectors for medical use.