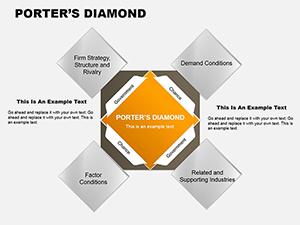
Porter's Diamond PowerPoint Diagram: Forge Competitive Edges Visually


In the arena of business strategy, where industries clash and opportunities glint like facets of a gem, clarity can mean the difference between leading the pack and fading into the background. Enter the Porter's Diamond PowerPoint Diagram template - a 15-slide powerhouse that crystallizes Michael Porter's framework into actionable visuals, empowering analysts, executives, and consultants to dissect competitive landscapes with finesse. This isn't mere theory on a slide; it's a strategic lens that reveals how factors like firm rivalry and demand conditions interplay to shape national advantages.
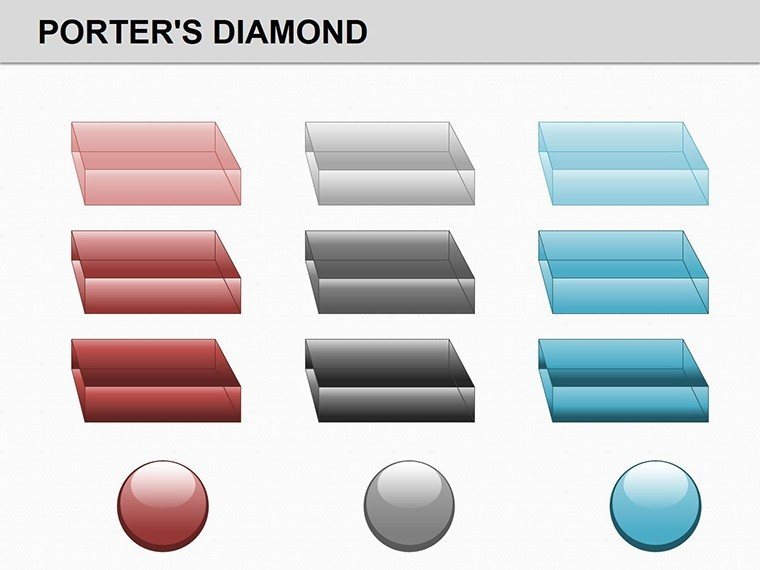
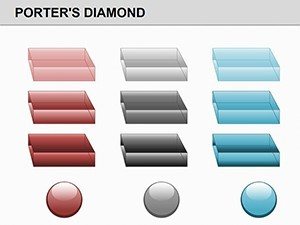
Designed for those knee-deep in market audits or growth roadmaps, it sidesteps the tedium of from-scratch builds. Fire it up in PowerPoint 2016 or subsequent versions, and discover diamond-shaped cores ringed by four pillars - each editable to slot in your data, from supplier metrics to innovation clusters. Tailor the sheen with metallic gradients or muted tones to suit boardroom gravity, ensuring your deck resonates as sharply as the model itself.
Strategy teams use it to benchmark sectors, overlaying local data on global benchmarks to pinpoint leverage points - like how tech hubs amplify related industries. Academics in MBA programs animate the diamonds to unpack case studies, tracing evolutions in automotive or wine trades. The template's strength? It makes the multifaceted model feel singularly focused, guiding viewers through interconnections without losing the thread.
Essential Features for Diamond-Sharp Analysis
Rooted in Porter's seminal work, this diagram PowerPoint template equips you with tools that honor the framework's depth while easing application.
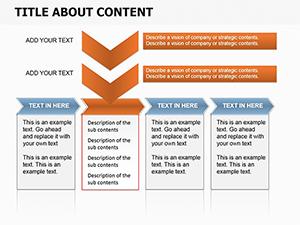
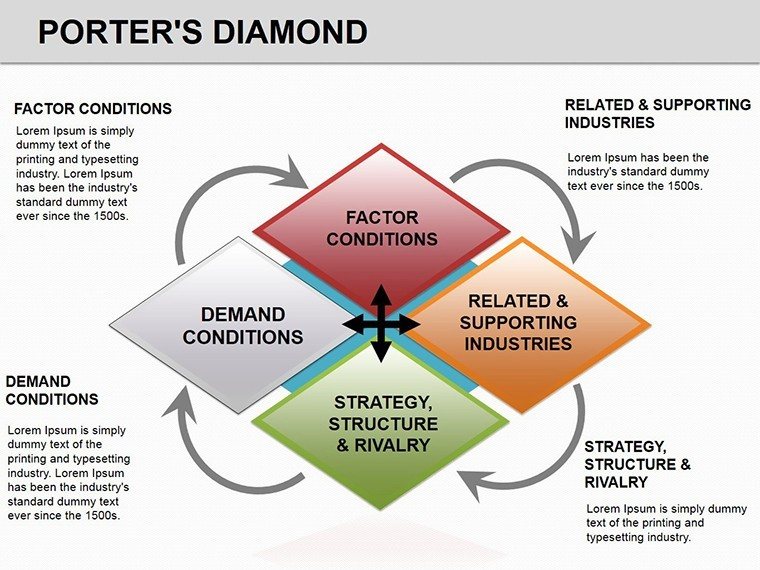
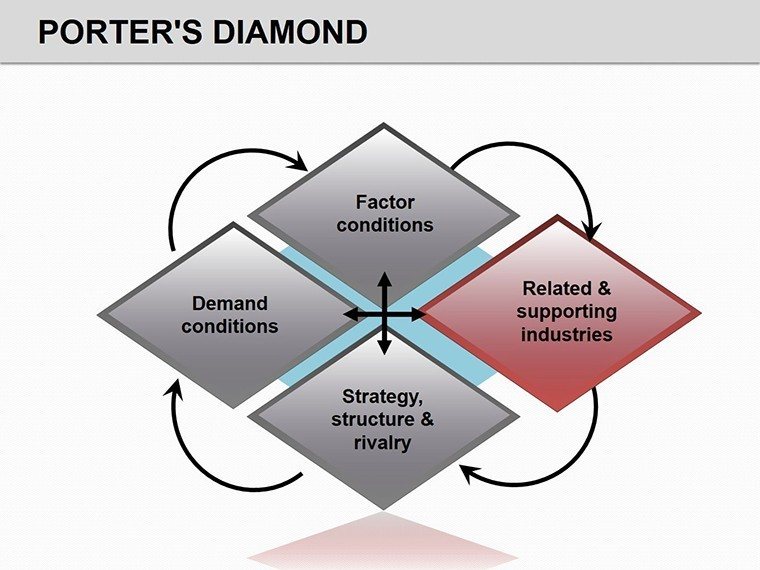
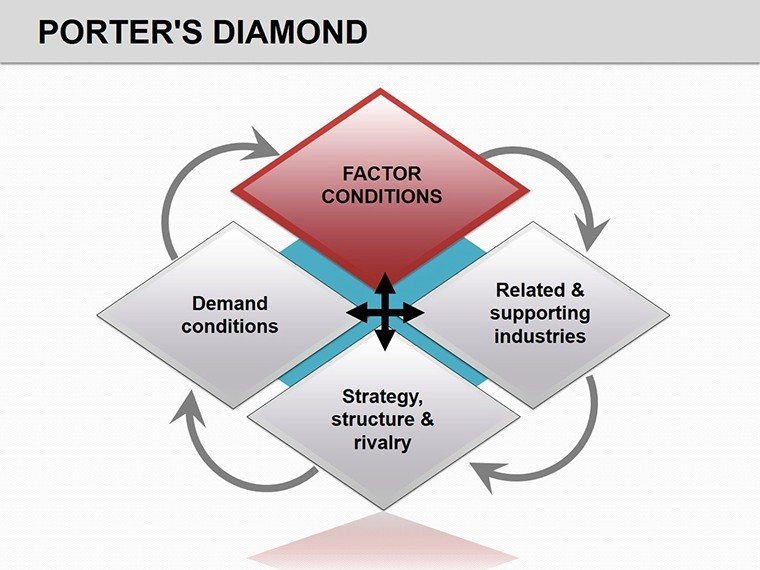
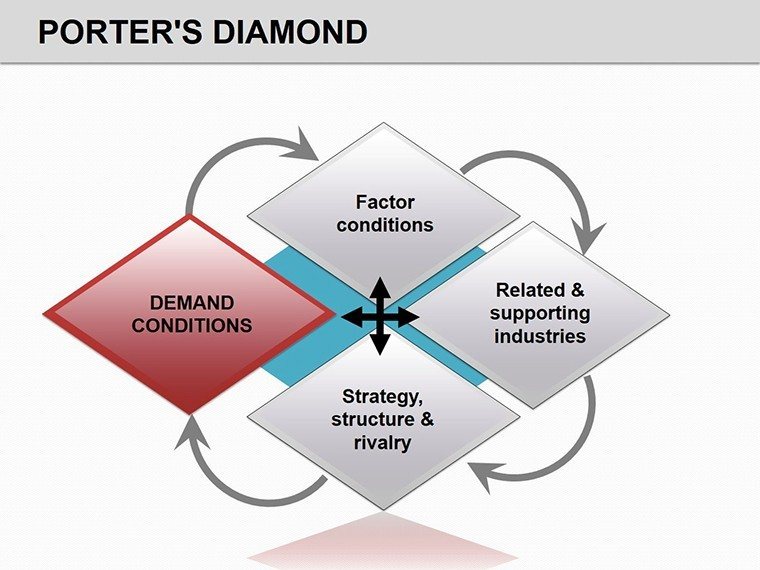
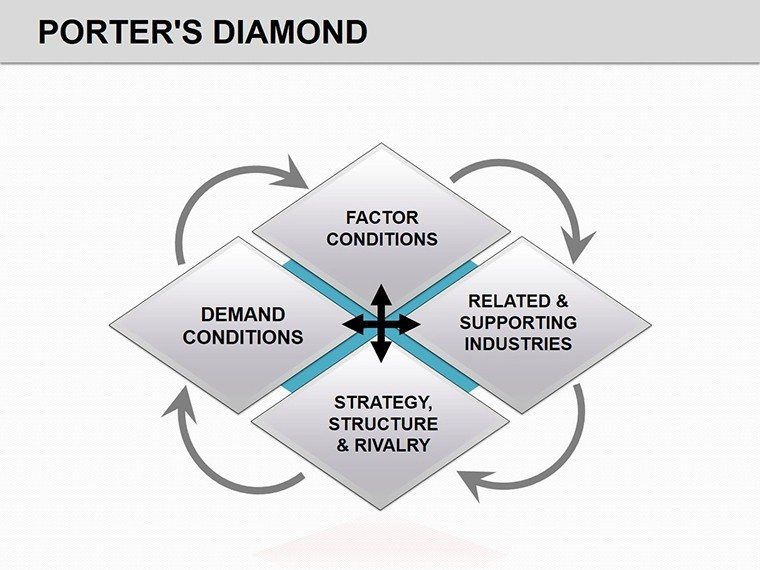
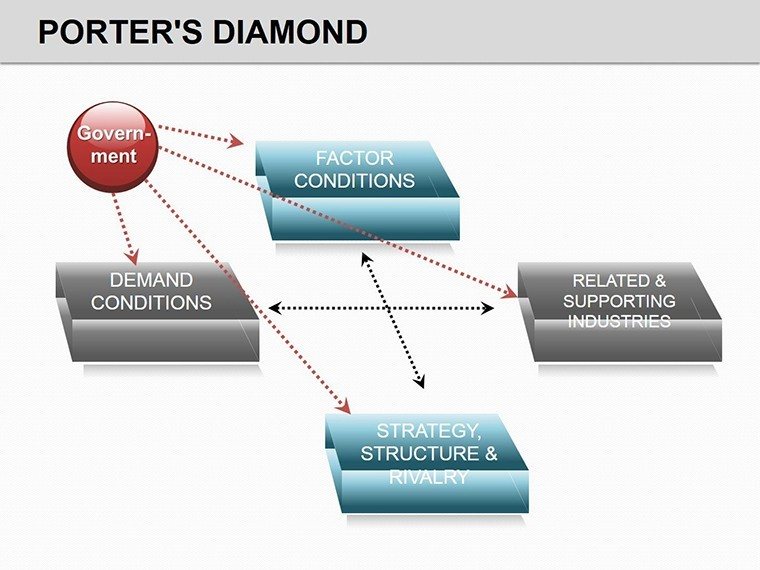
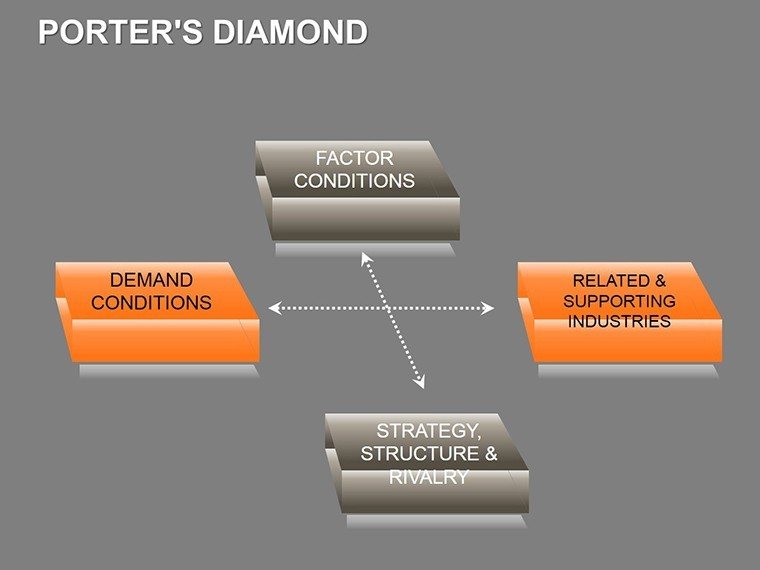
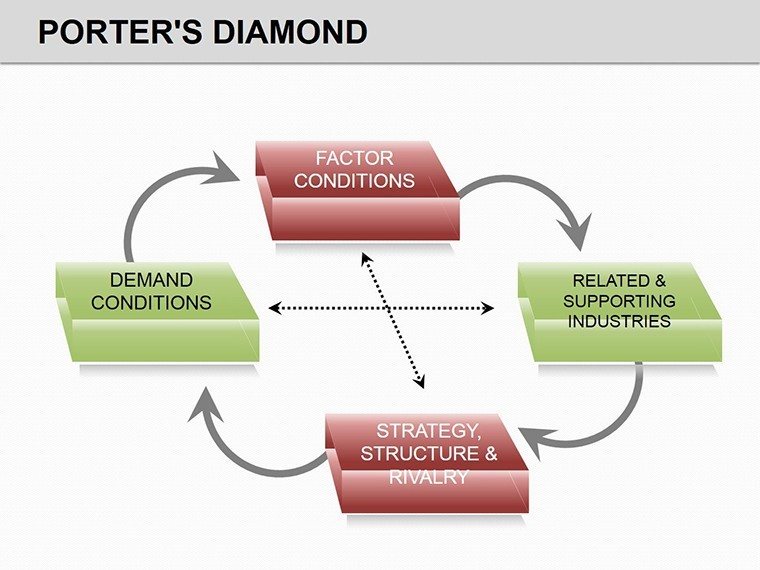
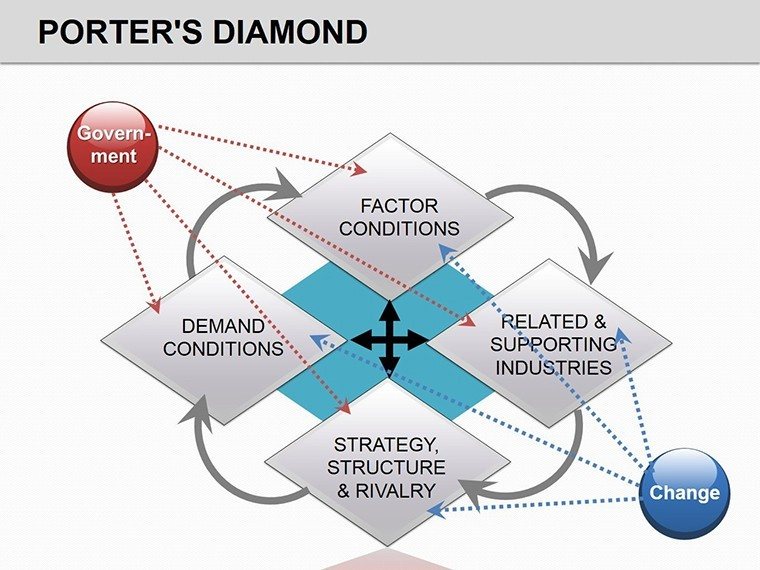
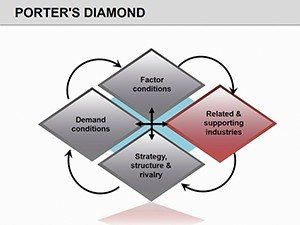
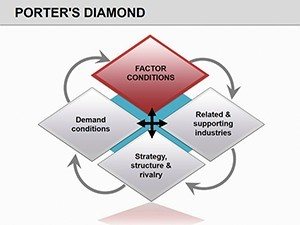
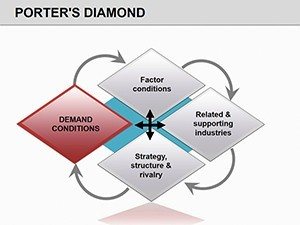
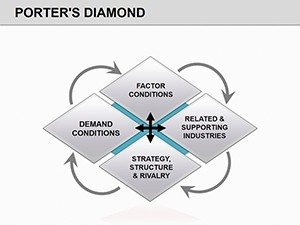
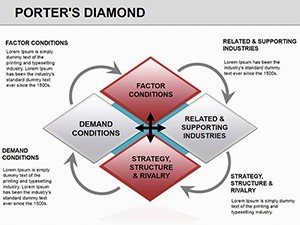
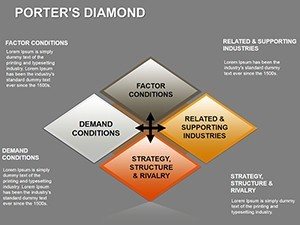
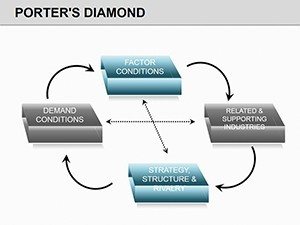
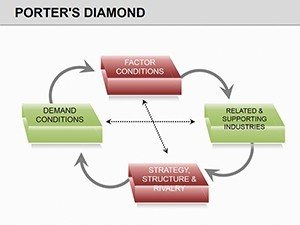
- Modular Pillars: Four cornerstones - factor conditions, demand, related sectors, and rivalry - pre-linked for balanced scaling.
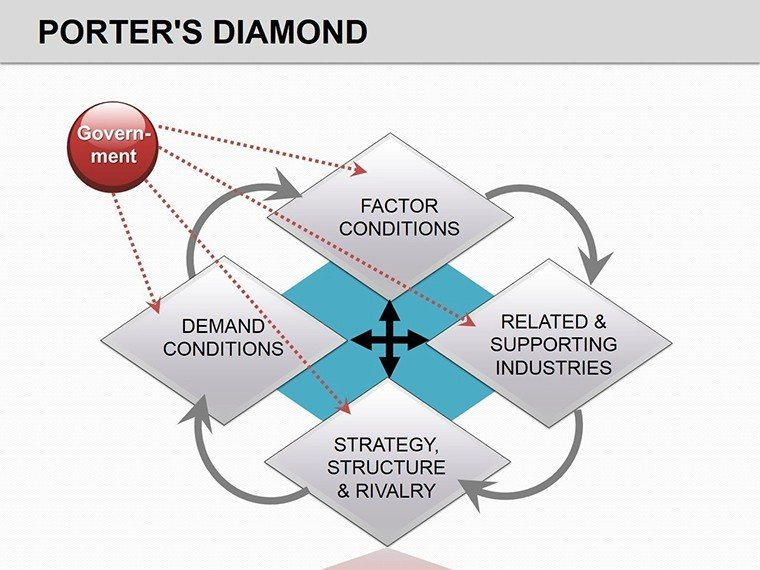
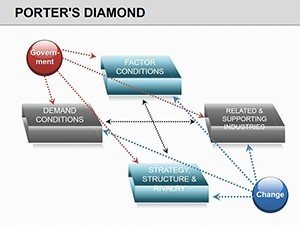
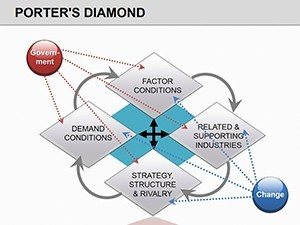
- Government and Chance Nodes: Outer influencers as adjustable satellites, circling the core for holistic views.
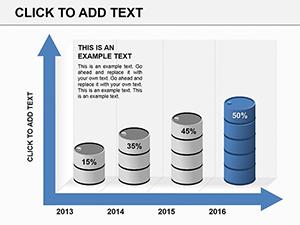
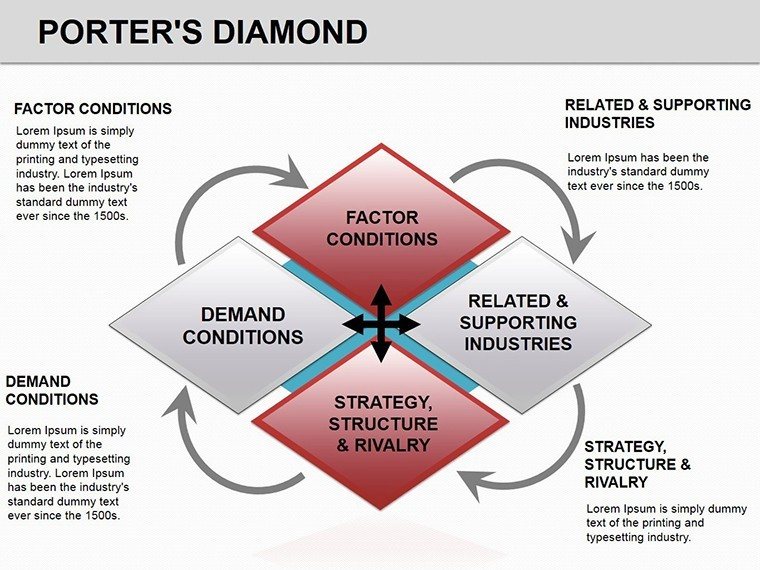
- Data Integration Slots: Embed charts or KPIs directly into facets, from bar graphs on rivalry intensity to icons for factor endowments.
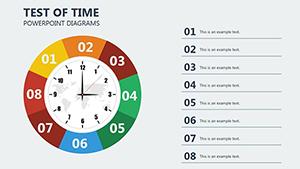
- Progressive Reveals: Layered animations that build the diamond outward, mirroring strategic layering.
These components forge slides that don't just illustrate - they interrogate, prompting deeper strategic dialogue.
Slide Exploration: Building Your Diamond
Slide 1 presents the blank canvas: A central diamond awaiting your industry label. Slides 2-5 flesh out pillars - start with factor conditions via radial lists, inputting skilled labor stats for auto-fill.
Core progression in Slides 6-10: Demand facets with sophistication gauges, editable via slider controls. Related sectors get network maps on Slide 8, connecting nodes to show spillovers. Rivalry heats up in Slide 11 with competitive matrices, shading intensities by entrant barriers.
Advanced layers emerge in Slides 12-14: Government policy overlays and chance event bursts, like tech disruptions. Seal with Slide 15's comparative diamond, juxtaposing nations for cross-border insights.
To refine, group elements via Ctrl+G, then recolor en masse - pro move: Use opacity on chance nodes to denote volatility, echoing real-market flux.
Strategic Scenarios: Diamonds in Action
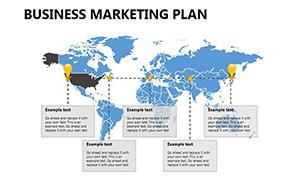
For corporate planners, this template illuminates expansion plays: Map a nation's diamond for electronics, highlighting demand-driven edges to justify investments. Consultants deploy it in audits, contrasting client industries against rivals to recommend cluster builds - visuals that turn reports into roadmaps.
In policy circles, overlay diamonds for trade negotiations, revealing how subsidies tilt factors. One strategist adapted it for a retail chain, dissecting local rivalries to optimize store placements - outcomes included targeted assortments that captured market share.
Its edge over ad-hoc drawings? The template enforces the model's symmetry, preventing skewed analyses that miss interplay.
Implementation Roadmap
- Frame Your Focus: Identify the industry; select a base slide matching scope.
- Load Insights: Populate pillars with sourced data - text for qual, embeds for quant.
- Harmonize Design: Align colors to your firm's palette, ensuring pillar parity.
- Animate Strategy: Sequence builds from core to edges, pacing for narrative beats.
- Iterate Externally: Share drafts for feedback, tweaking facets for precision.
This sequence distills complex strategy into deployable decks, accelerating decisions.
Outshining Generic Frameworks: The Template Advantage
PowerPoint's shapes approximate diamonds, but lack the interconnected smarts here - manual links break flows, and theming feels forced. This version streamlines with smart guides and presets, yielding outputs that professionalize your strategic storytelling.
Drawing from Porter's enduring influence, it arms you to not just present, but prescribe competitive paths.
Shape your success: Download the Porter's Diamond PowerPoint template for $25 and cut through strategic haze today.
Frequently Asked Questions
How does this align with Porter's original model?
Precisely - four pillars plus two influencers, with editable spaces for authentic adaptations.
Can I compare multiple countries?
Yes, duplicate diamonds on summary slides for side-by-side evaluations.
Suitable for startup pitches?
Ideal - highlight nascent factors to showcase growth potential to investors.
Integration with other charts?
Seamless; embed within pillars for hybrid views like SWOT-infused diamonds.
File size and performance tips?
Lightweight; optimize by ungrouping unused icons pre-export.
Updates for new Porter extensions?
Base is classic, but add custom nodes for evolutions like digital factors.