Innovation Process PowerPoint Diagrams Template


Type: PowerPoint Diagrams template
Category: Process, Relationship
Sources Available: .pptx
Product ID: PD00028
Template incl.: 14 editable slides
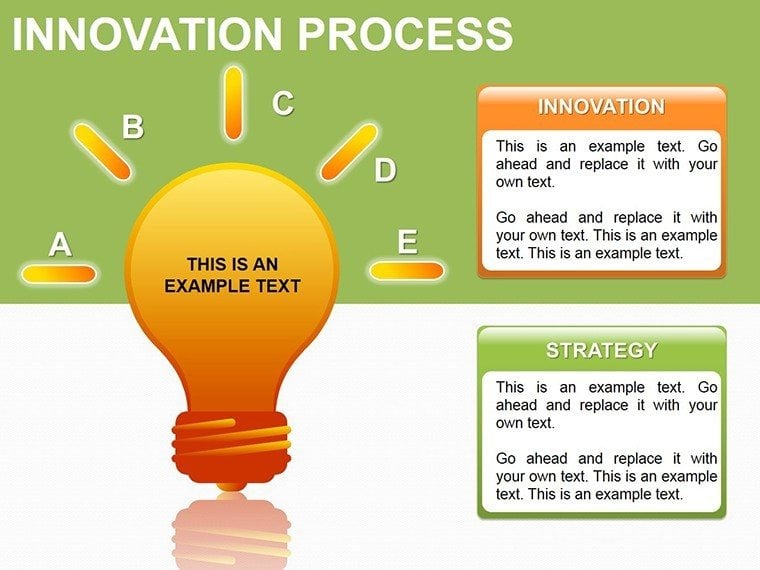
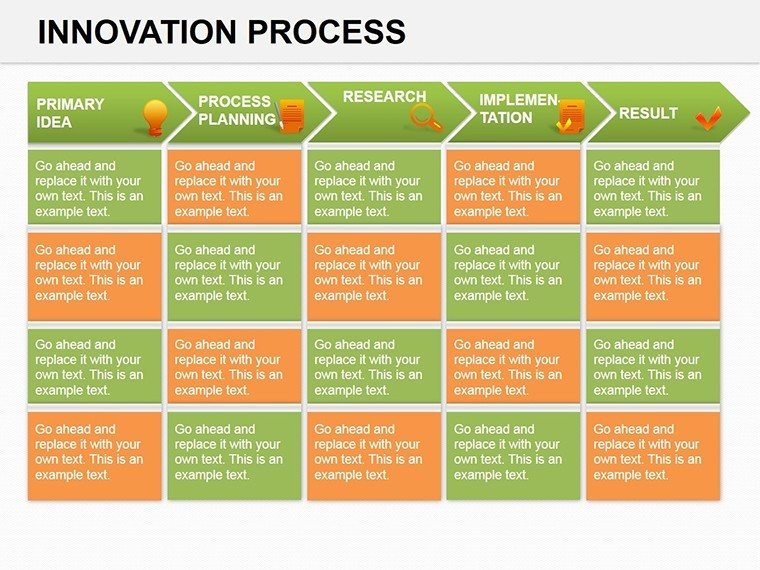
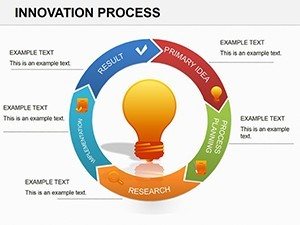
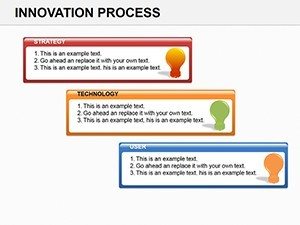
Ideas don't innovate themselves - they need a roadmap to flourish amid the chaos of creation. The Innovation Process PowerPoint Diagrams template provides exactly that: 14 editable slides that guide from spark to scale, tailored for entrepreneurs, R&D leads, and innovation coaches. These diagrams capture the essence of ideation, prototyping, and iteration, making abstract processes tangible and persuasive.
Suitable for venture pitches or internal brainstorms, the template's sleek lines and milestone markers help articulate value propositions with confidence. Fully compatible with PowerPoint 2016 and up, its modular design lets you remix stages effortlessly. At $28, it's the catalyst your next big reveal deserves. Fuel your creative engine - download today and orchestrate innovation that captivates.
Key Features Fueling Creative Flows
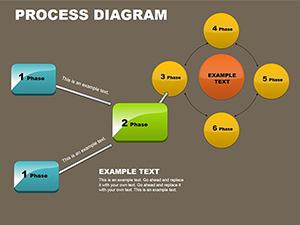
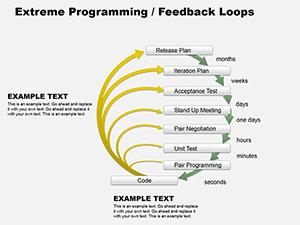
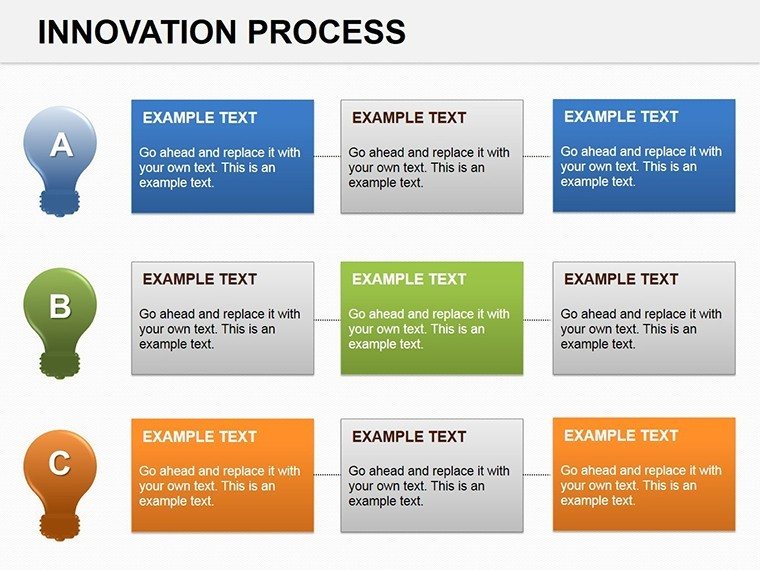
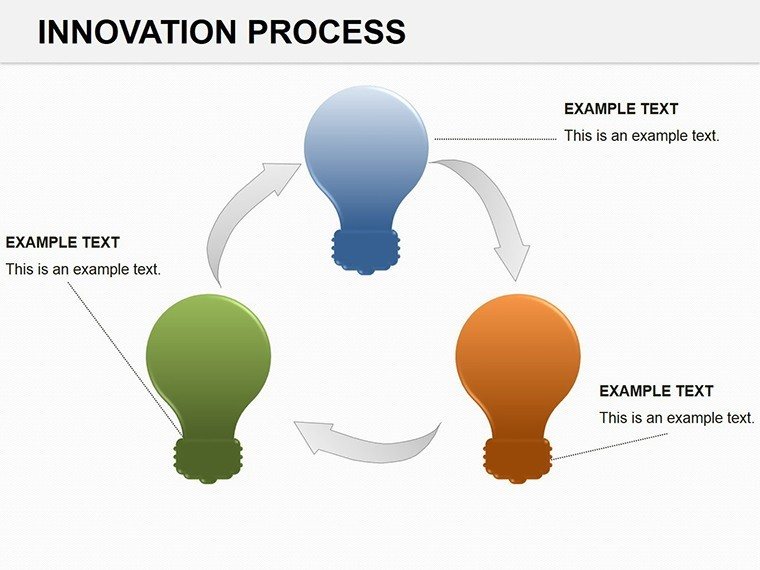
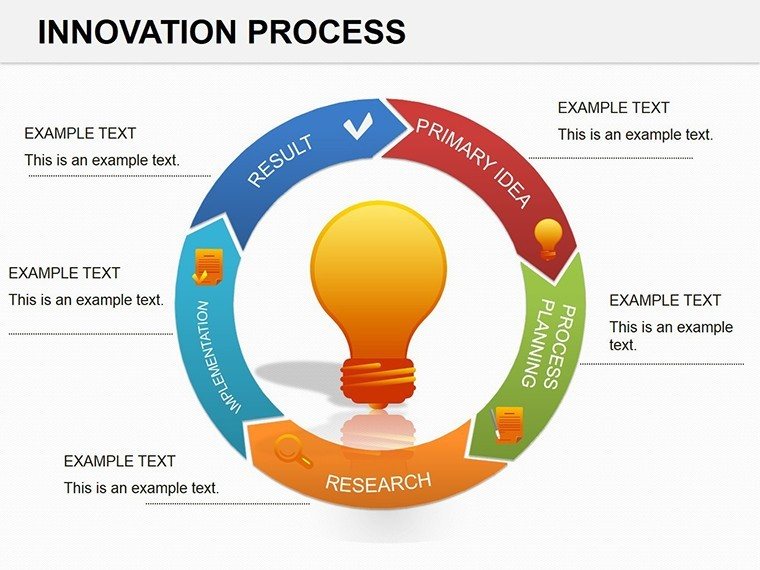
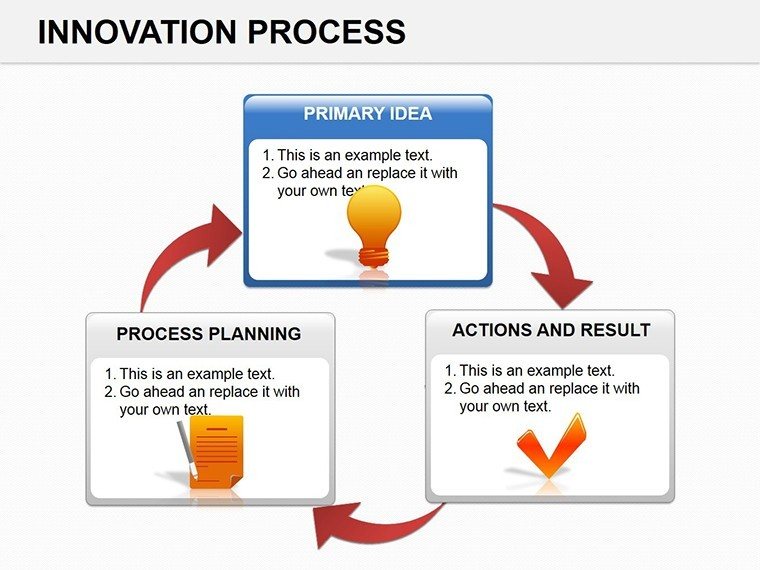
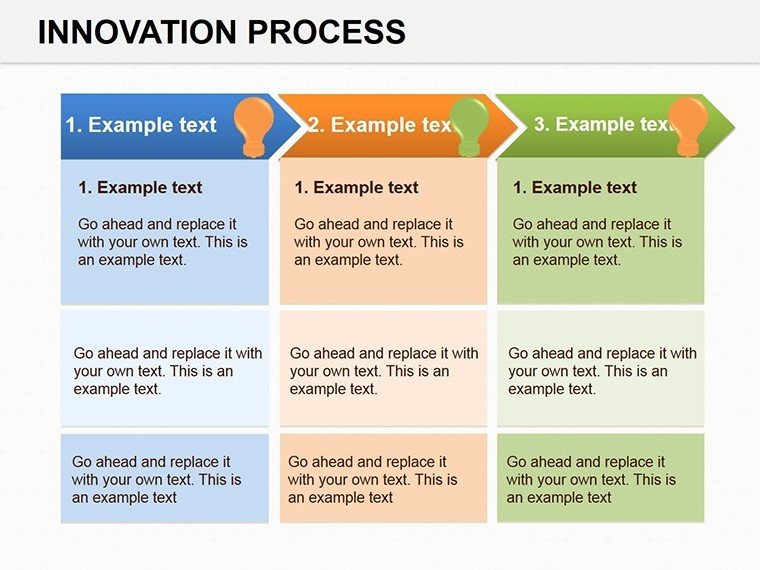
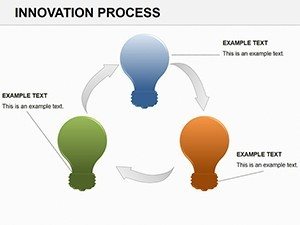
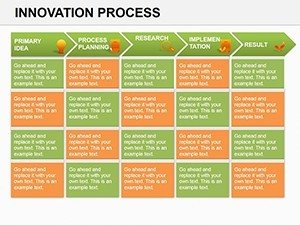
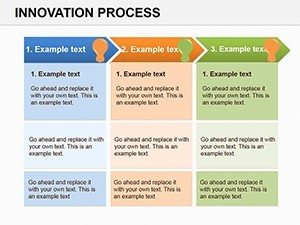
This PowerPoint diagrams template excels in its phased progression, with slides evolving from linear pipelines to cyclical loops, reflecting real innovation's non-linear dance. Core shapes are infinitely scalable vectors, paired with gradient timelines that evoke forward momentum - blues fading to golds for progression vibes.
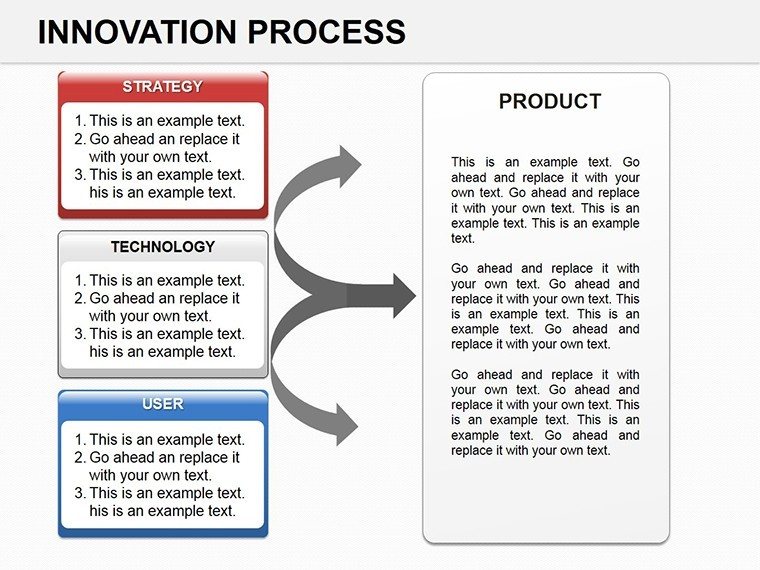
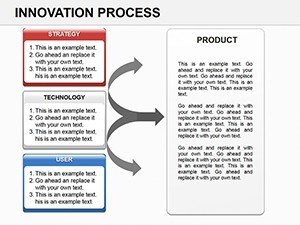
Unlike generic flowcharts, integrated decision diamonds prompt risk evaluations, while editable gates align with methodologies like Design Thinking. Venture capitalists nod at Slide 6's validation funnel, narrowing concepts to viable bets. The palette's versatility supports dark mode tweaks, ensuring versatility across devices.
- Phase Lockers: Snap elements to grids for precise stage alignments.
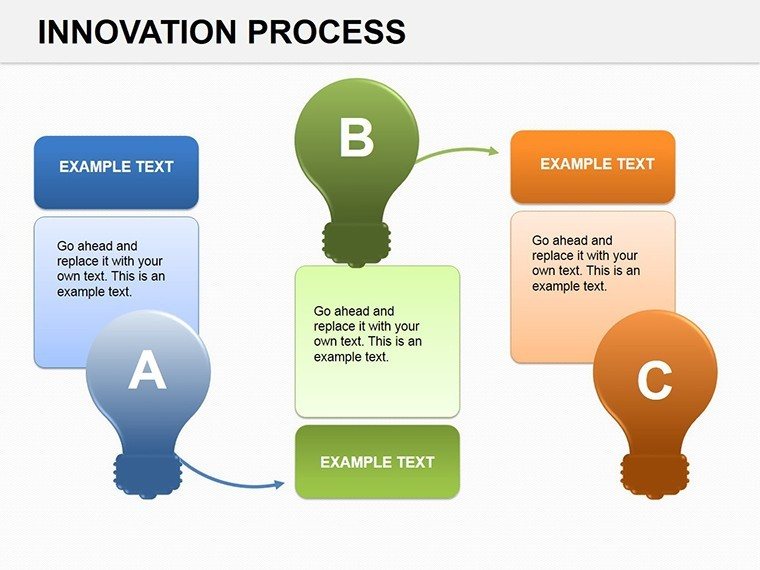
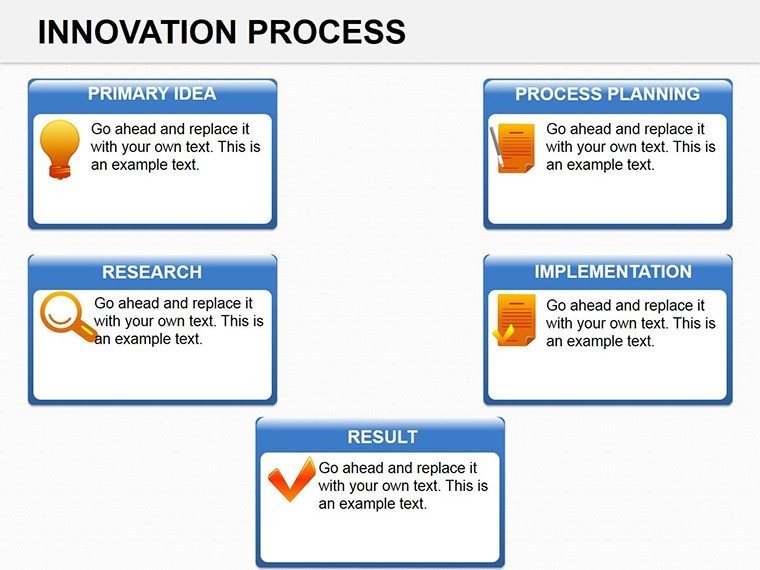
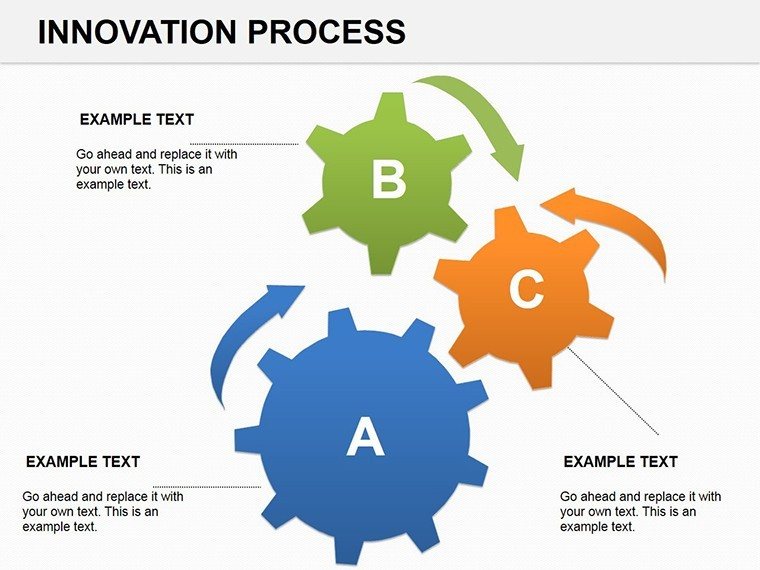
- Icon Fusion: 50+ innovation-themed graphics, from lightbulbs to gears.
- Hyperlinked Nodes: Jump to supporting data slides mid-flow.
These attributes transform static slides into dynamic narratives, where every arrow advances your vision.
Unpacking the 14 Slides Step by Step
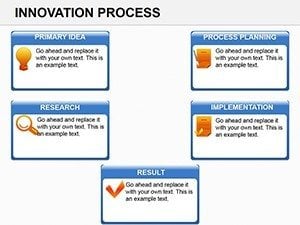
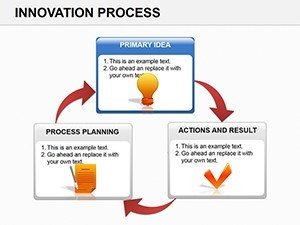
Slide 0 launches with a grand ideation helix, spiraling inputs into core themes - your hook for "where magic begins." Slide 2 refines to a gated pipeline, with barriers like feasibility checks, editable for custom hurdles.
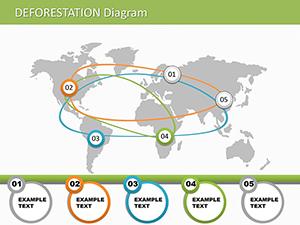
Slide 5 introduces prototyping branches, forking paths for variants, complete with metric placeholders for success gauges. Central Slide 8's ecosystem map webs collaborators, showing how partners amplify outputs - vital for co-innovation stories.
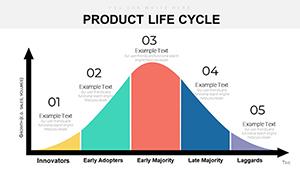
Climaxing in Slides 12-13, a maturity curve plots adoption waves, and a retrospective loop closes the circuit for learnings. Each bears inspirational quotes in footers, like faint echoes of Edison's persistence, to motivate mid-edit.
- Build Tip: Duplicate phase groups to compare iterations side-by-side.
- Sync Hack: Embed audio clips in nodes for voiceover prototypes.
Such layering crafts a cohesive arc, mirroring innovation's iterative heartbeat.
Use Cases That Ignite Real Change
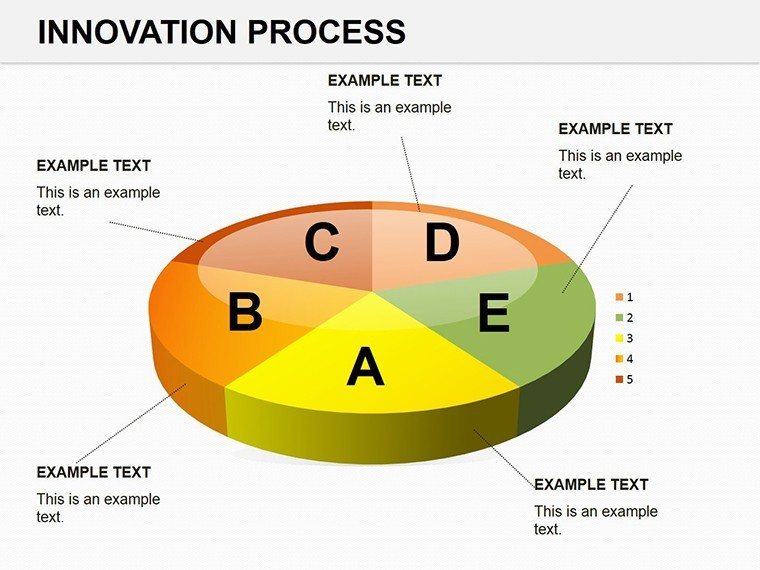
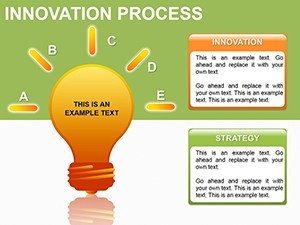
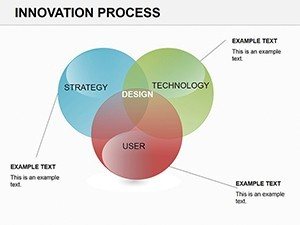
A startup founder pitches to angels using Slide 4's journey wheel, radiating features from a central problem - securing seed funding by visualizing traction potential. In corporate R&D, directors map tech roadmaps with Slide 10's horizon scanner, layering short-term wins over long-haul visions for buy-in.
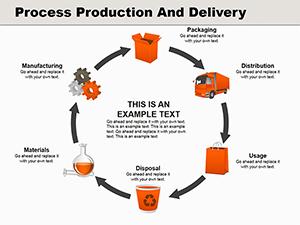
Design agencies thrive on Slide 7's empathy cycle, orbiting user needs to solution orbits, akin to IDEO's human-centered ethos. An edtech innovator leveraged the full set for grant apps, tracing curriculum evolution from beta tests to rollout - clinching support through vivid progression.
For workshops, project these as fillable canvases, crowdsourcing stages live. The unifying force: Harness diagrams to democratize creativity, ensuring every contributor sees their spark's path to flame.
Customization Strategies for Your Unique Spin
Open in PowerPoint, target a stage via selection lasso, and reshape curves with the yellow handles - softening for organic feels or sharpening for tech precision. Layer in brand motifs, like circuit patterns for SaaS flows.
Animate progressively: Fade gates in post-decision, unveiling paths like unfolding discoveries. For teams, use comments to flag refinements. Pitfall dodge: Balance text density with whitespace via Layout suggestions.
Prep for virtuals by optimizing for Zoom's share screen - test zooms on key nodes. These refinements make the template a canvas for your ingenuity.
Launch your next wave - claim it for $28 and pioneer with purpose.
Frequently Asked Questions
Compatible with which PowerPoint editions?
2016 onward; backward-compatible saves available for legacy users.
Can stages be reordered easily?
Yes - drag-and-drop modules maintain connections automatically.
Are there built-in metrics tools?
Placeholders for KPIs; link to charts for dynamic updates.
How to add custom icons?
Insert via Insert > Icons, then align to existing styles.
Suitable for non-startup contexts?
Versatile for education, healthcare - adapt phases accordingly.