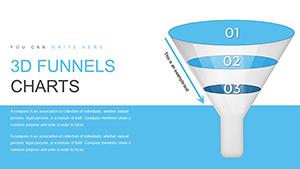
Economic Analysis PowerPoint Charts: Illuminate Trends and Forecasts


Economic landscapes shift rapidly, demanding visuals that clarify chaos. Our Economic Analysis PowerPoint charts template delivers with 21 editable slides, blending timelines, tables, and graphs to present data sophistically. For economists, analysts, educators, and consultants, it solves the puzzle of conveying forecasts and comparisons effectively. Envision charting GDP growth over decades or comparing inflation rates, all with expert precision inspired by sources like the World Bank's visualization tools. This empowers you to deliver presentations that inform policy, strategy, and learning with authority.
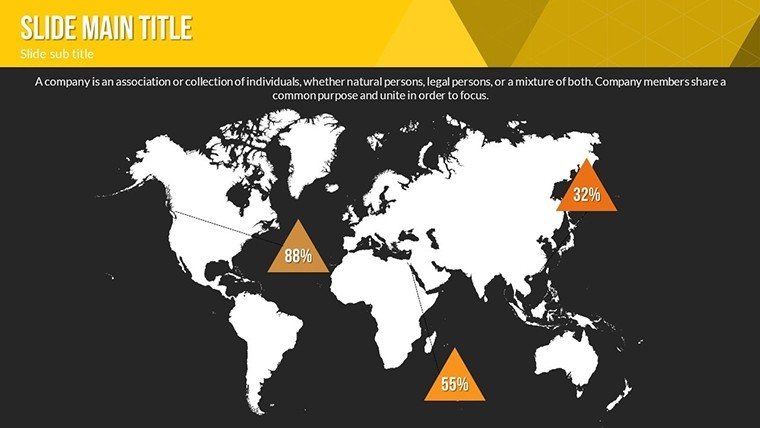
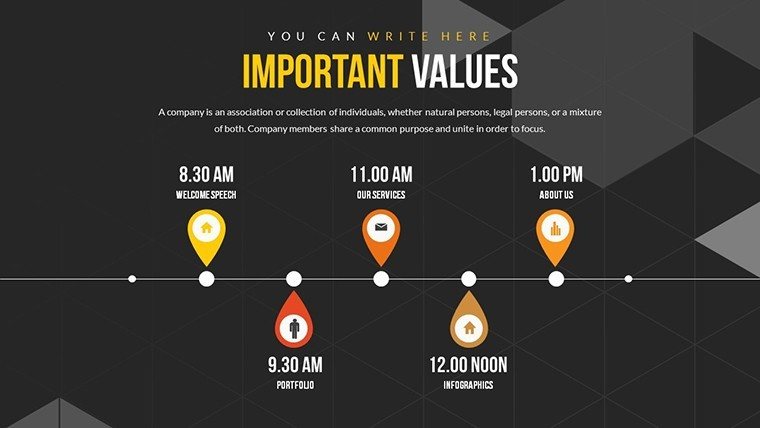
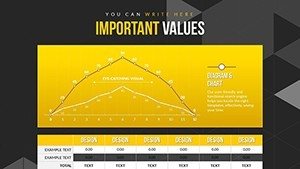
Harnessing Timelines and Tables for Economic Depth
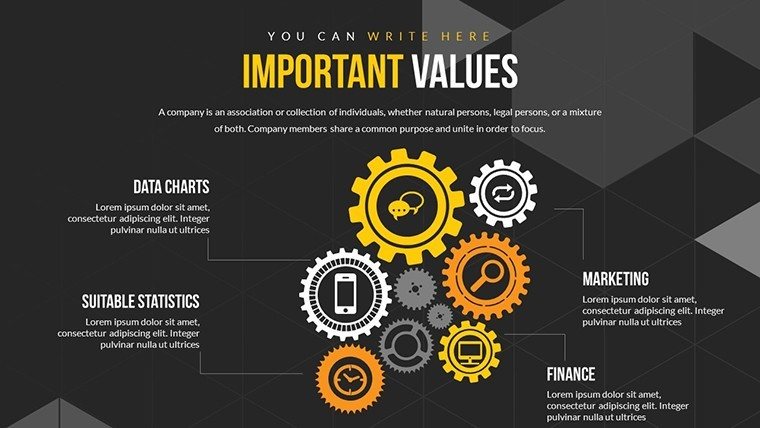
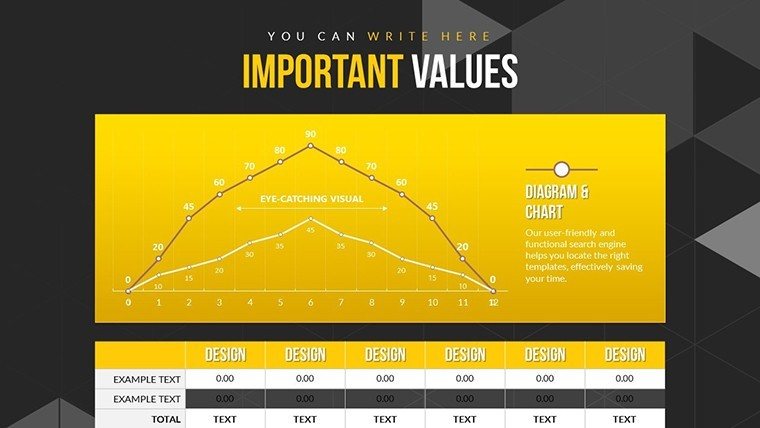
Unlike rudimentary charts, this template integrates timelines for historical context and tables for granular data. Superior in detail, it allows layering of variables, like overlaying unemployment on growth curves. An economist might use it for recession analyses, pinpointing recovery phases. Designs scale for diverse audiences, from seminars to reports.
Pivotal Features for Analytical Rigor
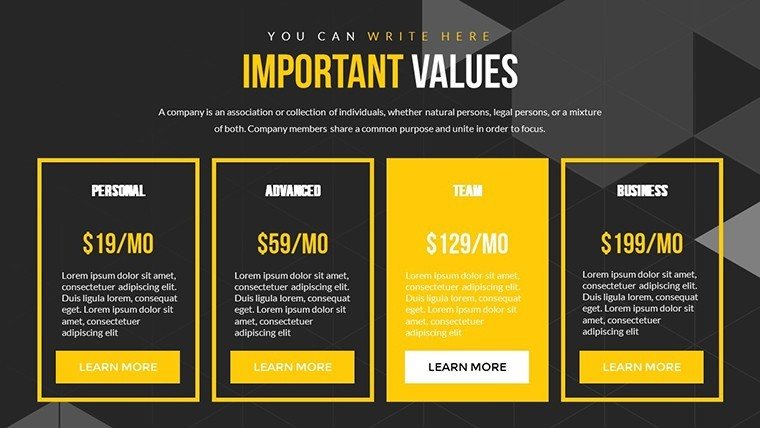
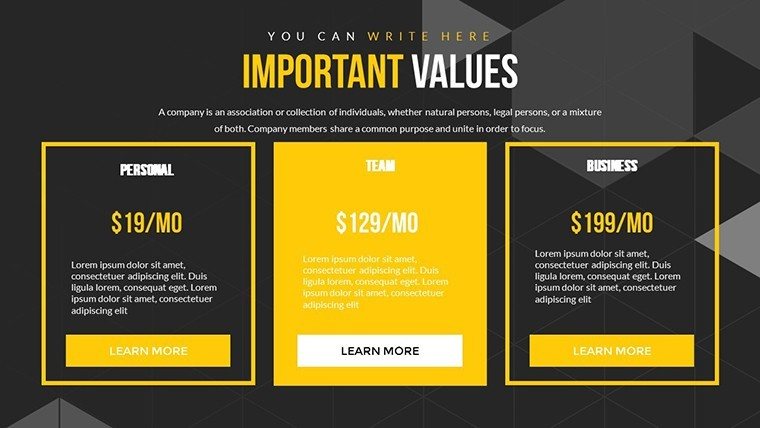
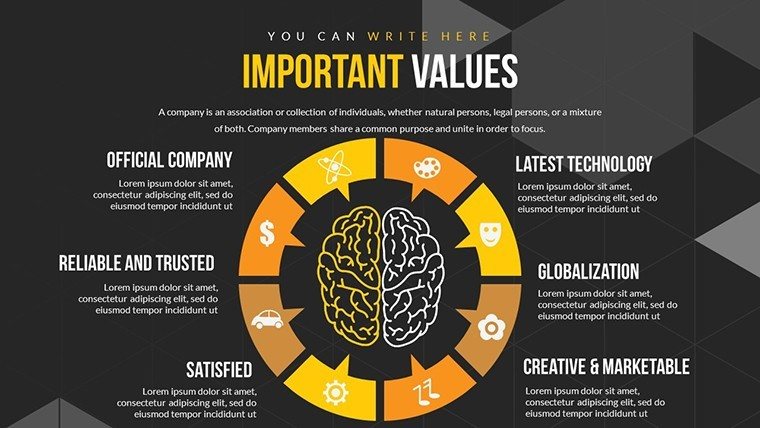
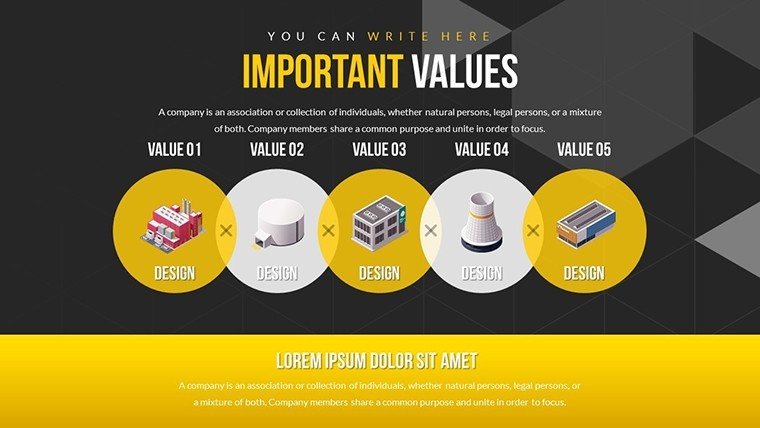
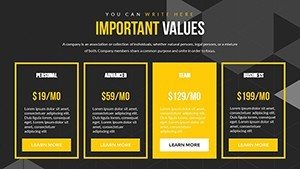
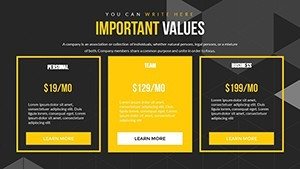
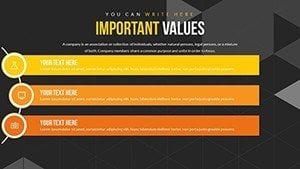
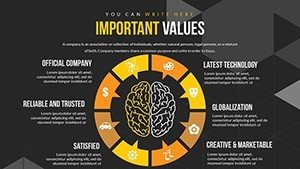
- Flexible Tailoring: Adjust fonts, colors, and layouts to suit economic themes.
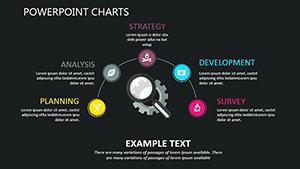
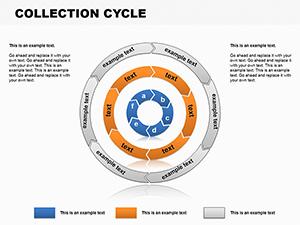
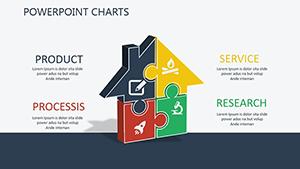
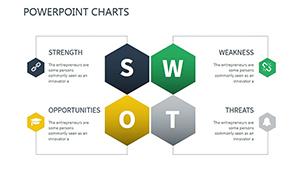
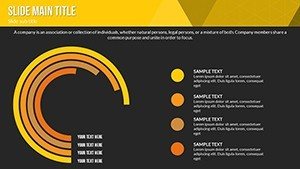
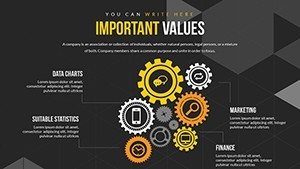
- Diverse Toolkit: Lines, bars, pies, and tables for comprehensive coverage.
- Insight Enhancers: Annotations and legends for nuanced interpretations.
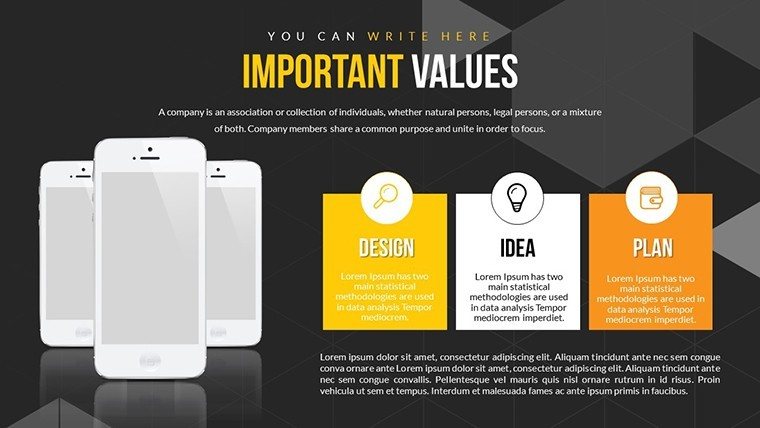
- Cross-Platform Ease: Compatible with PowerPoint and Google Slides.
- Sophisticated Visuals: Crisp, printable quality for professional outputs.
These embody through alignment with economic reporting standards.
Applied Economics: Scenarios That Transform
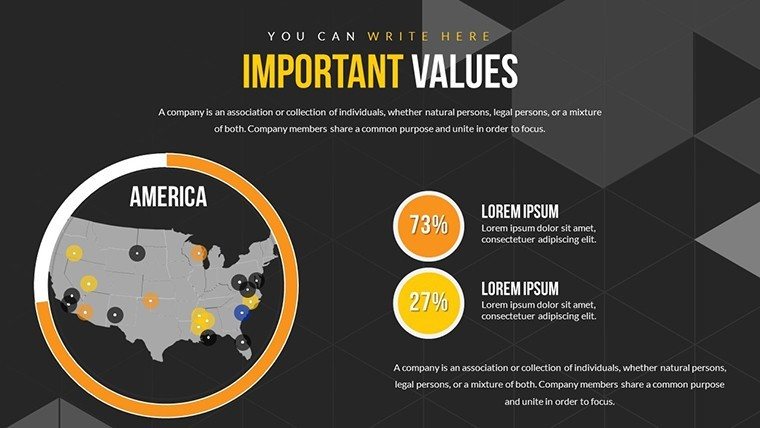
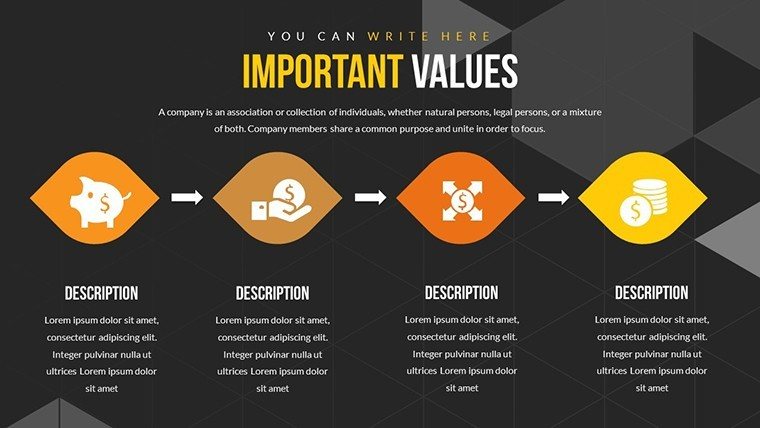
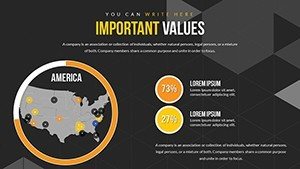
A financial analyst forecasting market shifts could visualize supply-demand curves, aiding investment calls. Consultants present client economic impacts, like tariff effects. Educators animate macro concepts, engaging with stagflation examples. Spanning sectors, it mitigates misinterpretations, promoting astute economic dialogues.
Guided Path to Economic Mastery
- Commence Acquisition: Download and infuse with economic datasets.
- Orchestrate Narrative: From broad trends to specific metrics.
- Polish Presentation: Use palettes evoking stability, like blues.
- Refine Collaboratively: Solicit peer reviews for accuracy.
- Deliver Dynamically: Animate reveals for emphasis.
- Assess and Adapt: Gauge reception for enhancements.
Excels over basics with integrated data handling.
Strategies for Economic Visual Excellence
Normalize scales for fair comparisons, per econometric principles. Infuse relatability with analogies, like 'economic rollercoasters.' A policy think tank reported heightened engagement in briefs using such visuals. This template elevates your analytical voice.
Custom Fits for Economic Fields
For development economics, track SDGs; in finance, model risks. Adaptable to any inquiry.
Unlock economic clarity - secure this template and forecast with finesse.
Frequently Asked Questions
How to handle time-series data?
Use timelines with adjustable scales for precision.
Supports econometric models?
Visualize outputs via graphs and tables.
Can I embed sources?
Hyperlink to data origins for credibility.
Suitable for policy briefs?
Yes, with concise, impactful designs.
Mac compatibility?
Seamless across platforms.
Version updates?
Available on our site periodically.