Place Value PowerPoint Charts Template - Editable Teaching Slides for Presentations


Type: PowerPoint Charts template
Category: Relationship
Sources Available: .pptx
Product ID: PC00601
Template incl.: 20 editable slides
Why Use Place Value Charts in Professional Presentations
Place value visualization transforms abstract numerical hierarchies into clear executive-level communication. When presenting financial projections to board members, breaking down multi-million dollar figures by place value clarifies scale instantly. I've used similar structures in quarterly reviews where CFOs needed to illustrate budget allocations across departments - showing thousands versus millions in visual segments eliminated confusion during approval discussions.
This template delivers 20 editable slides designed for professional contexts beyond classroom use. Finance teams apply these charts when explaining revenue breakdowns in investor decks. Operations managers use them to demonstrate cost structures during strategic planning sessions. The visual hierarchy works because executives process numerical magnitude faster when place values are color-coded and spatially separated.
Each slide supports customization in PowerPoint, Google Slides, and Keynote. You can adapt the base-10 block designs to represent organizational hierarchies, market segmentation by revenue tier, or phased budget rollouts. The template includes comparison charts, expandable number lines, and decomposition diagrams - all formatted for corporate branding consistency.
Slide Structure and Business Applications
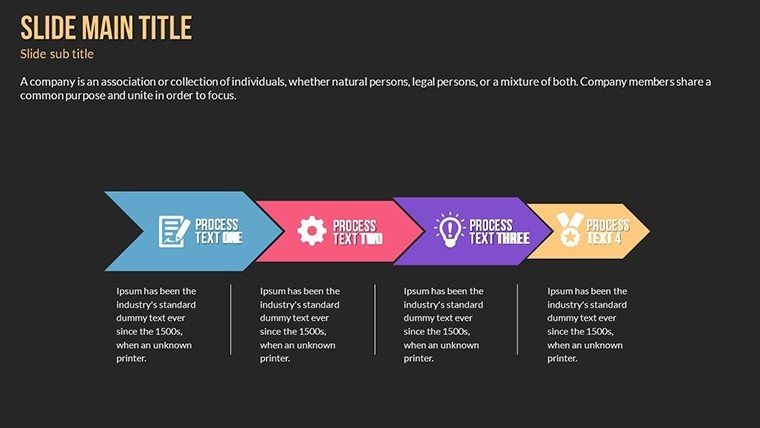
The first 5 slides establish foundational place value frameworks using interactive column charts. Slides 6-12 introduce hierarchical bar comparisons ideal for departmental budget presentations. The final 8 slides offer advanced infographic layouts for data import - perfect when your finance team needs to visualize actual quarterly numbers by magnitude.
In board meetings, use the decomposition slides to break down capital expenditure requests. Show a $5.2 million facilities upgrade as 5 millions + 2 hundred-thousands, then animate each place value to reveal allocation across buildings. This approach helped a real estate client secure approval by making large numbers tangible rather than abstract.
For investor presentations, the comparative place value charts illustrate year-over-year growth. Display revenue increase from $3.4M to $4.7M by highlighting the shift in the millions place, then drilling into the hundred-thousands to show quarterly acceleration. Investors appreciate this clarity when evaluating scaling potential.
Real Editing Workflow: From Download to Delivery
Download the PPTX file and open in PowerPoint or upload directly to Google Slides for cloud-based editing. Navigate to the slide matching your data type - budget comparison, growth timeline, or hierarchical breakdown. Click placeholder text and input your actual figures. The template auto-formats numbers within the place value columns.
Customize colors to match corporate branding by selecting chart elements and applying your company palette. For executive presentations, I recommend muted blues for units/thousands and accent colors for millions to emphasize scale. Adjust font sizes if presenting in large conference rooms - test visibility from 20 feet before finalizing.
Add animations strategically. Set place value columns to appear sequentially when revealing budget buildups during stakeholder meetings. Export to PDF for handout versions or embed directly into SharePoint for remote board reviews. The template maintains formatting across platforms, ensuring consistency whether viewed on tablets during meetings or projected in boardrooms.
Professional Use Cases Across Industries
Financial services firms use place value breakdowns when explaining portfolio compositions to high-net-worth clients. A wealth advisor might show a $12.3 million portfolio as components: $10M in equities (tens of millions place), $2M in bonds (millions), $300K in alternatives (hundred-thousands). This visual separation clarifies asset allocation instantly.
Manufacturing companies apply the templates during capacity planning presentations. Production managers demonstrate output targets using place values: 50,000 units (ten-thousands place) versus 5,000 (thousands) across different product lines. The charts make production scaling discussions concrete for C-suite audiences unfamiliar with floor operations.
Healthcare administrators present budget requests to hospital boards using these visualizations. Breaking down a $4.8M equipment purchase into place values helps board members understand capital deployment - especially when comparing against operational budgets in lower magnitude ranges.
When to Use vs. Alternative Approaches
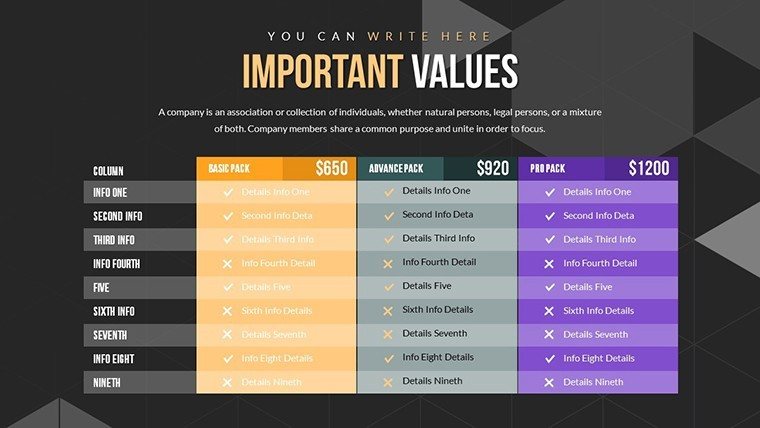
| Scenario | Use Place Value Charts | Use Standard Bar Charts |
|---|---|---|
| Budget presentations with multi-magnitude ranges | Yes - clarifies scale differences | No - scale compression loses impact |
| Trend analysis over time | Limited - better for snapshots | Yes - shows progression clearly |
| Revenue composition by segment | Yes - highlights magnitude tiers | Sometimes - depends on segment count |
| Executive summary slides | Yes - immediate visual impact | Yes - both work depending on message |
Integration with Corporate Presentation Workflows
Most finance teams build quarterly decks in PowerPoint then export to PDF for board distribution. This template integrates seamlessly - copy slides directly into your existing deck structure. Maintain consistent formatting by applying your corporate master slide settings after import.
For collaborative environments, upload to Google Slides and share editing access with your team. Financial analysts can populate actual data while presentation designers handle formatting. Version control through cloud platforms prevents the duplicate file chaos common in cross-departmental projects.
Embed completed slides into executive dashboards using tools like Microsoft Power BI or Tableau. Export individual charts as high-resolution images for inclusion in annual reports or investor relations materials. The scalable vector graphics ensure print quality even in large-format documents.
Ready to transform your financial presentations? Download this template and start building executive-ready slides that clarify numerical magnitude for any stakeholder audience.
Frequently Asked Questions
When should I use place value charts instead of standard financial graphs?
Use place value charts when presenting numbers with wide magnitude ranges to non-financial audiences. Board members without accounting backgrounds grasp $5.2 million faster when they see the 5 in the millions column separated from the 2 in hundred-thousands. Standard bar charts work better for trend analysis over time or when all values fall within similar ranges. I avoid place value formats in quarterly trend reviews but use them extensively in capital allocation discussions where scale clarity matters more than temporal progression.
How do I customize these templates for board meeting branding requirements?
Open the PPTX file and select any chart element to access PowerPoint's formatting options. Apply your corporate color palette by right-clicking chart components and choosing format options. Update fonts through the master slide settings to ensure consistency across all 20 slides. For logo placement, insert your company mark in the slide header or footer areas. Test the final output on the actual presentation screen in your boardroom - I've learned that color contrasts appearing fine on monitors sometimes wash out on older projectors.
Can executives unfamiliar with place value concepts understand these charts?
Yes, with minimal introduction. Start your presentation by spending 30 seconds explaining that each column represents a magnitude level - millions, thousands, hundreds. Most executives grasp the concept immediately because it mirrors how they mentally process large numbers. During one investor presentation, our CEO initially questioned the format but within two slides commented it was the clearest budget breakdown he'd reviewed. The visual separation eliminates the cognitive load of parsing 7-digit numbers written linearly.
What's the actual editing time from download to presentation-ready?
For straightforward budget presentations with existing data, expect 15-20 minutes. Download, open in PowerPoint, select appropriate slides, input your numbers into placeholders, apply brand colors, and add your logo. Complex customizations requiring new chart types or extensive animation sequences might take 45-60 minutes. I typically allocate one hour when preparing quarterly board decks, including time for review and adjustments based on stakeholder feedback.
Does this template work for international audiences with different number formatting?
The visual place value structure translates across numbering systems since it's based on magnitude representation rather than specific notation. However, you'll need to manually adjust decimal separators and thousand markers if presenting to European audiences who use commas for decimals. PowerPoint's regional settings can handle this, or simply edit text fields directly. I've used these charts in presentations to UK and German stakeholders by adapting the numerical notation while keeping the visual hierarchy intact.