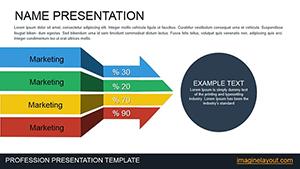
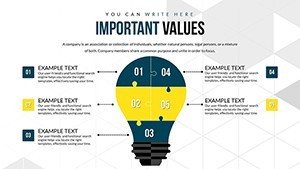
Creative Ideas PowerPoint Charts Template: Ignite Innovation in Your Presentations


Type: PowerPoint Charts template
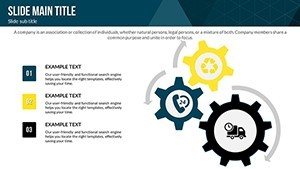
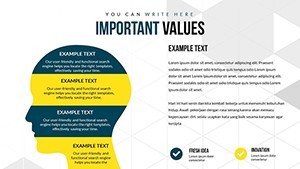
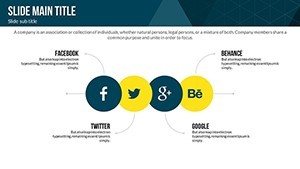
Category: Process, Relationship
Sources Available: .potx
Product ID: PC00573
Template incl.: 26 editable slides
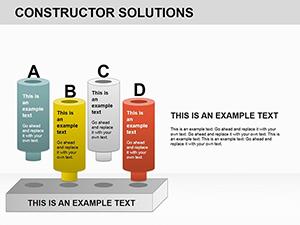
Imagine transforming your everyday data into a canvas of creativity that captivates your audience from the first slide. Our Creative Ideas PowerPoint charts template is designed precisely for that - empowering professionals like marketers, educators, and project managers to visualize complex processes and relationships with flair. With 26 fully editable slides, this template isn't just a tool; it's a gateway to presenting ideas that stick. Whether you're mapping out workflow dependencies or highlighting interconnections in team dynamics, these charts make abstract concepts tangible and engaging. Tailored for those who crave originality, it includes vibrant color variations, custom animations, and vector icons that breathe life into your narratives. Say goodbye to bland bar graphs and hello to dynamic visuals that foster discussion and drive decisions. Professionals in creative industries, such as advertising agencies or innovation consultancies, will find this template invaluable for brainstorming sessions or client pitches. By integrating high-quality images and seamless text edits, you can customize each slide to reflect your brand's voice, ensuring your message resonates deeply. Beyond mere aesthetics, this template addresses real-world challenges like clarifying data dependencies in project reports, making it easier to compare metrics and spot trends at a glance. Compatible with PowerPoint and Google Slides, it plays smoothly on any device, expanding your reach without technical hurdles.
Unlocking the Power of Visual Storytelling
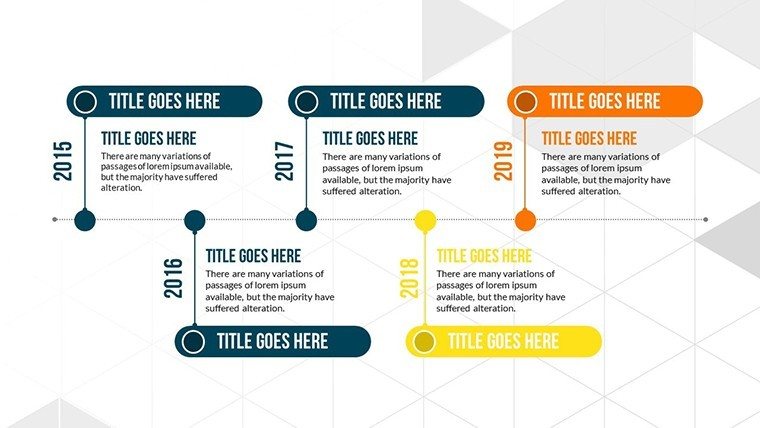
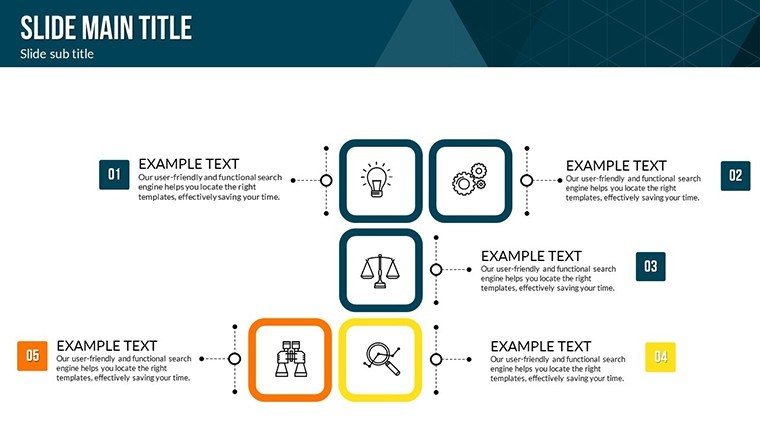
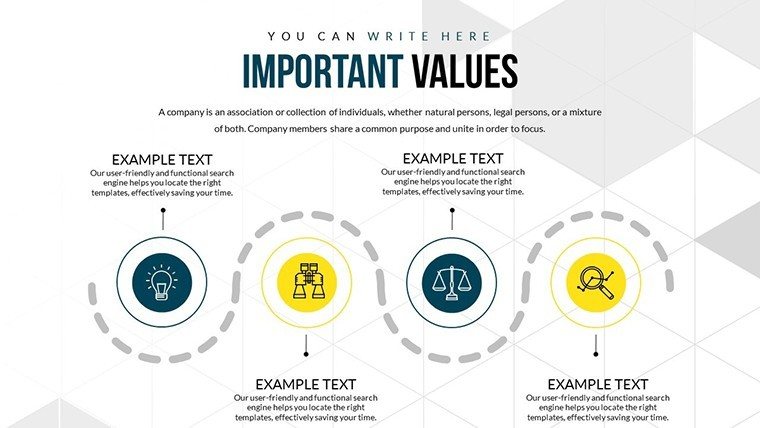
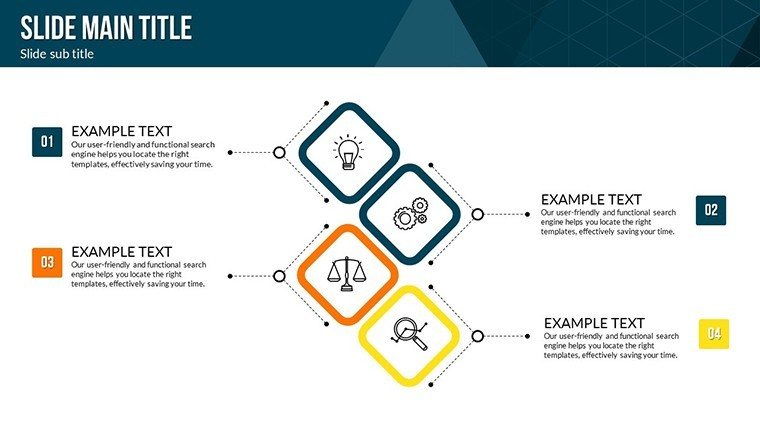
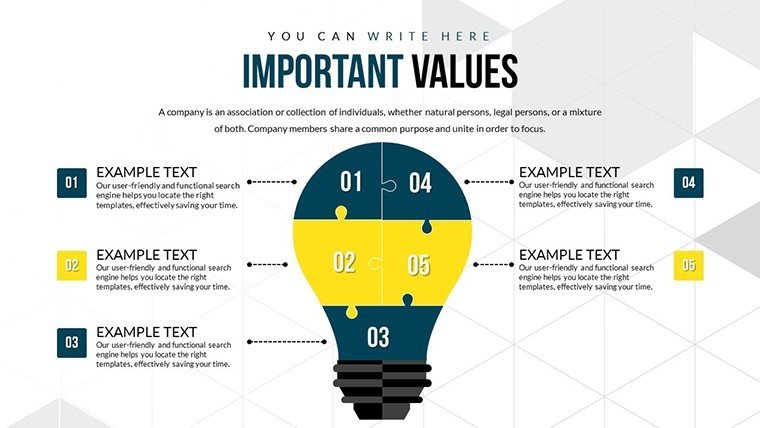
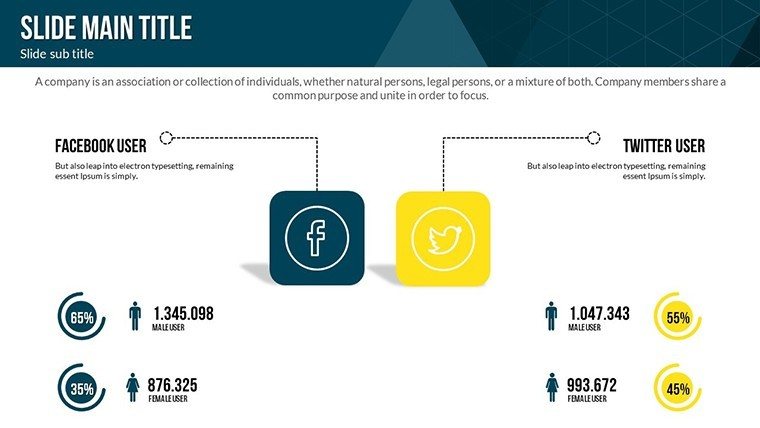
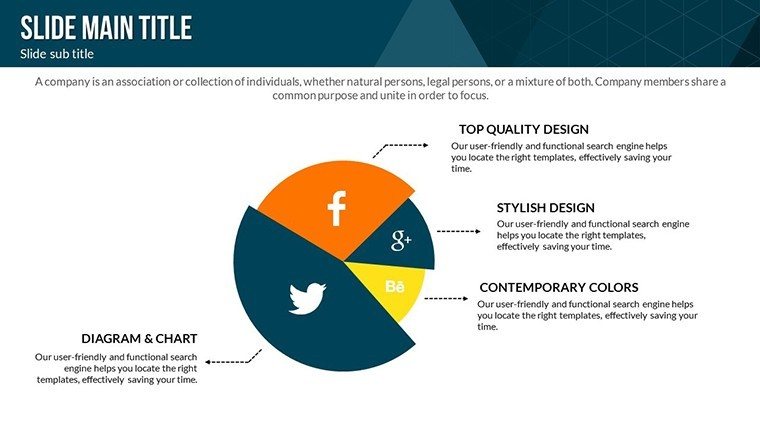
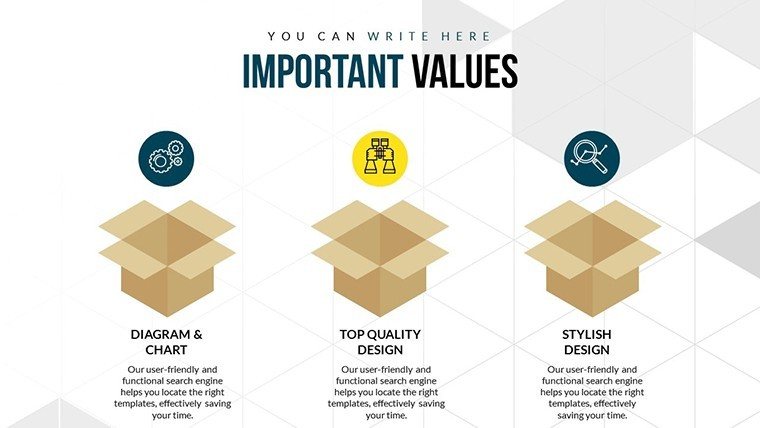
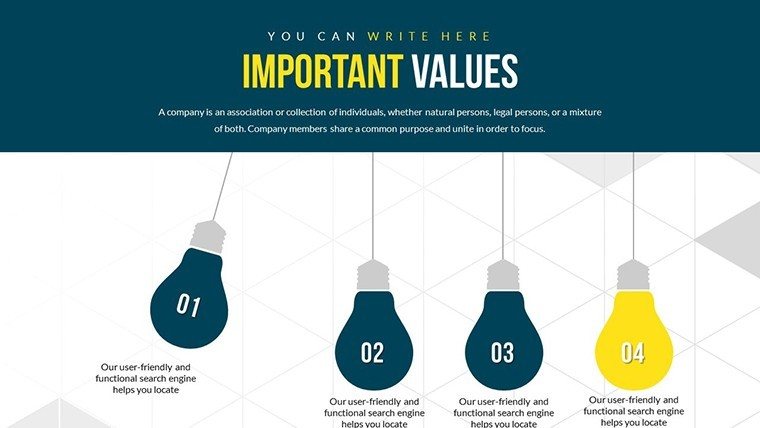
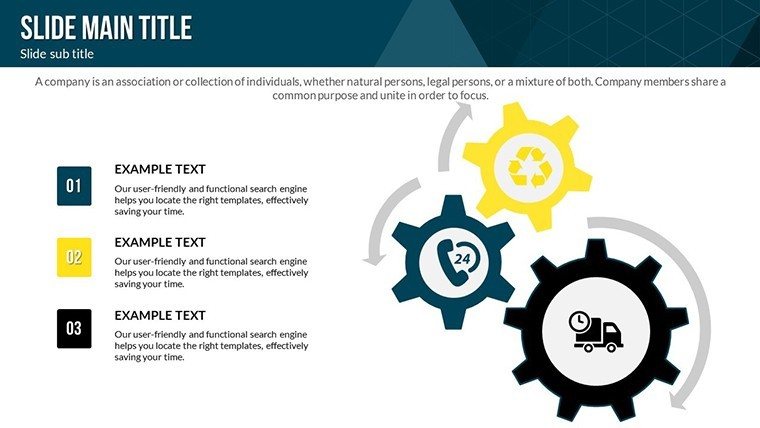
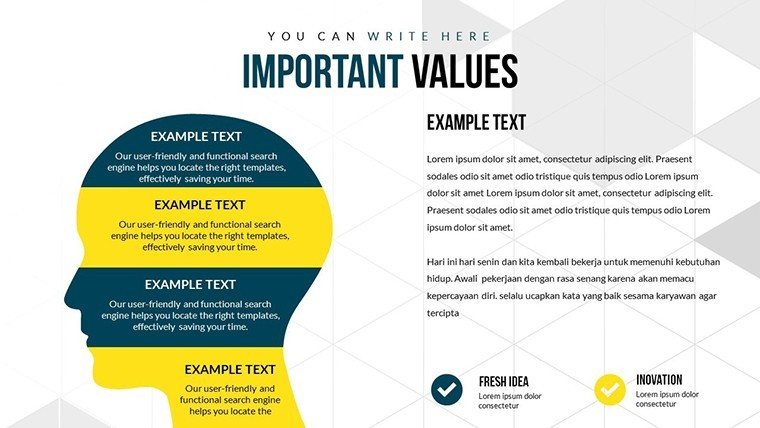
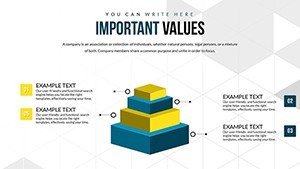
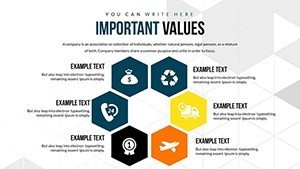
In a world where attention spans are fleeting, standing out requires more than facts - it demands a story. This Creative Ideas template excels in turning data into narratives through its process-oriented charts. For instance, use the relationship diagrams to illustrate how one idea branches into multiple outcomes, ideal for strategy meetings where innovation is key. Each slide is crafted with precision, allowing you to adjust elements like line thicknesses or icon placements for that perfect fit.
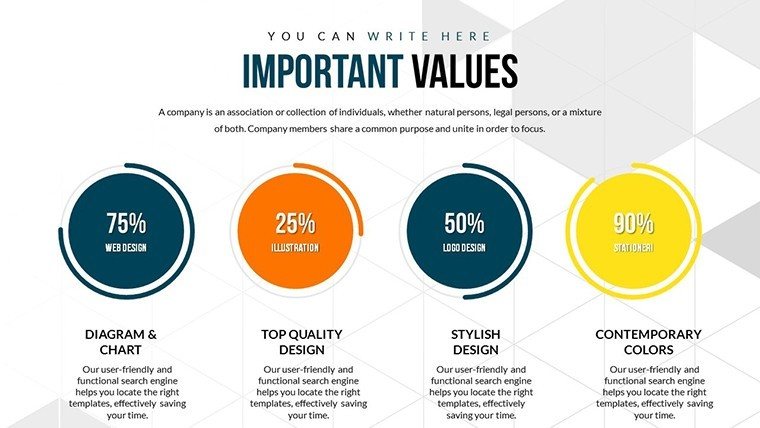
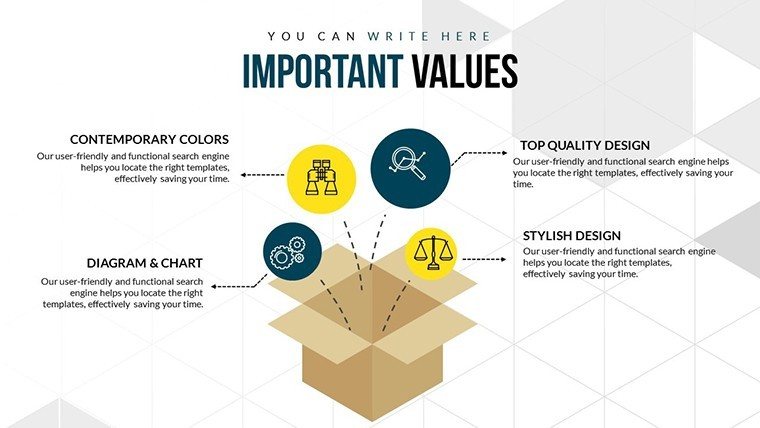
Key Features That Fuel Creativity
- Custom Animations: Bring your charts to life with subtle transitions that reveal data progressively, keeping viewers engaged without overwhelming them.
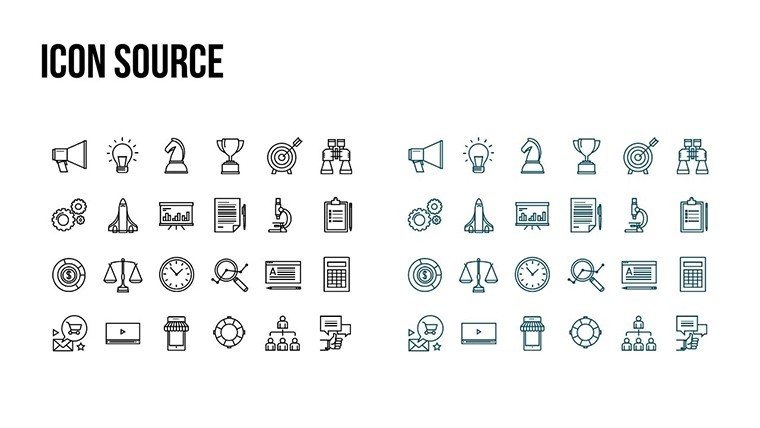
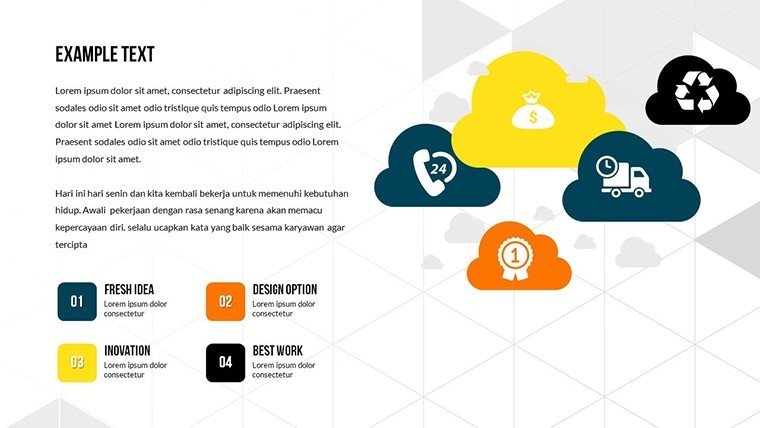
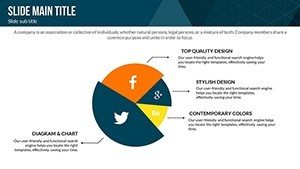
- Vector Icons and JPGs: Access a library of scalable icons that maintain clarity at any size, perfect for high-resolution prints or digital shares.
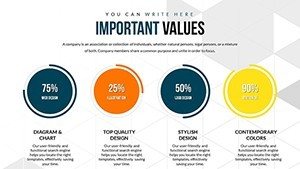
- Full Editability: Change colors to match your corporate palette or tweak text for audience-specific jargon, ensuring relevance in every context.
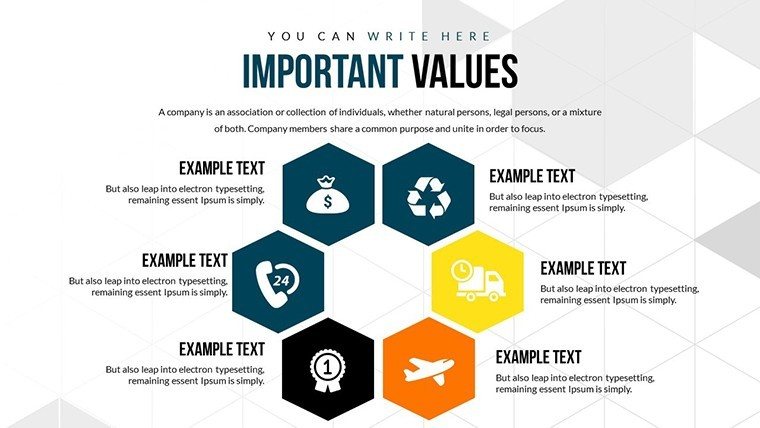
- High-Quality Inscriptions: Crisp labels and annotations that enhance readability, even in detailed relationship webs.
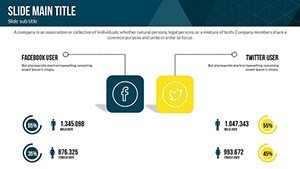
- Multimedia Integration: Embed videos of case studies or audio clips from experts to add depth to your creative pitches.
These features go beyond standard PowerPoint tools by offering specialized templates for creative ideation, reducing design time from hours to minutes.
Real-World Applications: From Brainstorms to Boardrooms
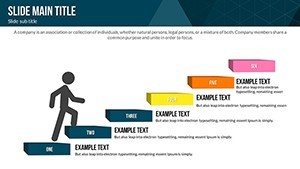
Picture this: You're leading a workshop on product development. Instead of static lists, deploy a relationship chart from this template to show how user feedback influences design iterations. In educational settings, teachers can use process flows to explain scientific methods, making lessons interactive and memorable. For marketers, compare campaign performance metrics visually, highlighting successes and areas for innovation. A case in point is how a tech startup used similar charts to pitch to investors, securing funding by clearly depicting growth dependencies. Unlike basic PowerPoint charts that lack animation, this template's effects guide the audience's focus, emphasizing key insights. Integrate it into your workflow by starting with data import from Excel, then customizing visuals - a step-by-step process that ensures accuracy and appeal.
Step-by-Step Guide to Maximizing Your Template
- Download and open the .potx file in PowerPoint.
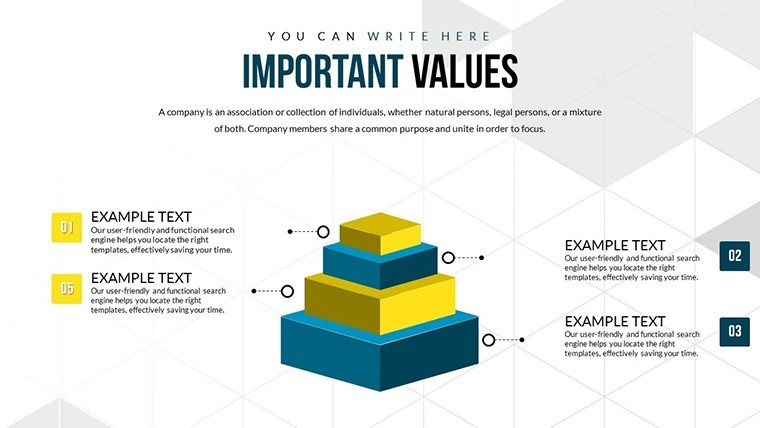
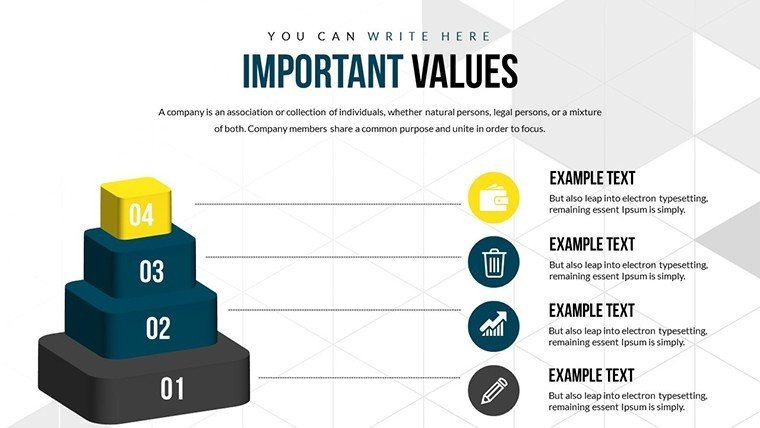
- Select a slide that matches your data type, like a dependency graph for process mapping.
- Input your values and adjust colors via the theme editor for brand consistency.
- Add animations to reveal elements sequentially, enhancing narrative flow.
- Preview and export - ready for presentation or sharing via cloud services.
This streamlined approach solves common pain points, such as mismatched visuals in collaborative edits, by providing a unified editable framework.
Why Choose This Template Over Alternatives?
Basic PowerPoint offers rudimentary charts, but they often fall flat in creative contexts. Our template stands out with themed icons tailored for idea generation, ensuring your presentations aren't just informative but inspiring. Value propositions include time savings - craft a polished deck in under an hour - and versatility across industries. For instance, in design firms, use it to map client feedback loops, aligning with creative best practices like those from IDEO's human-centered design principles. Subtle CTAs throughout your deck, like "Explore this idea further," can prompt audience interaction. Tips for optimization: Layer charts with transparency effects for depth, or combine with infographics for hybrid visuals. Workflow integration is seamless; link slides to external data sources for live updates, keeping your creative ideas current.
As you wrap up your presentation, leave a lasting impression with a summary slide that ties back to core relationships. Elevate your creative output today - download this template and watch your ideas flourish.
Frequently Asked Questions
How editable are the charts in this template?
Every element is fully customizable, from colors and text to animations and icons, allowing you to tailor it completely to your needs.
Is this compatible with Google Slides?
Yes, import the .potx file into Google Slides for seamless editing and presentation on any device.
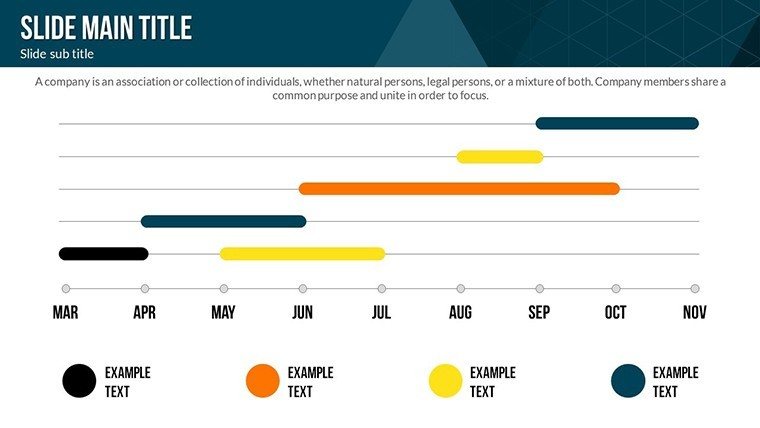
What types of data are best suited for these charts?
Ideal for process flows and relationship mappings, such as idea dependencies or team interconnections in creative projects.
Can I add my own images or videos?
Absolutely, the template supports easy insertion of multimedia to enhance your storytelling.
Are there any animation presets included?
Yes, custom animated effects are pre-built, ready for you to apply and modify.
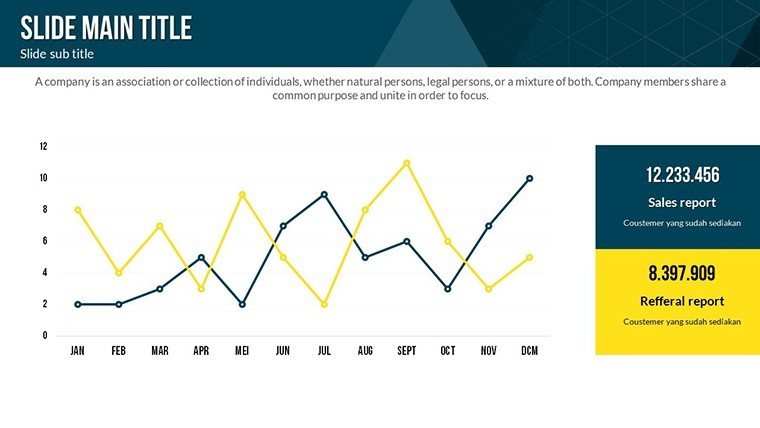
How does this help with data comparison?
It graphically clarifies dependencies, making comparisons intuitive and visually engaging.