 Click to zoom
Helpful Tips PowerPoint Chart Template for Engaging Infographics
| Format | .pptx |
| Slides | 22 unique layouts |
| Aspect ratio | 16:9 |
| Compatibility | PowerPoint |
| Animated | No |
| Language | English |
| License | Commercial |
| File size | — |
| Version | v1.0 |
| Last updated | August 2023 |
What's inside
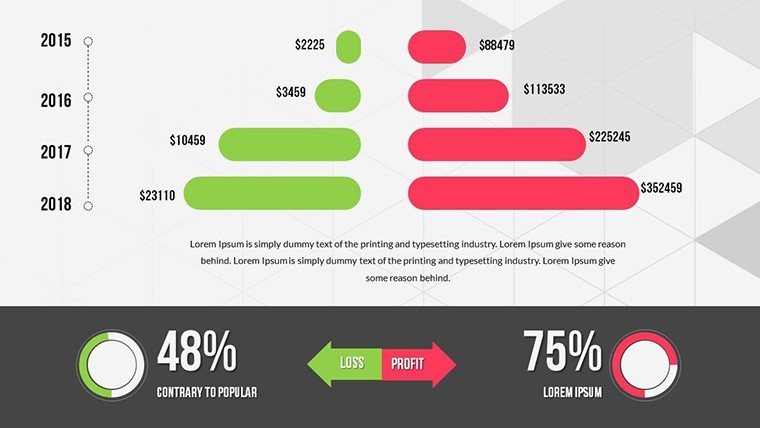
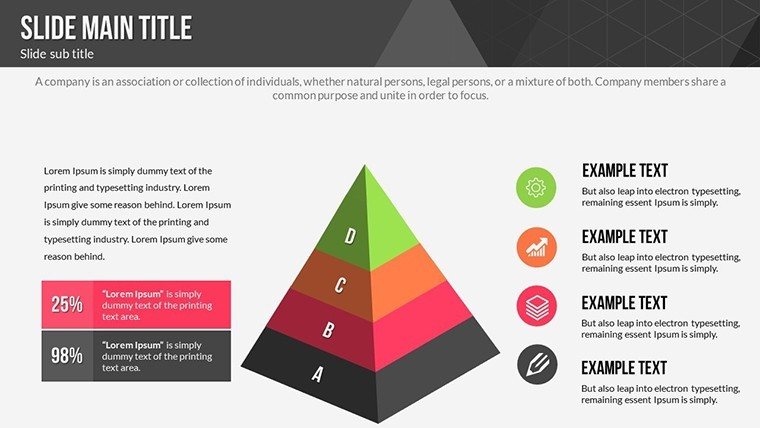
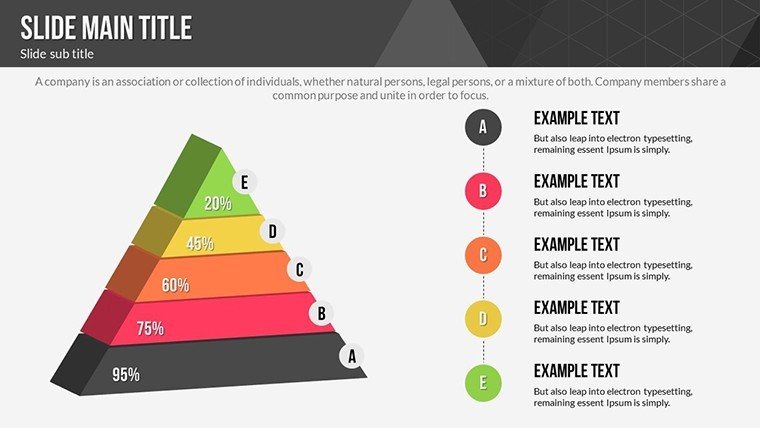
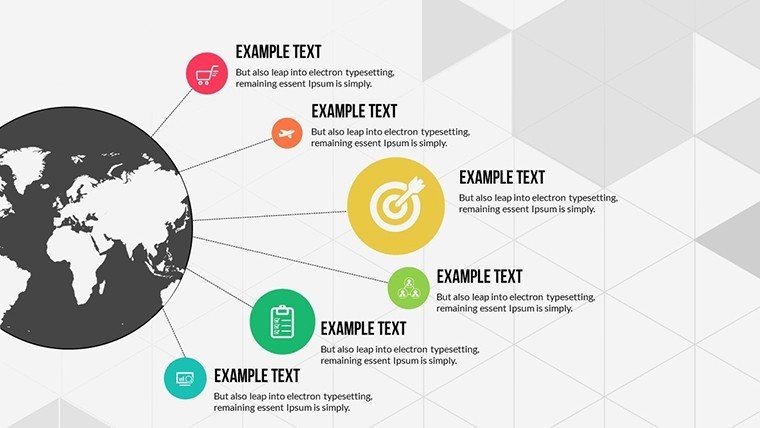
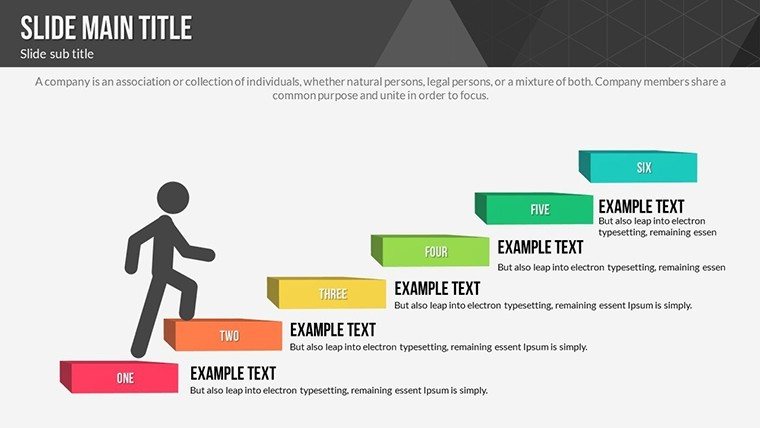
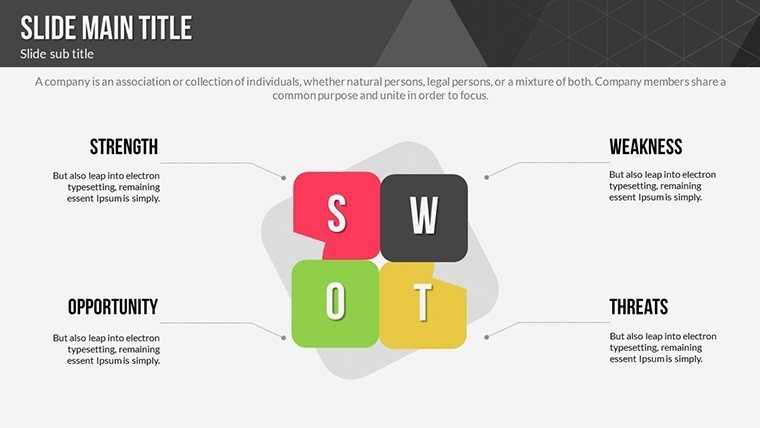
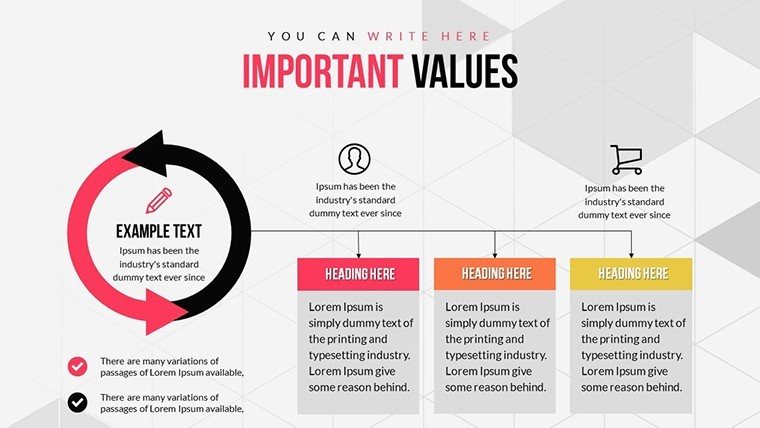
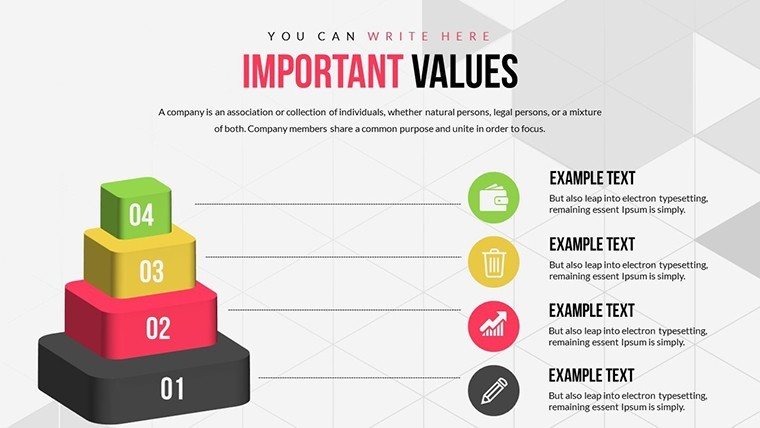
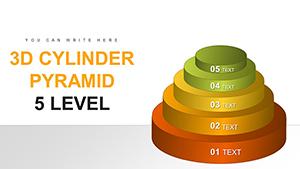
Imagine stepping into a room full of stakeholders, armed not with dense spreadsheets but with vibrant infographics that distill your message into digestible, memorable visuals. That's the promise of our Helpful Tips PowerPoint chart template, boasting 22 editable slides centered on 3D designs and pyramid structures. Tailored for those who need to educate, persuade, or inspire, this template integrates practical tips right into its framework, guiding you on everything from content structuring to audience engagement. Business educators might use it to break down market trends in a pyramid hierarchy, while architects could layer design phases in 3D for client reviews. With its focus on transforming raw data into narrative-driven visuals, it addresses common pain points like audience disengagement, offering a blend of aesthetics and utility that standard templates can't match.
Elevate Your Storytelling with Advanced Visual Tools
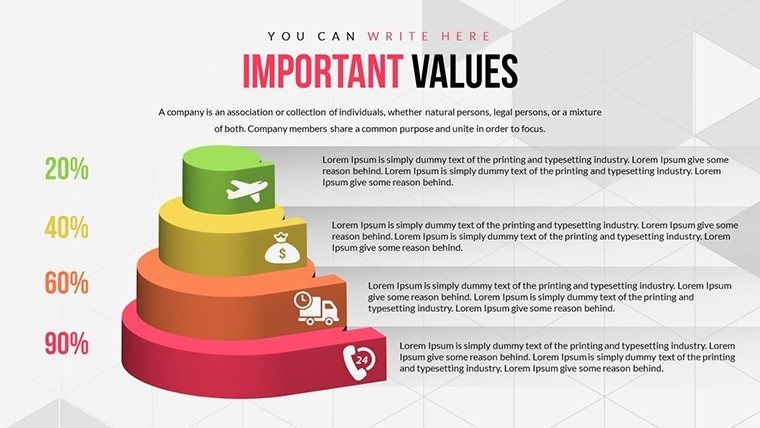
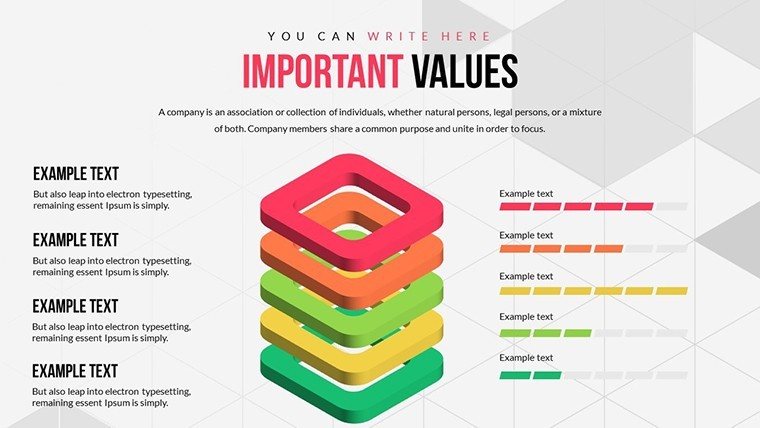
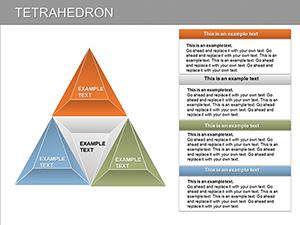
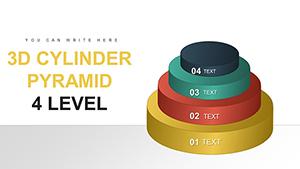
This template goes beyond mere decoration, embedding helpful tips that draw from presentation experts like Nancy Duarte, who emphasizes resonant storytelling. The 3D elements add depth to your data, making abstract concepts tangible - think of a pyramid chart illustrating the foundational layers of a building's sustainability plan. Pyramid slides excel at showing hierarchies, such as priority levels in project management, while 3D views provide multi-angle perspectives that enhance comprehension. For professionals in high-stakes fields, this means clearer communication, reducing misinterpretations that can derail projects.
Standout Features for Seamless Customization
- Extensive Personalization: Adjust fonts, colors, and layouts to align with your branding, ensuring consistency across all materials.
- Integrated Presentation Advice: Built-in tips on each slide remind you of best practices, like using contrast for readability in visual aids.
- Engaging 3D and Pyramid Designs: Create layered visuals that pop off the screen, perfect for demonstrating progress or breakdowns.
- Cross-Platform Support: Fully compatible with PowerPoint and adaptable for Google Slides, facilitating collaboration.
- Data Transformation Tools: Easily input metrics to generate infographics that narrate your story, with options for animations.
In practice, these features shine in scenarios like a marketing team pitching a campaign, where pyramid charts rank strategies by impact, supported by tips on captivating hooks.
Practical Use Cases Across Industries
From classrooms to conference rooms, this template adapts effortlessly. Educators can use 3D charts to visualize scientific processes, making lessons interactive and retention-boosting. In architecture, apply pyramid structures to outline compliance with AIA standards, from base regulations to innovative tops. Public speakers benefit from the tips section, refining delivery to command attention effectively.
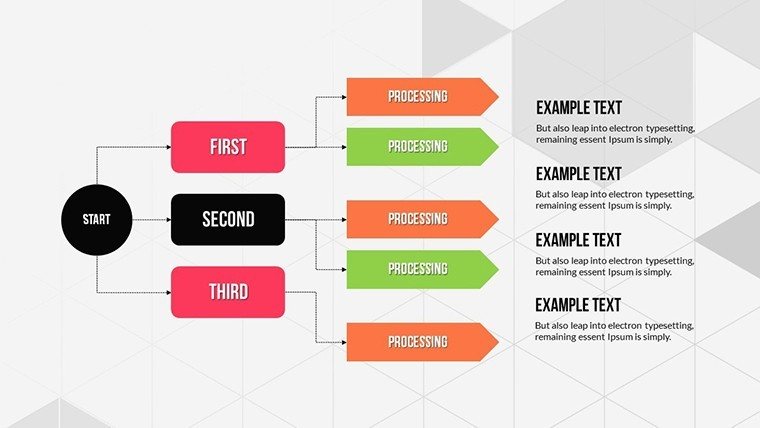
A typical workflow: Open Slide #1 for an overview pyramid of your topic. Customize Slides #5-10 with data-specific 3D views, adding tips like 'Keep text concise.' Use #15-20 for case studies, animating transitions to reveal insights. Conclude with #21-22, incorporating CTAs guided by embedded advice. This approach not only streamlines creation but leverages visual psychology, where 3D elements can improve understanding by 25% per cognitive studies.
Proven Strategies to Enhance Your Delivery
- Align visuals with objectives: Match pyramid levels to your key messages for logical flow.
- Leverage tips actively: Apply suggestions like varying slide pacing to maintain interest.
- Incorporate interactivity: Add clickable elements in PowerPoint for deeper dives.
- Review for accessibility: Ensure color contrasts meet WCAG standards for inclusive presentations.
- Practice with feedback: Use the template's structure to iterate based on audience reactions.
Versus generic PowerPoint pyramids, this version includes thematic tips that elevate from basic to expert-level, saving time and enhancing professionalism.
Step Up Your Presentation Game Now
With its blend of helpful tips and innovative designs, this template is a must-have for anyone aiming to make data sing. Whether simplifying complex architectures or educating on business trends, it's your tool for lasting impact. Secure your copy and start crafting infographics that educate and enchant.
Frequently Asked Questions
What makes the tips in this template unique?
They draw from expert sources, offering actionable advice integrated directly into slides for on-the-fly improvements.
Can I edit the 3D elements easily?
Yes, all 3D and pyramid components are fully customizable without needing advanced skills.
Is it suitable for beginners?
Absolutely, the embedded tips guide newcomers through effective use.
Does it support animations?
Yes, pre-set animations enhance the 3D and pyramid visuals for dynamic presentations.
How many slides focus on pyramids?
Several are dedicated, with flexibility to adapt others as needed.
Good for
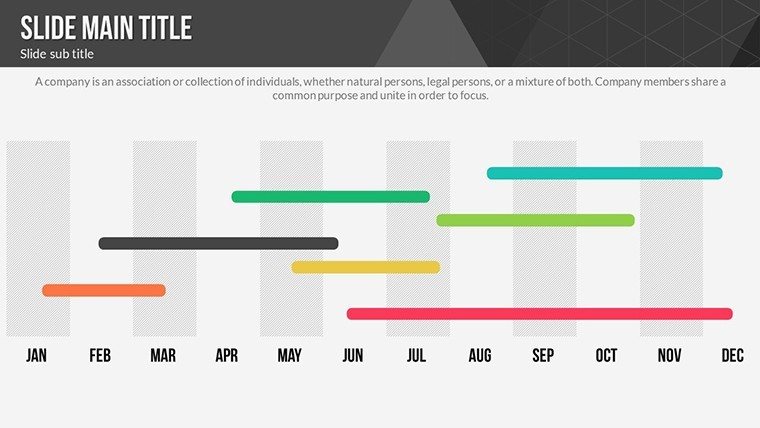
- Project roadmaps and sprint plans
- Product launch timelines
- Quarterly or annual review decks
- Company history and milestone summaries
Licence
reviews
Pretty average template overall but it got the job done.
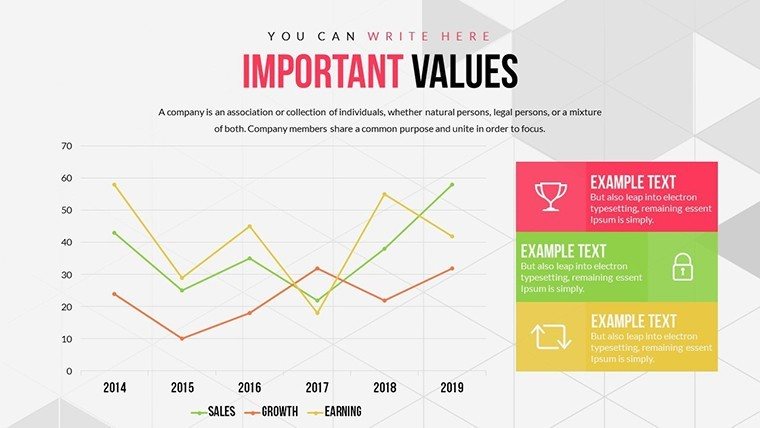
Needed a quick deck for work and the comparison charts saved me from building them manually.
I’m not into presentation design but the slide flow felt natural.
Some slides had too much going on visually though the charts themselves were useful.
The layout worked well for my economics class presentation.
FAQ
Will it work in Google Slides?
Are fonts embedded?
Can I use this for client work?
What's the refund policy?
Do you update the template after purchase?
Similar templates
See all PowerPoint Charts →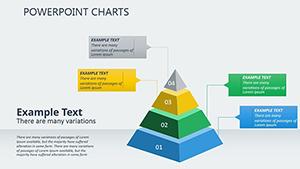
All 22 slides