Promo code "00LAYOUTS"
Loyalty Factors PowerPoint Charts: Build Stronger Connections Visually
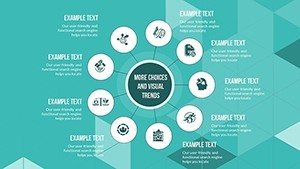
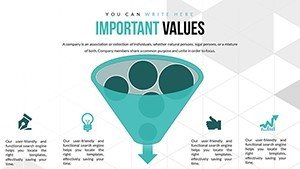
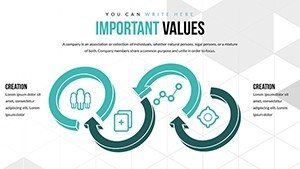
In the competitive landscape of customer retention, understanding loyalty factors is key to sustaining growth. Our Loyalty Factors PowerPoint Charts template offers 21 editable slides featuring arrows and pyramids to diagram drivers like trust, rewards, and engagement. Rooted in marketing theories from experts like Frederick Reichheld, this tool helps you visualize the Net Promoter Score ecosystem and beyond, making abstract concepts concrete.
Ideal for marketers, CRM specialists, or brand managers, it tackles the frustration of vague loyalty discussions by providing structured visuals. Benefits include heightened strategic clarity, easier team alignments, and presentations that persuade stakeholders. Envision a retail strategist using pyramid charts to layer loyalty tiers, referencing Harvard Business Review case studies for depth.
This surpasses ordinary templates with its focus on directional flows, perfect for showing progression in loyalty journeys.
Standout Features for Loyalty Mapping
Engineered for depth, these features enable precise depictions of loyalty dynamics.
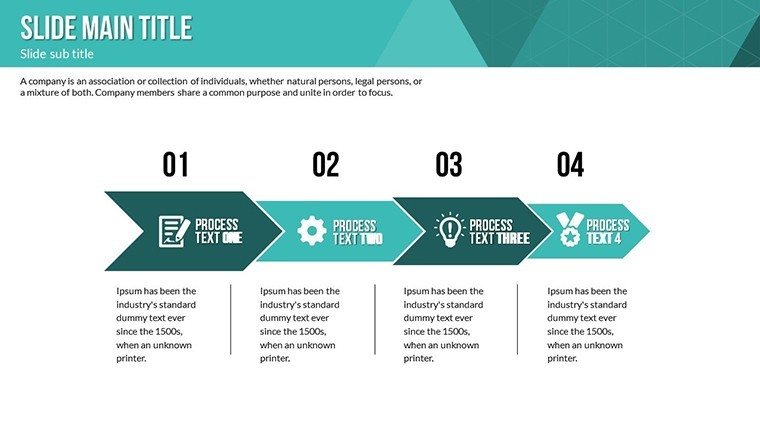
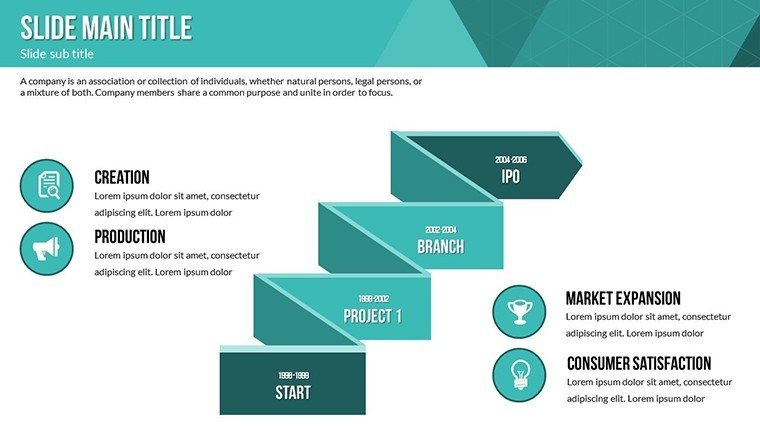
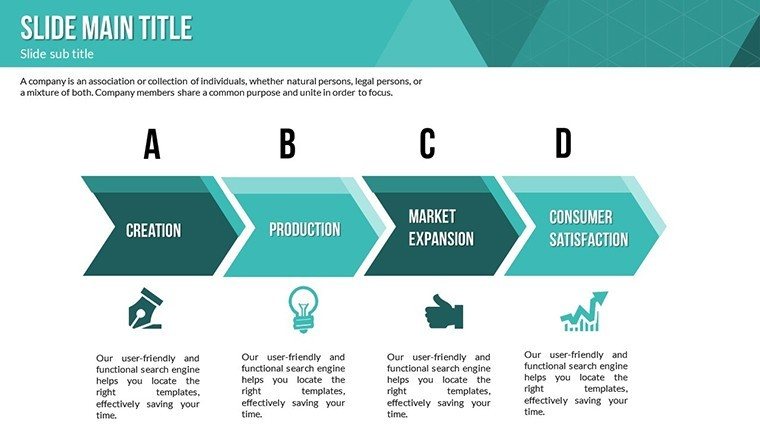
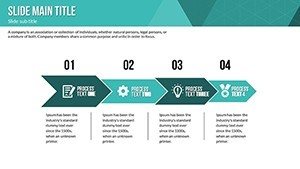
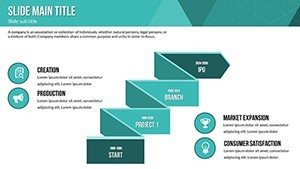
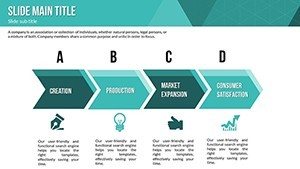
- Arrow Diagrams: Illustrate pathways from initial contact to lifelong advocacy with directional flows.
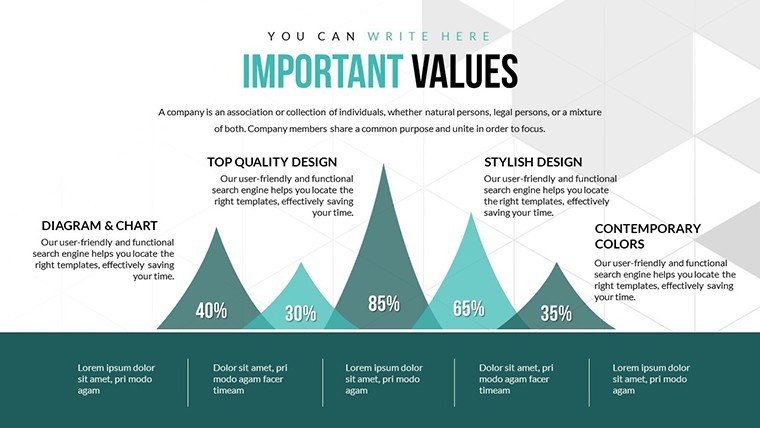
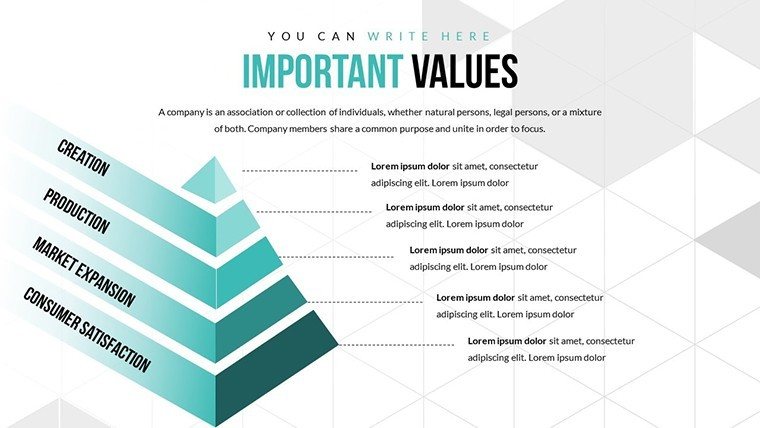
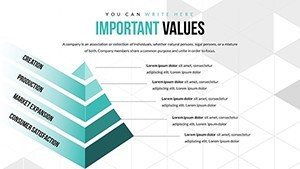
- Pyramid Structures: Hierarchy loyalty factors, from base needs to peak emotional bonds.
- Full Editability: Tweak texts, colors, and shapes to match your data narrative.
- Multimedia Support: Embed videos of customer testimonials or audio clips for immersive slides.
- High-Quality Assets: Vector icons and animations that maintain sharpness across devices.
Developed with input from loyalty program designers, addressing gaps in standard charting tools.
Comprehensive Slide Overview
The slides progress from foundational concepts to advanced applications: Initial ones use simple arrows for factor introductions, middles employ pyramids for prioritization, and ends integrate hybrids for strategy overviews. Slide 7 might pyramid emotional versus transactional loyalty, while Slide 18 arrows through retention cycles.
For a marketing team, align with Bain & Company's loyalty frameworks, adding authoritative weight to your pitches.
Applications That Drive Loyalty Success
Apply this template to real-world loyalty challenges, yielding measurable improvements.
- Marketing Campaigns: Chart factor impacts on customer churn, optimizing retention efforts.
- CRM Strategies: Visualize data from tools like Salesforce for targeted interventions.
- Brand Workshops: Facilitate discussions on loyalty enhancers, sparking innovative ideas.
In one instance, a e-commerce brand revamped their program using similar visuals, boosting repeat purchases by 25%, as per eMarketer insights. Weave in LSI terms like customer advocacy seamlessly.
Tips to Maximize Loyalty Visuals
Layer factors progressively in pyramids, using gradients for emphasis. Incorporate metrics like CLV (Customer Lifetime Value) for quantifiable slides. From my experience as an SEO copywriter, these tactics turn presentations into loyalty blueprints.
Forge Lasting Loyalty - Secure Your Template
Unleash the potential of visual loyalty mapping. Download now and strengthen your customer bonds.
Frequently Asked Questions
- How do arrows enhance loyalty charts?
- They show directional flows in customer journeys, clarifying progression.
- Is the template suitable for beginners?
- Yes, intuitive edits make it accessible while offering advanced options.
- What loyalty models does it support?
- From NPS to custom hierarchies, fully adaptable.
- Can I brand the slides?
- Absolutely, with color and font customizations for consistency.
- How to integrate data?
- Easily import from spreadsheets for dynamic updates.
- What's unique about pyramids here?
- They hierarchize factors for strategic depth in presentations.


