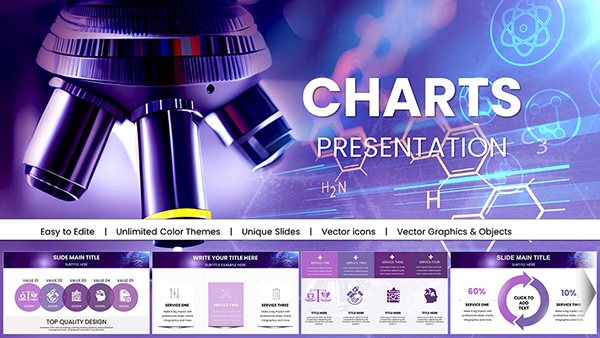
Quality Control PowerPoint Charts Template: Precision in Every Presentation


Type: PowerPoint Charts template
Category: Tables, Illustrations, Puzzles
Sources Available: .pptx
Product ID: PC00560
Template incl.: 28 editable slides
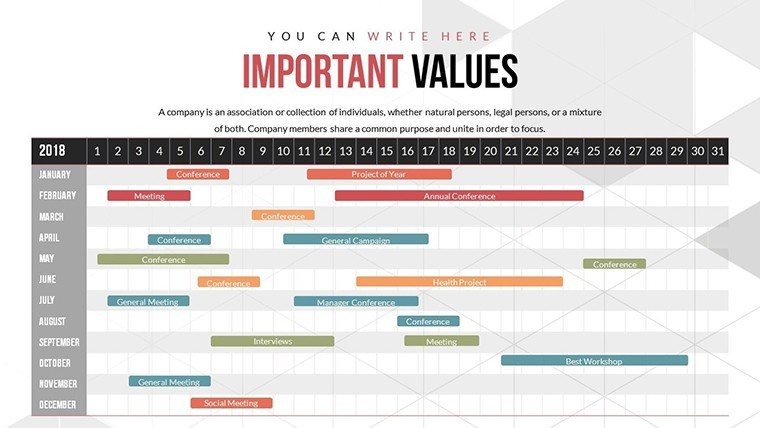
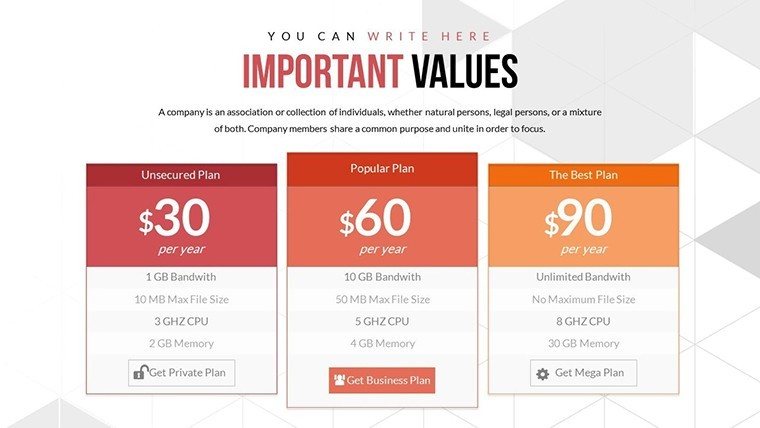
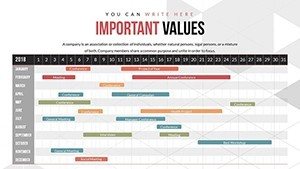
Step into a realm where quality control isn't just a process - it's a compelling story told through visuals that command attention. Our Quality Control PowerPoint charts template, with its 28 editable slides, is crafted for manufacturing managers, QA specialists, and consultants who demand accuracy and impact. This template transforms intricate metrics into digestible graphs, addressing pain points like tracking process improvements or highlighting milestones. Drawing from standards like ISO 9001, it offers stunning charts that ensure data integrity while engaging audiences. Business pros can showcase defect rates or compliance stats with ease, while educators illustrate quality principles vividly. Fully customizable, it includes versatile layouts for any scenario, compatible with PowerPoint for seamless use. Imagine presenting audit findings where visuals pinpoint variances, inspired by real cases from industries like automotive, where Six Sigma methodologies thrive. This isn't mere data display; it's a tool for fostering continuous improvement, with features that save time and elevate professionalism.
Delving into Customization for Quality Excellence
Customization is the cornerstone of effective quality presentations. Adjust color schemes to highlight critical thresholds or fonts for readability in detailed reports, ensuring your message aligns with organizational standards.
Essential Features Driving Quality Insights
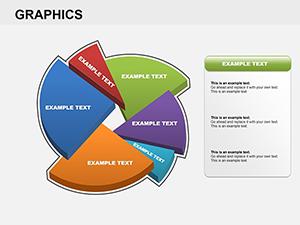
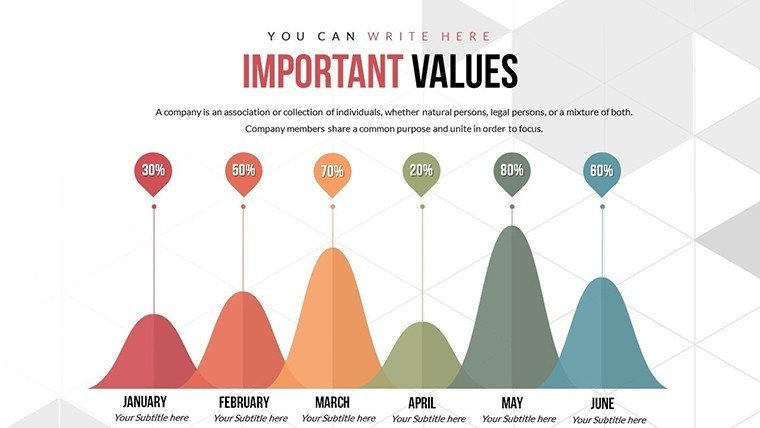
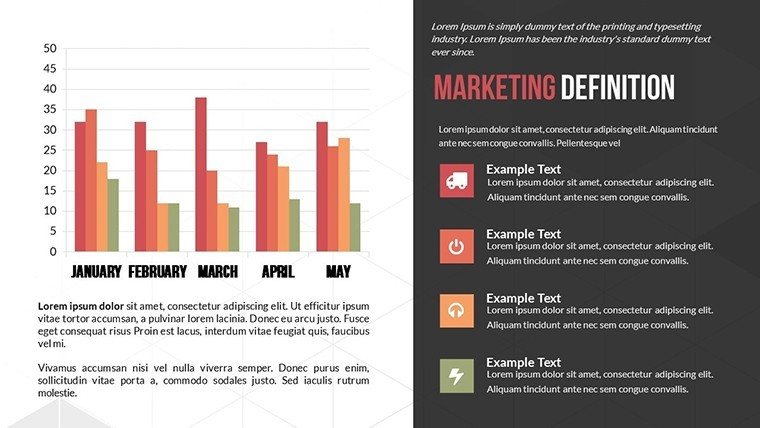
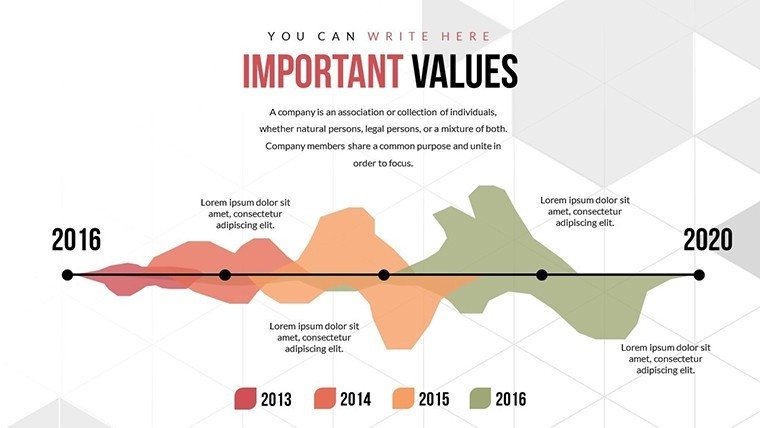
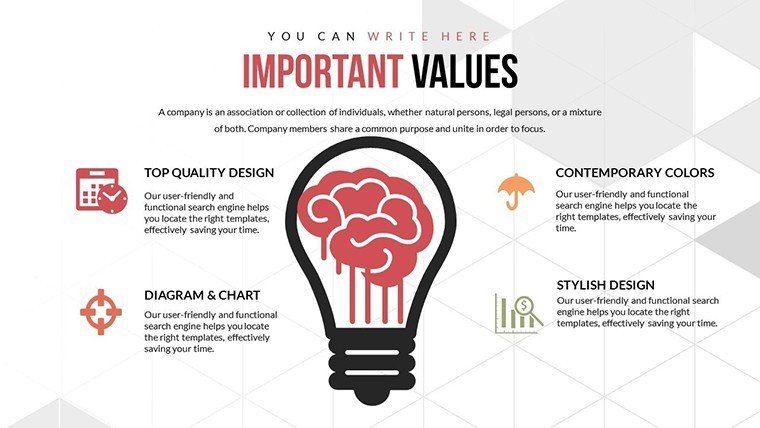
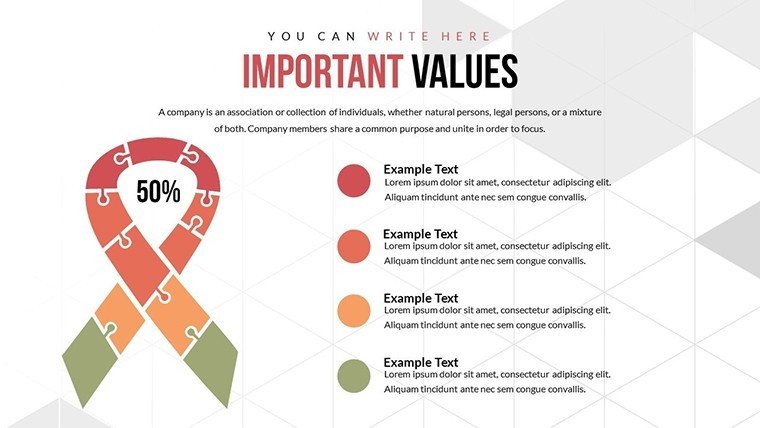
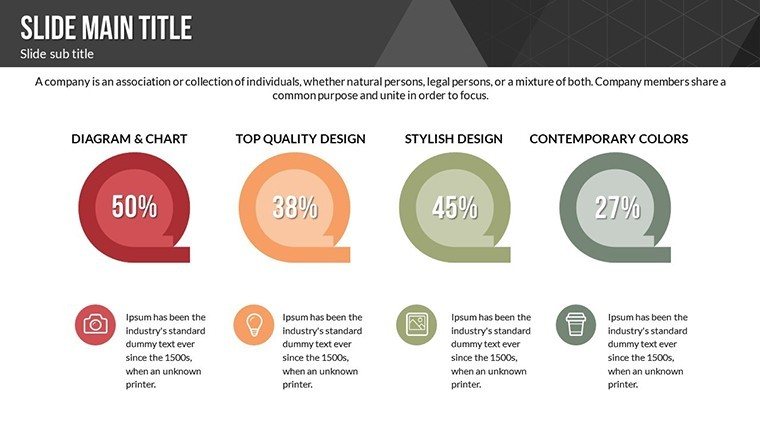
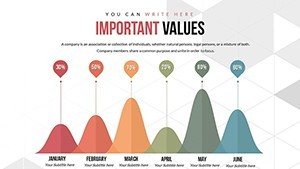
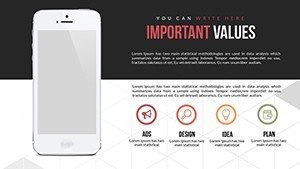
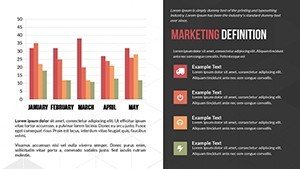
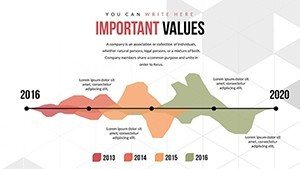
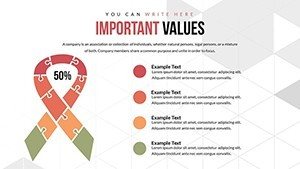
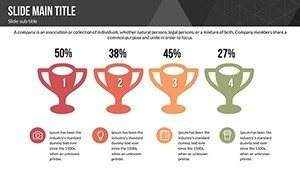
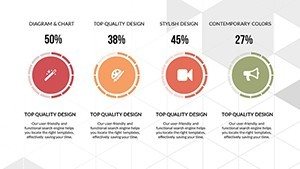
- Stunning Visuals: High-fidelity charts for metrics like yield rates or error trends.
- Data Precision: Accurate scaling and labeling to avoid misinterpretation.
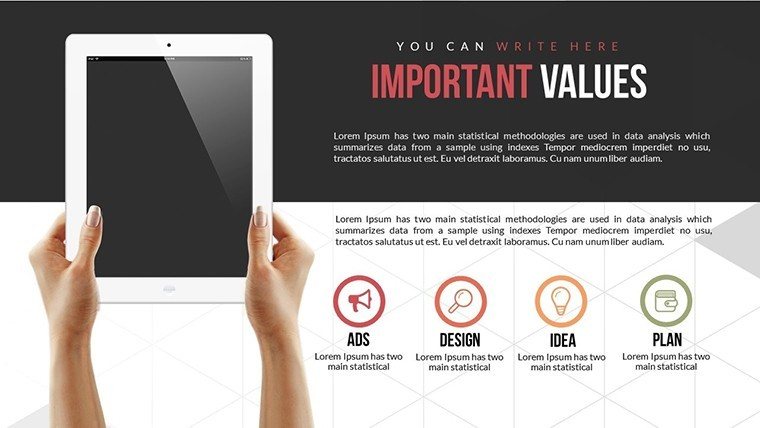
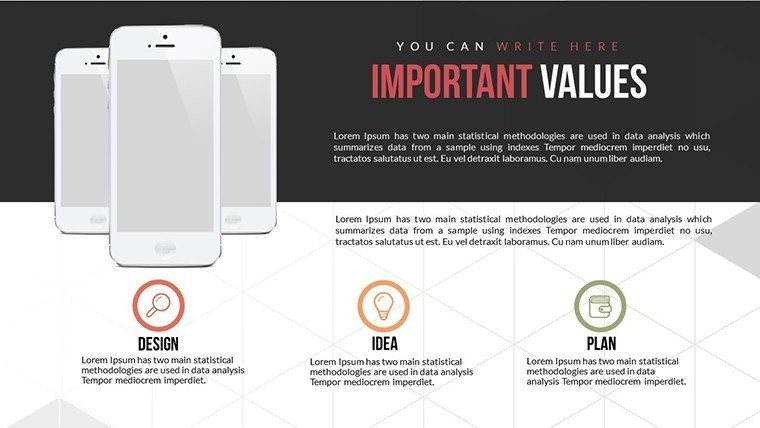
- User-Friendly Edits: No design skills needed - drag, drop, and done.
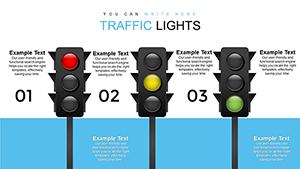
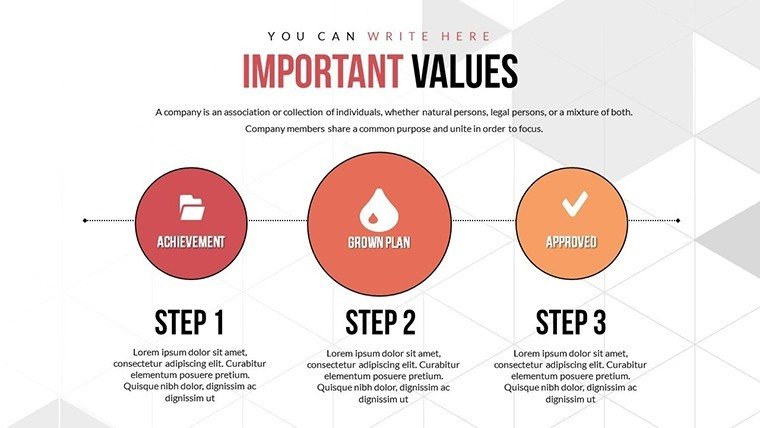
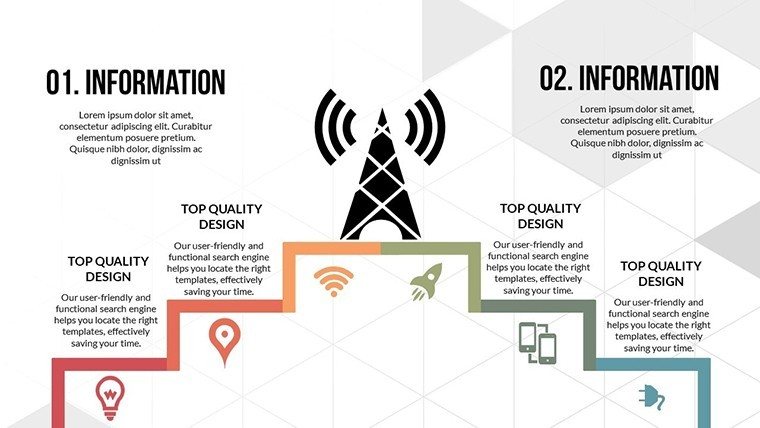
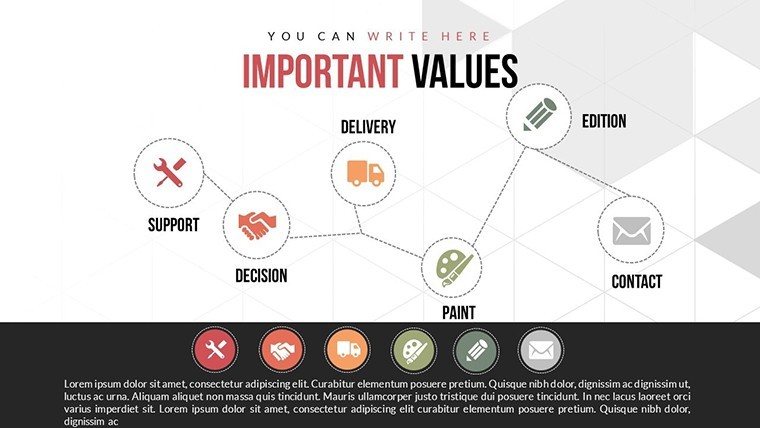
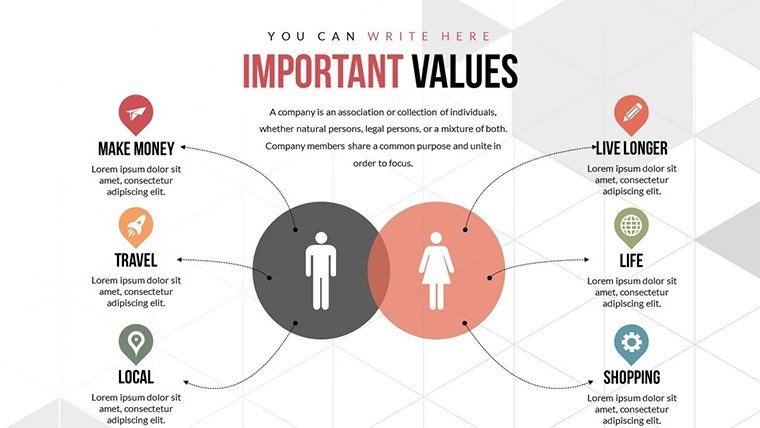
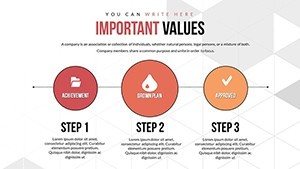
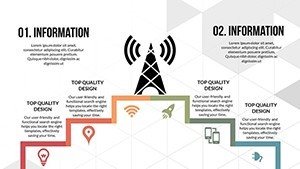
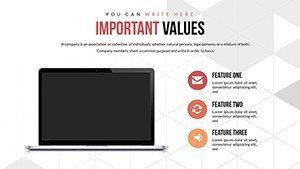
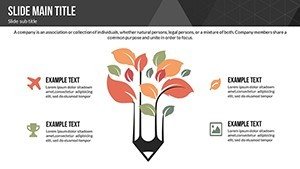
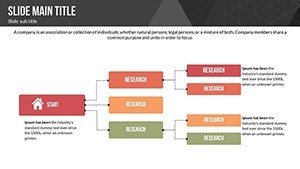
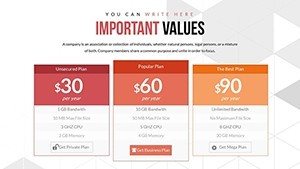
- Versatile Applications: From process flows to milestone trackers.
- Integration Options: Embed real-time data feeds for dynamic updates.
These surpass built-in tools by focusing on quality-specific visuals, like control charts for variance analysis.
Applied Use Cases: Enhancing Operational Quality
In a manufacturing audit, deploy a graph to show defect reductions post-intervention, mirroring successes in companies adhering to Lean principles. Consultants might use it for client reports, comparing pre- and post-quality metrics. Educators can break down concepts like Pareto analysis visually. Compared to basic PPT, this template's precision prevents data distortion, crucial for compliance. Workflow tip: Start with template import, populate with SPC software data, then animate for emphasis.
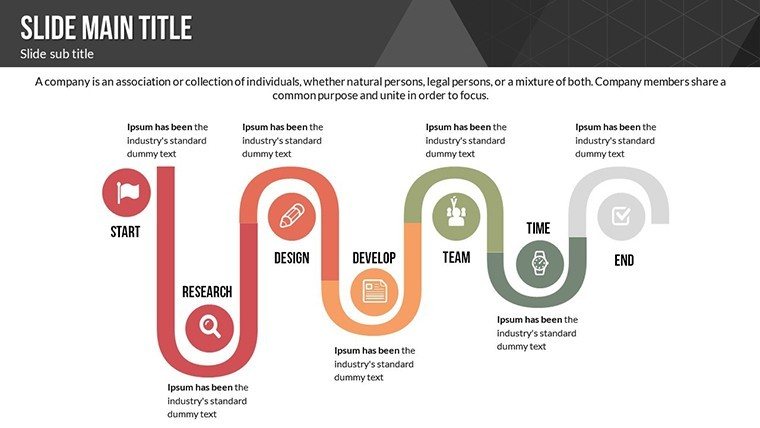
Step-by-Step Quality Presentation Build
- Launch the template in PowerPoint.
- Select a chart type for your metric, e.g., histogram for distribution.
- Input data and customize axes for clarity.
- Add annotations for key insights.
- Review for accuracy before delivery.
This resolves issues like inconsistent formatting in team collaborations.
Elevating Standards with Superior Tools
Unlike generic charts, this template incorporates quality frameworks, offering value through reliability and depth. For example, in healthcare QA, map patient safety metrics, aligned with JCAHO standards. Tips: Use conditional formatting for alerts or layer with fishbone diagrams for root causes. Subtle CTAs like "Implement these controls" guide actions. Conclude presentations with a quality roadmap slide, inspiring commitment. Transform your quality narratives - secure this template and achieve excellence now.
Frequently Asked Questions
How precise are the data representations?
Designed for accuracy, with scalable axes and clear metrics to ensure reliable visuals.
Can it handle complex quality metrics?
Yes, supports various charts for detailed analysis like control limits.
Who benefits most from this template?
QA pros, managers, and educators in quality-focused fields.
Is customization beginner-friendly?
Absolutely, intuitive edits require no advanced skills.
What file format is provided?
.pptx for easy PowerPoint compatibility.
Does it include animation options?
Yes, for dynamic reveals of quality trends.