Graphs of Economic Indicators PowerPoint Charts: Navigating Architectural Financials


Type: PowerPoint Charts template
Category: Relationship
Sources Available: .pptx
Product ID: PC00541
Template incl.: 22 editable slides
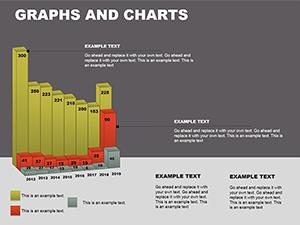
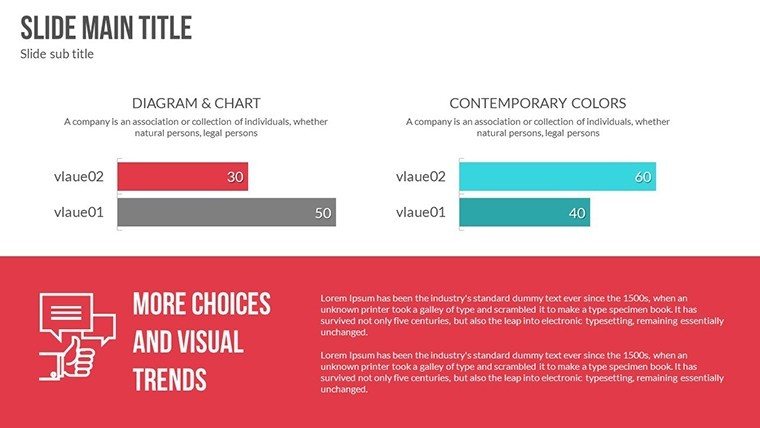
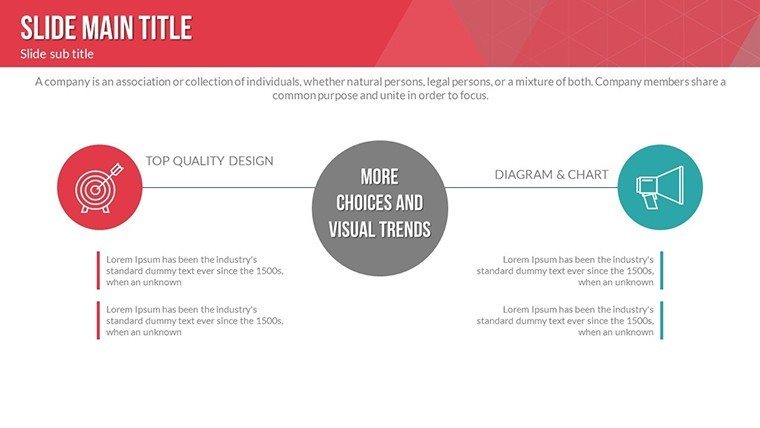
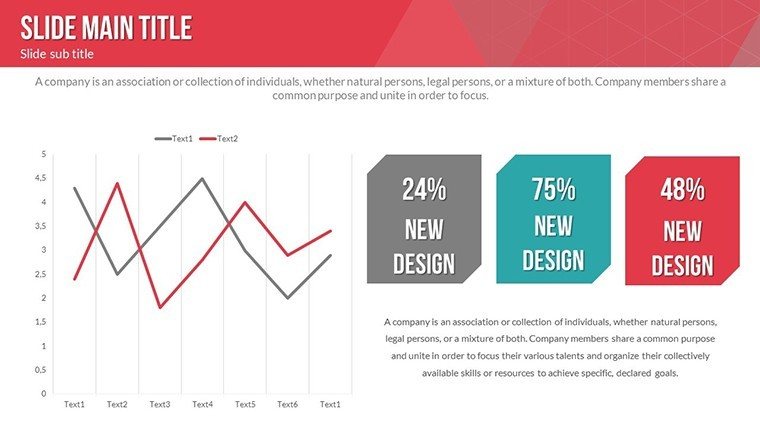
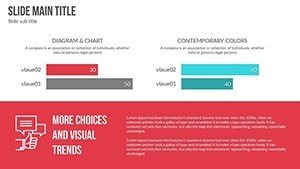
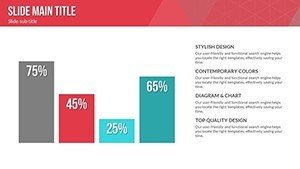
In architecture, where budgets dictate feasibility, graphing economic indicators is crucial for informed decisions. This 22-slide template equips you with customizable charts to plot costs, ROI, and market trends, fully editable in PowerPoint with Google Slides support. From material price fluctuations to project ROI forecasts, visualize data that aligns with AIA economic reports. At $17 (or free with promo), it's inspired by cost analyses in projects like the Guggenheim Bilbao, helping architects balance creativity with fiscal reality. Enhance your proposals with professional visuals that build trust and drive approvals.
Enhancing Financial Clarity in Designs
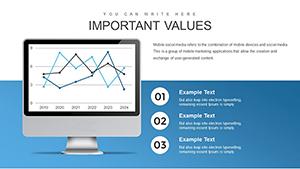
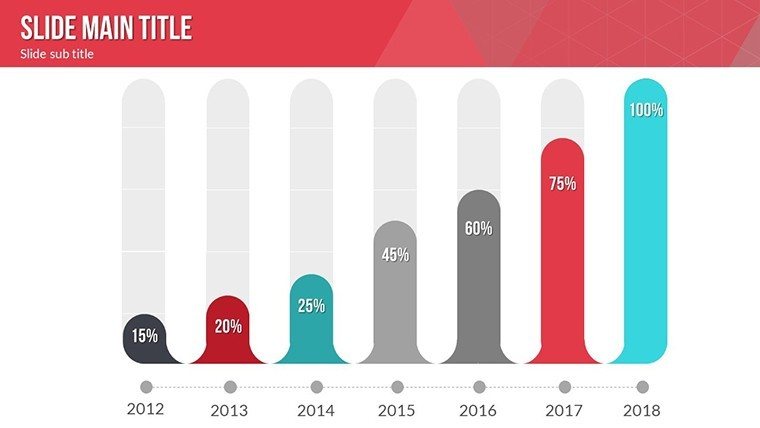
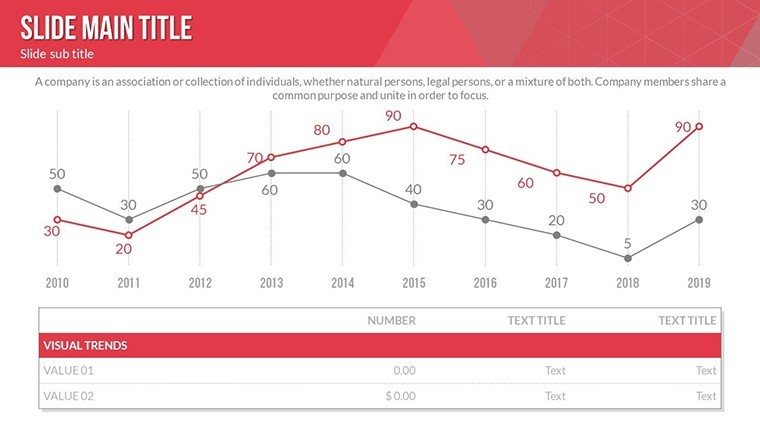
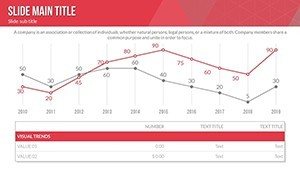
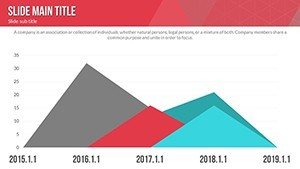
Showcase trends like inflation impacts on construction with line graphs. A Seattle firm used similar for green building economics, gaining grants.
Customization options abound: Modify scales for precision, styles for branding.
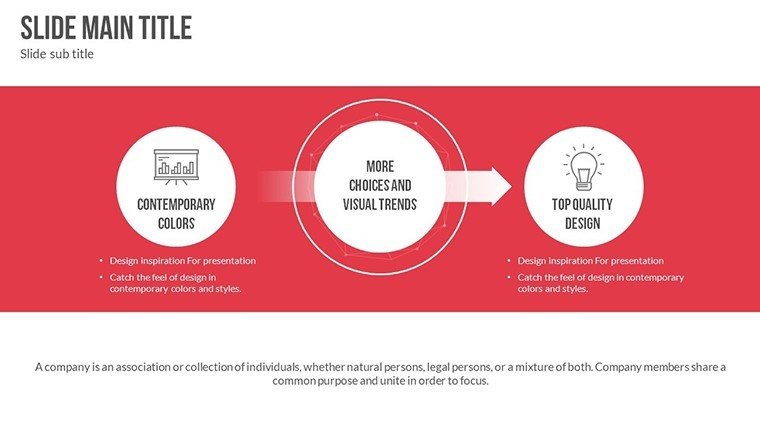
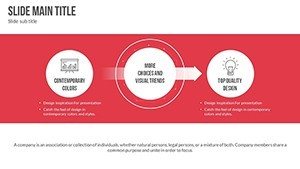
Core Features for Economic Mastery
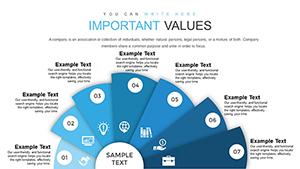
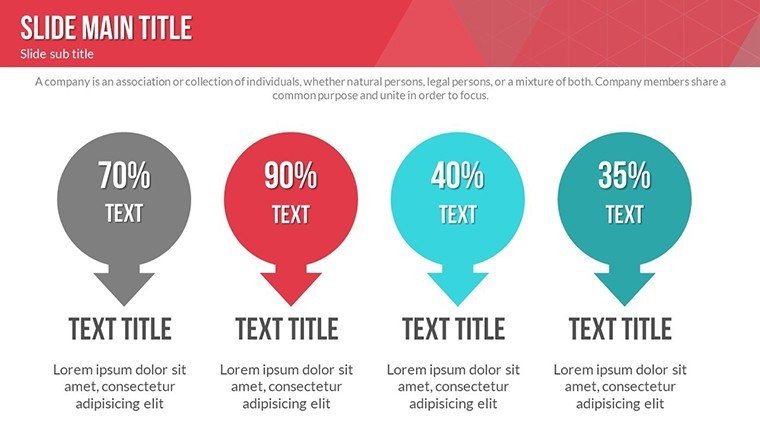
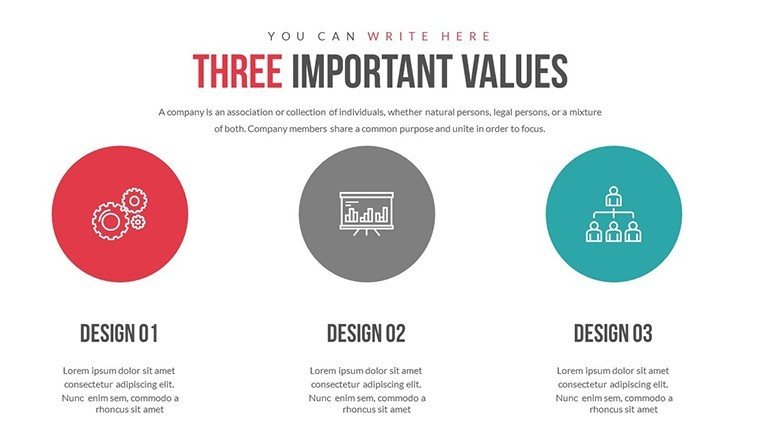
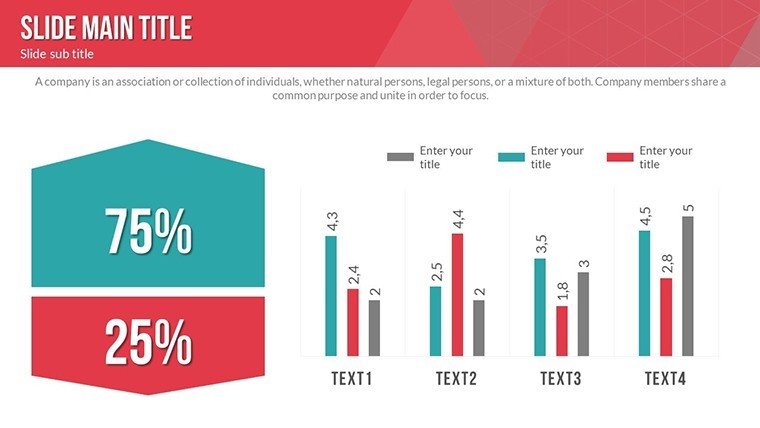
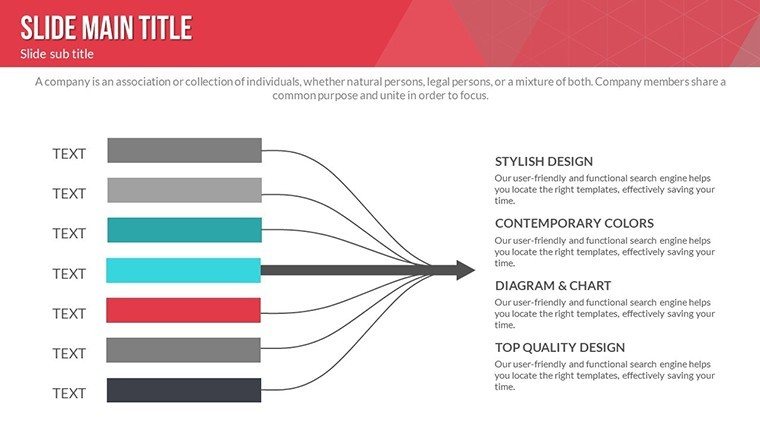
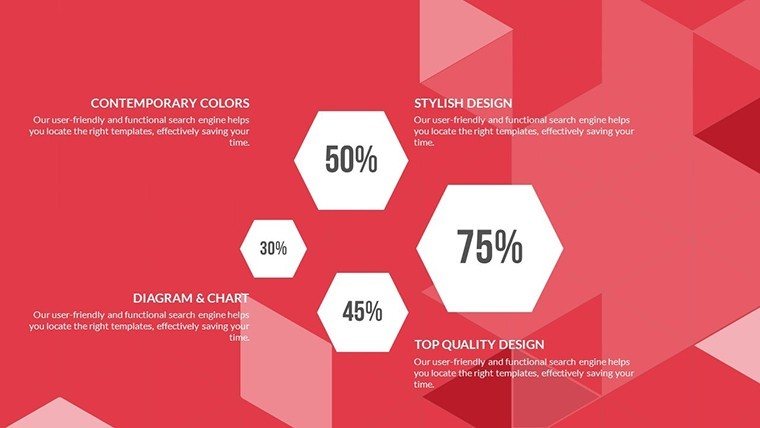
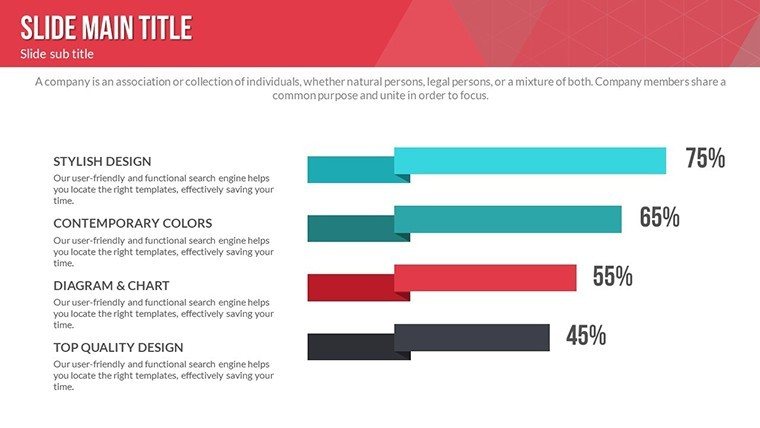
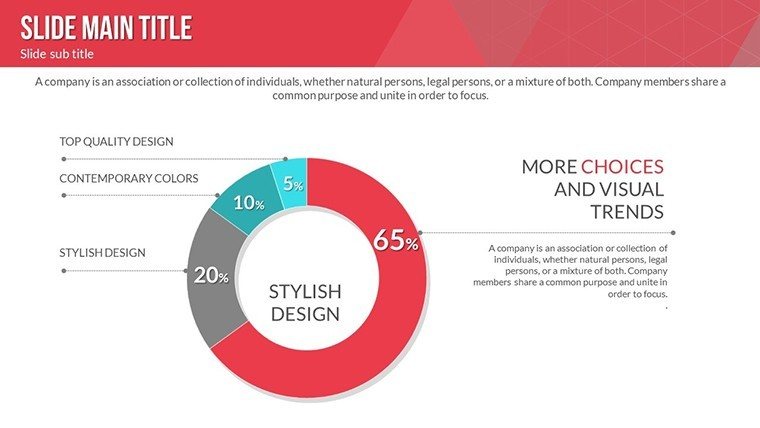
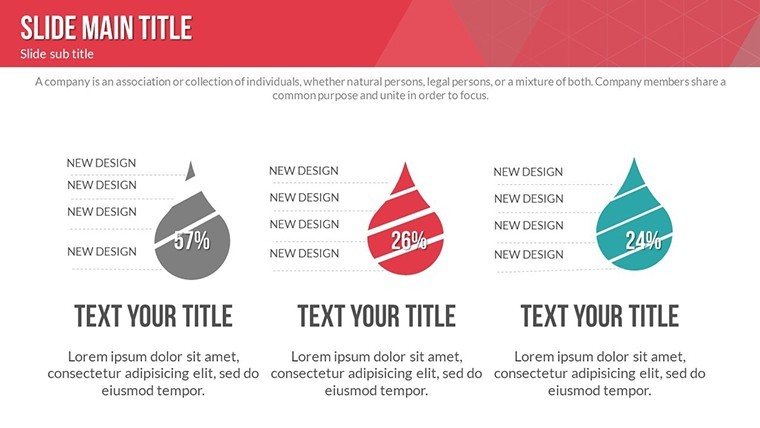
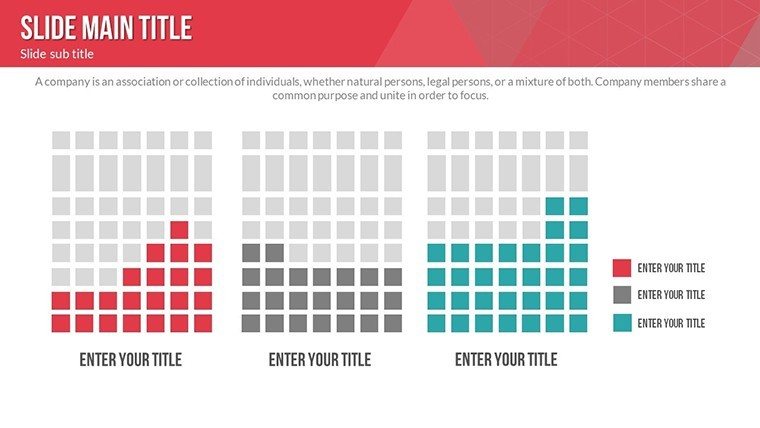
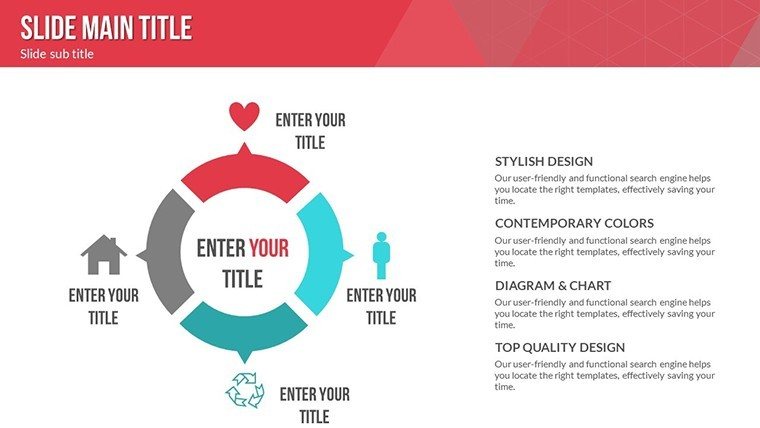
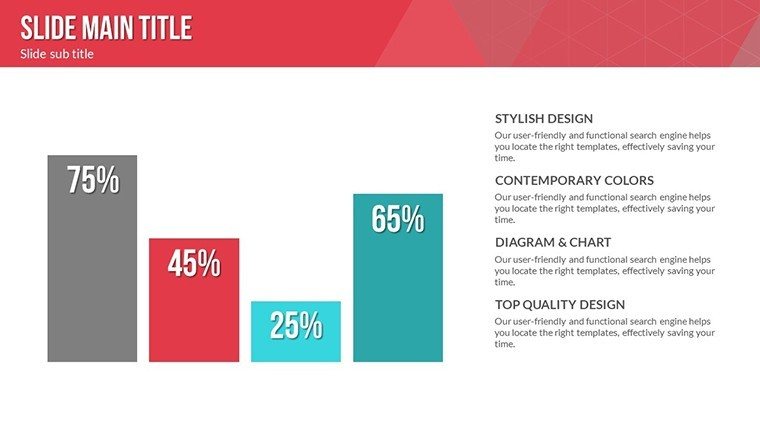
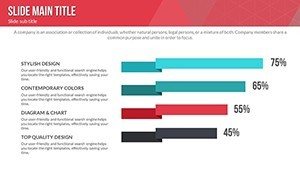
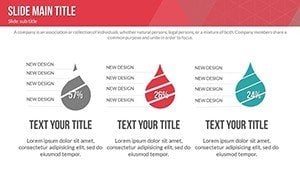
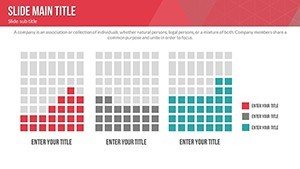
- Varied Graph Types: Bars for comparisons, pies for allocations.
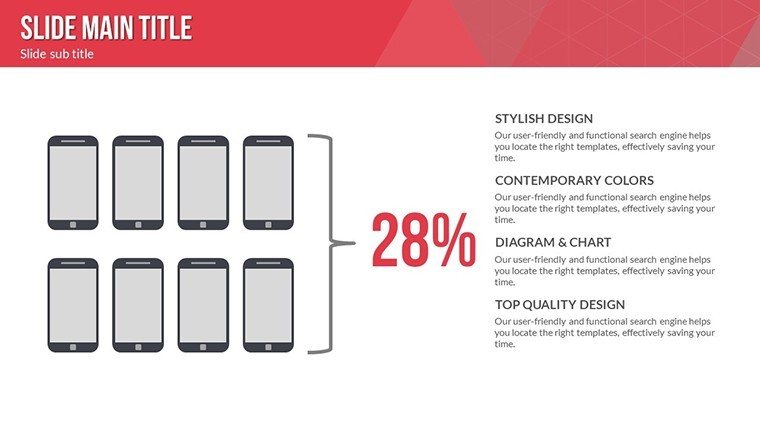
- Style Adaptability: Fonts, sizes for AIA-compliant docs.
- Professional Polish: High-level visuals for executive summaries.
Better than basics, weaves LSI like "cost trend visualizations."
Who Benefits and How to Apply
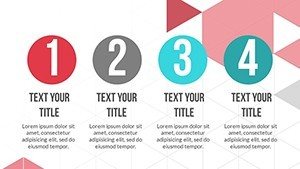
Economists, consultants, educators. Steps: Choose graph, enter data, tweak aesthetics.
Tips for Optimal Use
- Source accurately: Use Fed data for credibility.
- Simplify visuals: Avoid clutter for quick insights.
- Update regularly: For ongoing project monitoring.
In Dubai towers, economic graphs streamlined budgeting.
Why This Template is Indispensable
For fiscal-savvy architects, it's a game-changer.
Download and graph your economic success today.
Frequently Asked Questions
How customizable are the graphs? Fully, from data to design elements.
Google Slides ready? Yes, effortless import.
Free download details? Available with promo code for instant access.
Handles complex data? Yes, multi-series support.