Partnership PowerPoint Charts Template: Forge Lasting Connections


Type: PowerPoint Charts template
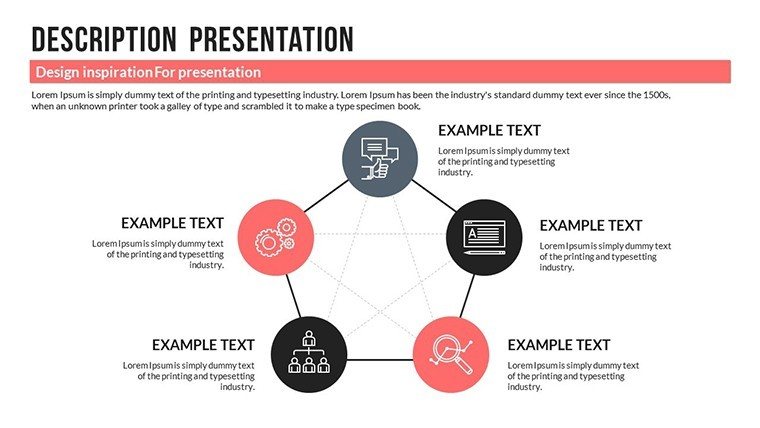
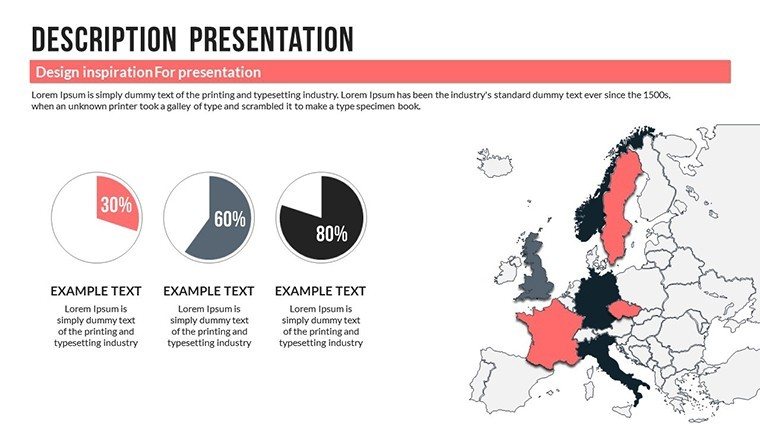
Category: Pie, Organizational
Sources Available: .pptx
Product ID: PC00527
Template incl.: 23 editable slides
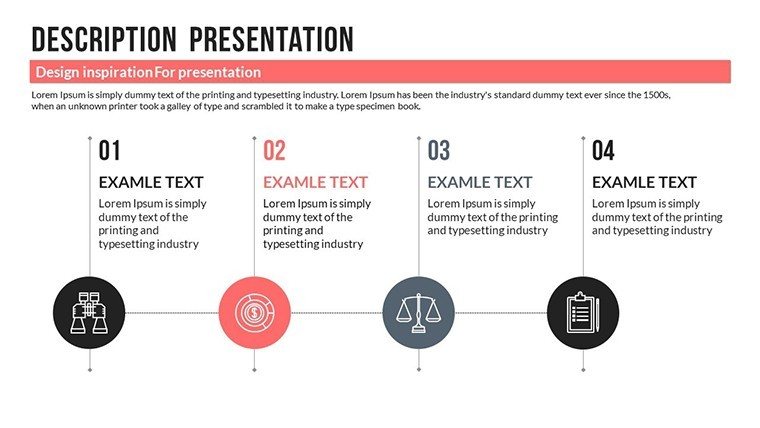
Partnerships are the bedrock of business success, but articulating their value requires more than words - it demands visuals that resonate. Our Partnership PowerPoint Charts Template delivers just that, with 23 editable slides designed to showcase synergies, track progress, and highlight mutual benefits. Ideal for business developers, consultants, and educators, this tool turns partnership data into persuasive stories that build trust and drive alliances.
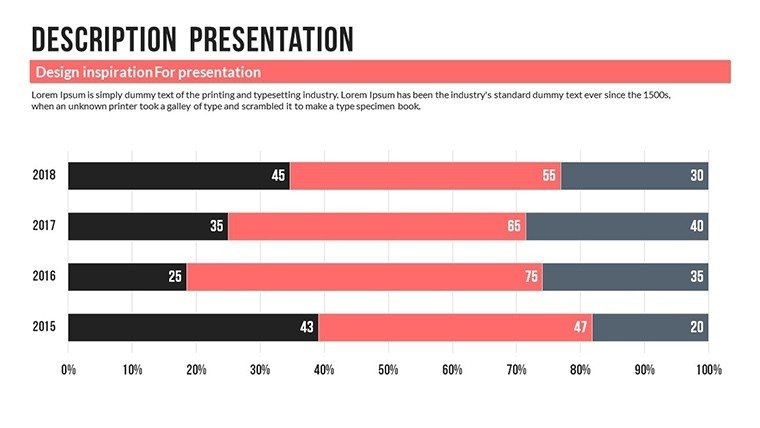
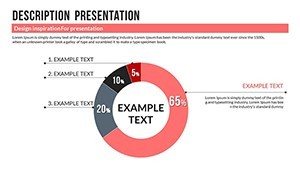
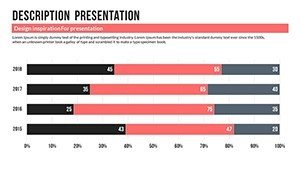
Visualize a bar graph comparing joint venture outcomes or a pie chart dividing revenue shares - elements that make abstract collaborations concrete. In .pptx format, it's ready for quick customizations, helping you craft presentations that foster stronger relationships effortlessly.
Core Features for Collaborative Mastery
This template is engineered for impact, blending aesthetics with utility.
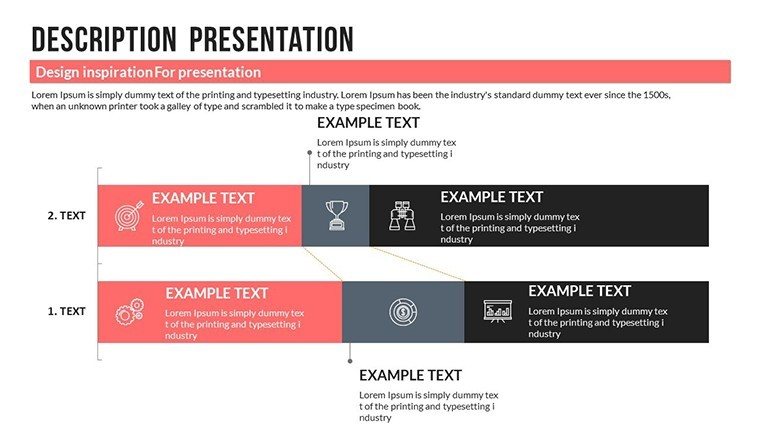
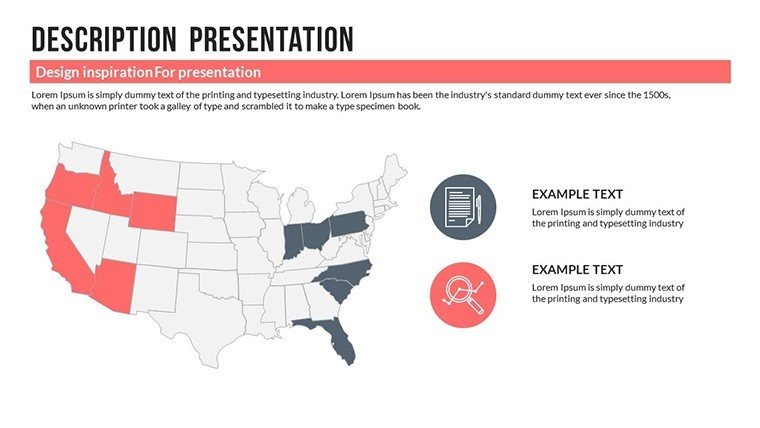
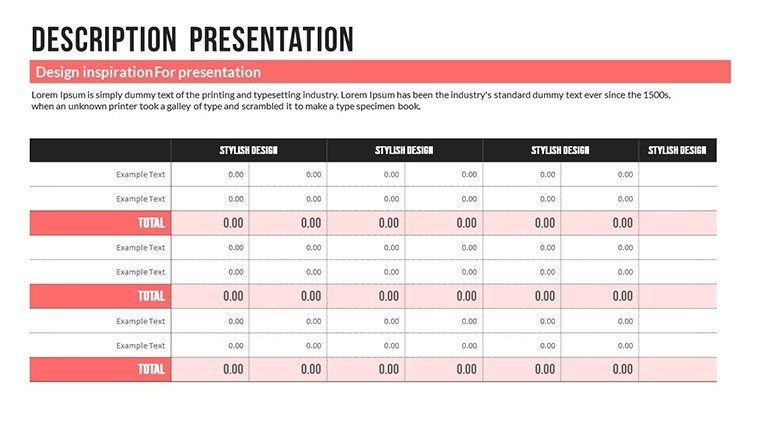
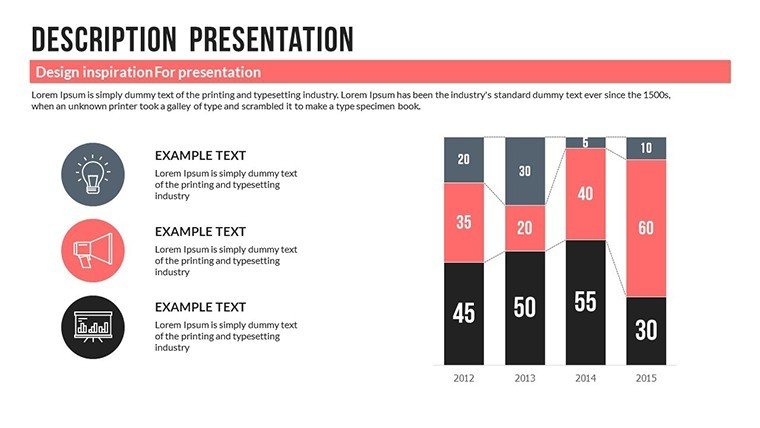
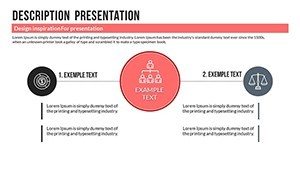
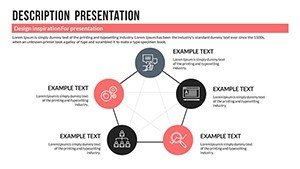
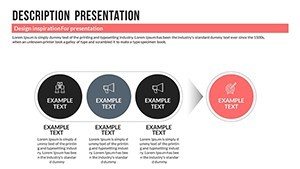
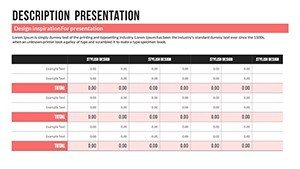
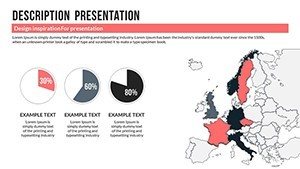
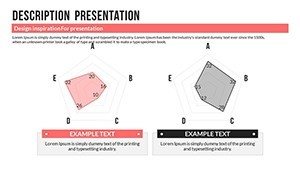
- Dynamic Chart Assortment: Bar and pie charts for quantitative breakdowns, plus organizational maps for structure.
- Tailored Customization: Adjust layouts, colors, and icons to reflect partnership brands seamlessly.
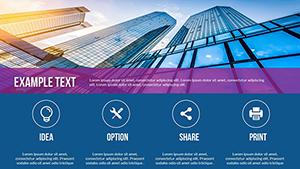
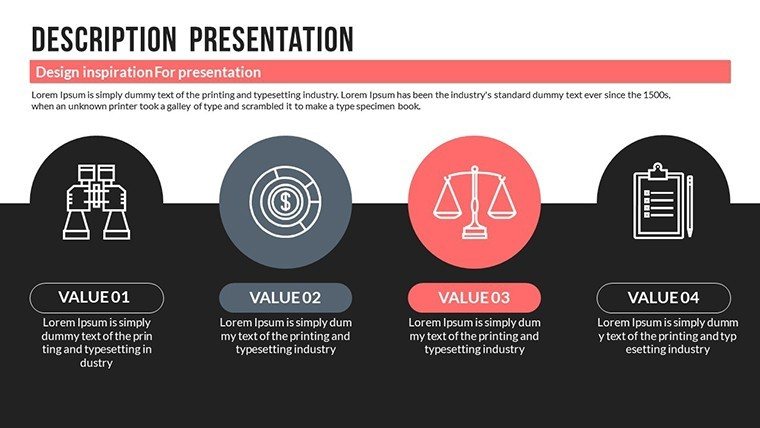
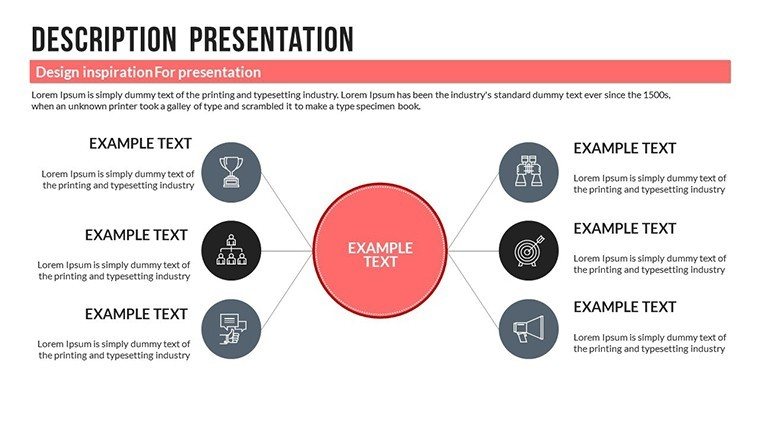
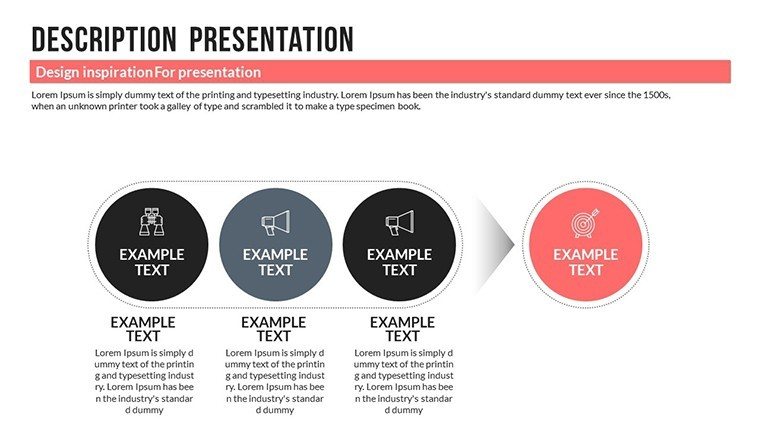
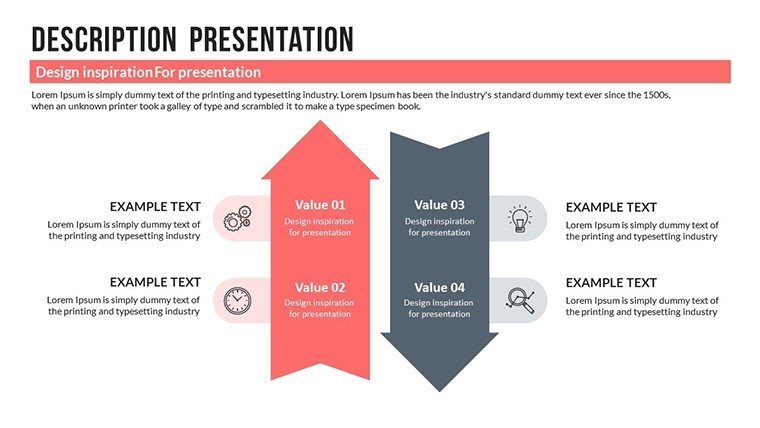
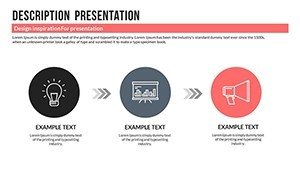
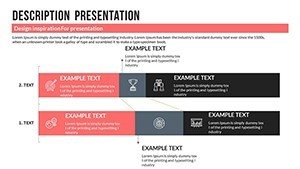
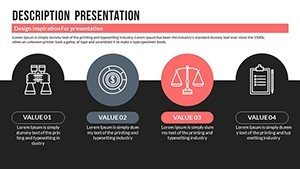
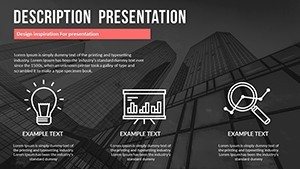
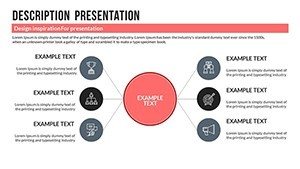
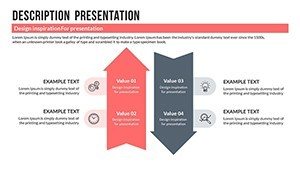
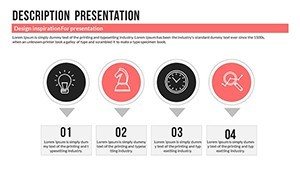
- Engaging Infographics: Simplify complex dynamics with icons and visuals that convey ideas succinctly.
- Designer Quality: Professional touches ensure your slides exude authority and modernity.
Rooted in communication theories like those from McKinsey's partnership frameworks, it prioritizes clarity to avoid misunderstandings in joint endeavors.
Versatile Applications in Partnership Scenarios
Business professionals use it for sales pitches, graphing market trends to attract partners. A tech startup, for example, utilized similar visuals to secure a key alliance, boosting revenue by 30% through demonstrated synergies, echoing Forbes-featured success stories.
Consultants leverage project update slides to monitor milestones, keeping all parties aligned and proactive. Educators employ infographics in training, breaking down collaboration processes for clearer comprehension.
Benefits abound: Time savings from pre-built elements, heightened audience retention through visuals, and stronger engagements that lead to fruitful partnerships.
Comprehensive Slide Overview
Delve into the slides:
- Slides 1-5: Foundation Building: Intro and agenda with partnership overviews.
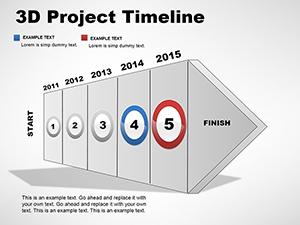
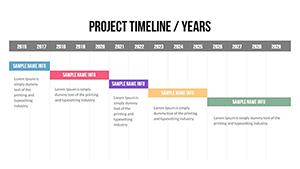
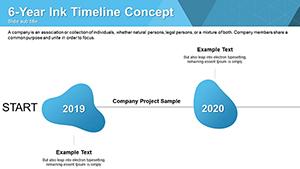
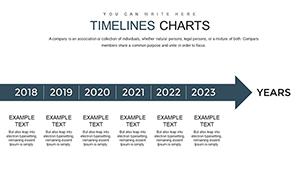
- Slides 6-14: Data Displays: Charts for metrics, benefits, and progress tracking.
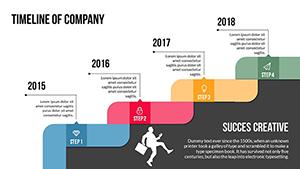
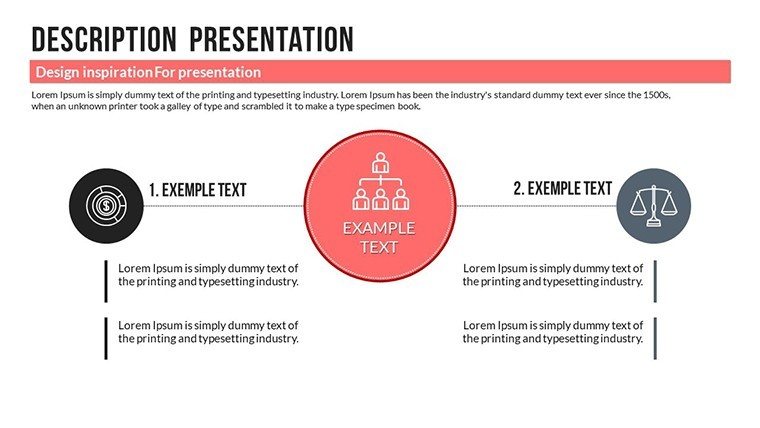
- Slides 15-20: Visual Narratives: Infographics and icons for storytelling.
- Slides 21-23: Closures: Summaries and CTAs for next steps.
Modular for easy expansion or reconfiguration.
Insider Tips for Partnership Success
Leveraging marketing expertise, consider these:
- Story Arc Integration: Structure slides like a narrative - problem, solution, outcome - for compelling flow.
- Brand Harmony: Blend colors from both partners to symbolize unity.
- Interactive Elements: Add hyperlinks to shared docs for collaborative depth.
- Feedback Loops: Use polls in slides to gauge partner input during presentations.
A consulting example: Enhanced client partnerships via visual roadmaps, reducing misalignment by half.
Build Bridges - Download Now
This Partnership PowerPoint Charts Template is your key to unlocking collaborative potential. Don't just talk partnerships - visualize them to life.
Strengthen your alliances - customize this template today and watch relationships thrive.
Frequently Asked Questions
How customizable are the infographics?
Highly - edit icons, texts, and arrangements to suit your narrative.
Compatible with other apps?
Optimized for PowerPoint, but exportable.
Ideal for virtual meetings?
Yes, with clear visuals that shine on screens.
Includes sample content?
Yes, placeholders guide your customizations.
Can I add more charts?
Easily duplicate and modify as needed.
What themes does it support?
Professional and modern, adaptable to any brand.