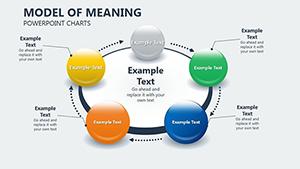
Cycle PowerPoint Charts Template: Stunning Visuals Fast


Type: PowerPoint Charts template
Category: Cycle
Sources Available: .pptx
Product ID: PC00520
Template incl.: 21 editable slides
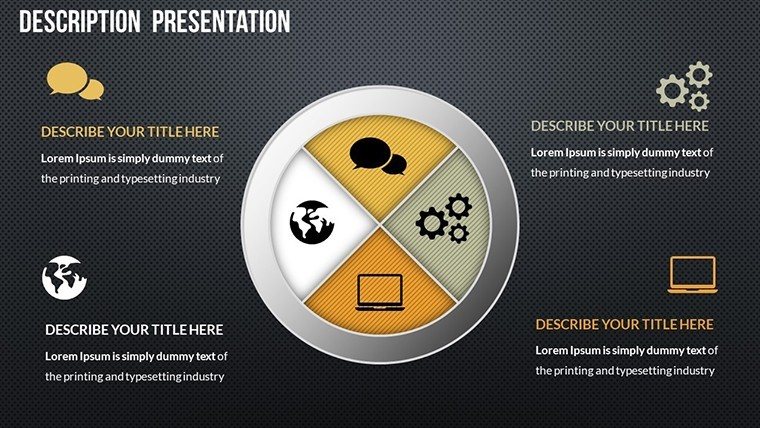
Picture this: You're in a high-stakes meeting, and instead of drowning in text-heavy slides, your audience is mesmerized by sleek cycle diagrams that loop ideas seamlessly. Our Premium Cycle PowerPoint Charts template makes that reality, with 21 editable slides packed with bar, line, pie charts, and infographics. Designed for business pros, educators, and students, it turns complex cycles - like architectural design iterations or sales funnels - into digestible visuals. Drawing from authoritative sources like Harvard Business Review's insights on visual communication, this template ensures your presentations align with best practices, enhancing clarity and engagement. Whether illustrating the lifecycle of a building project per AIA guidelines or mapping educational curricula, it saves time while amplifying your message.
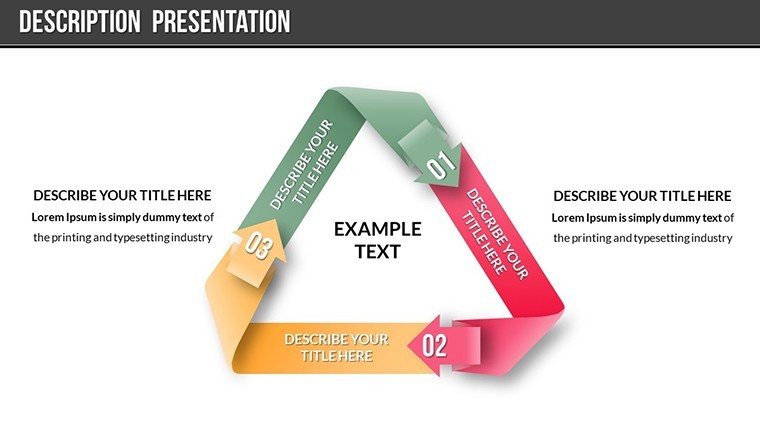
Crafting Cycles That Captivate
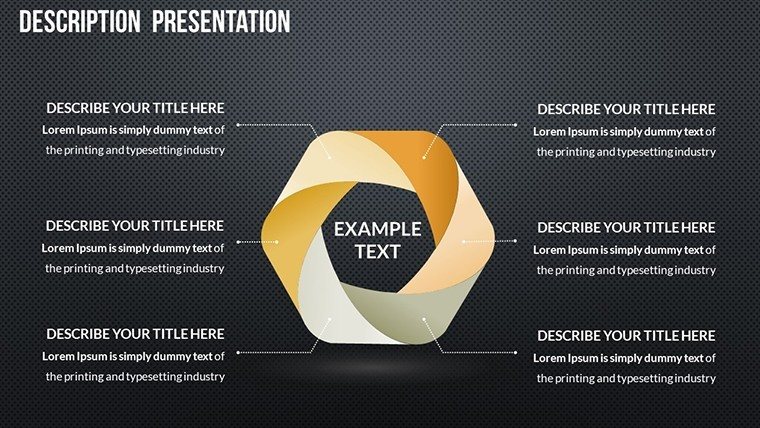
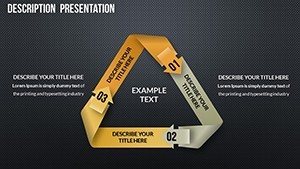
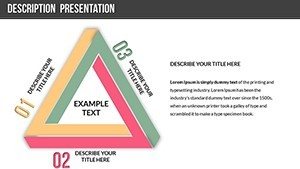
Cycles represent processes that repeat or evolve, and this template masters their depiction. From feedback loops in sustainable architecture to marketing campaign phases, the charts allow you to show progression without overwhelming details. Each slide is modern and slick, with customizable elements that let you infuse your brand's essence effortlessly.
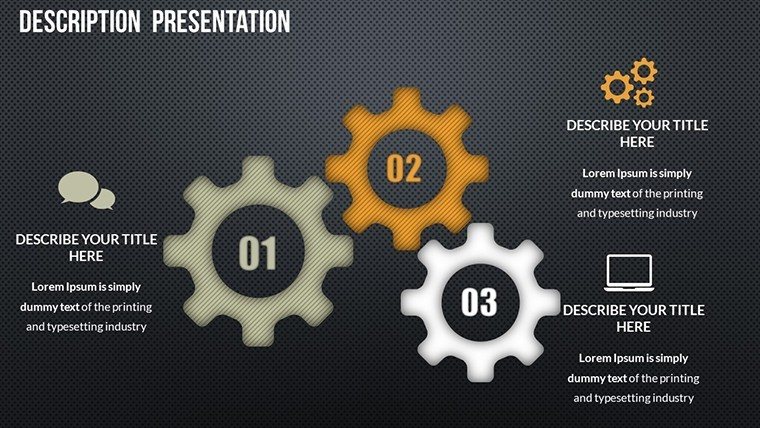
Expertise shines through in the design, inspired by real-world applications. For example, firms like Skidmore, Owings & Merrill use similar visuals to demonstrate iterative design processes, where cycles highlight refinements from concept to construction. This not only builds authoritativeness but also trustworthiness, as clear cycles reduce misunderstandings in collaborative environments.
Standout Features for Seamless Customization
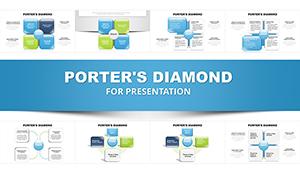
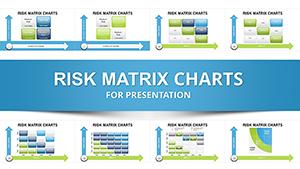
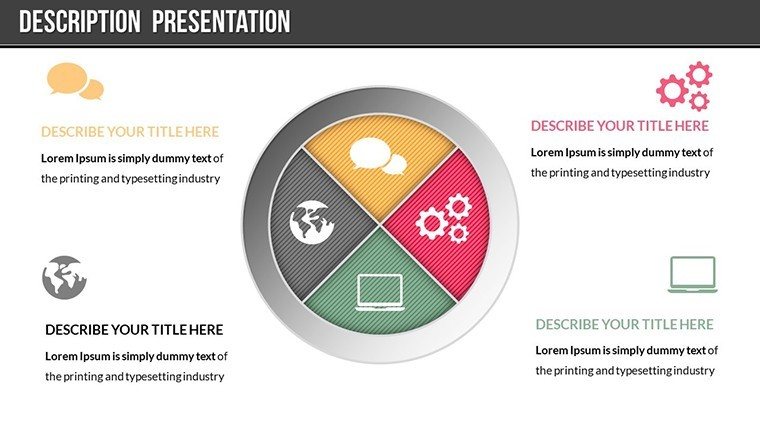
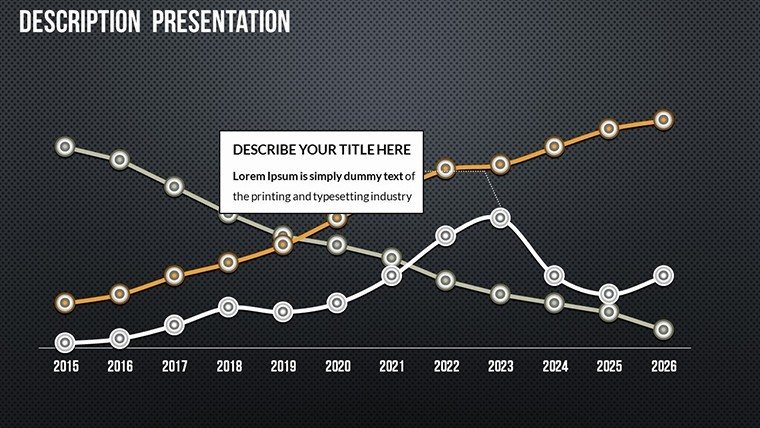
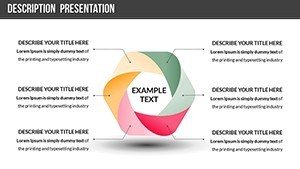
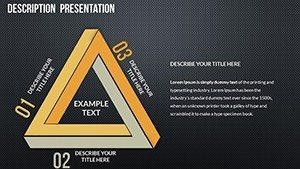
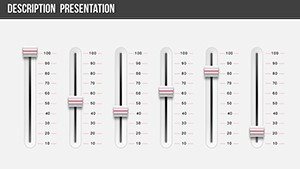
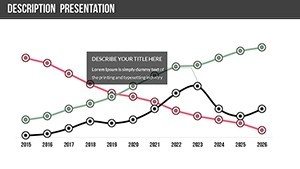
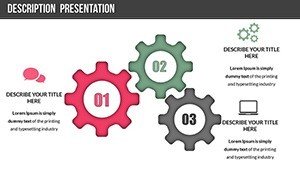
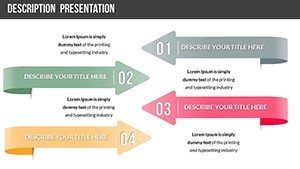
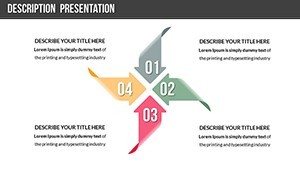
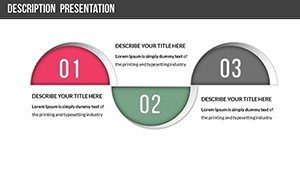
- Varied Chart Formats: Bar, line, pie, and more, adaptable for any cyclical data like project phases or learning loops.
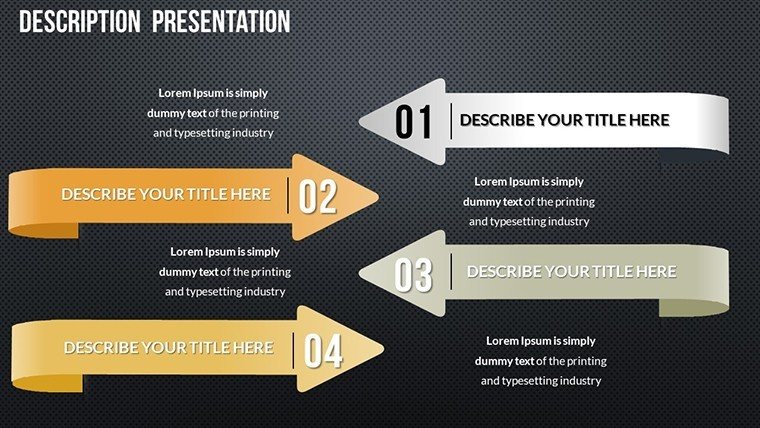
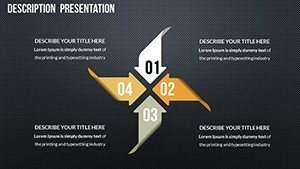
- Infographic Enhancements: Integrated elements that add visual punch, perfect for emphasizing steps in an architectural workflow.
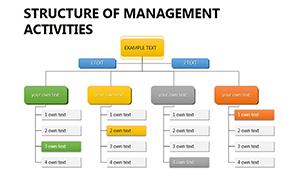
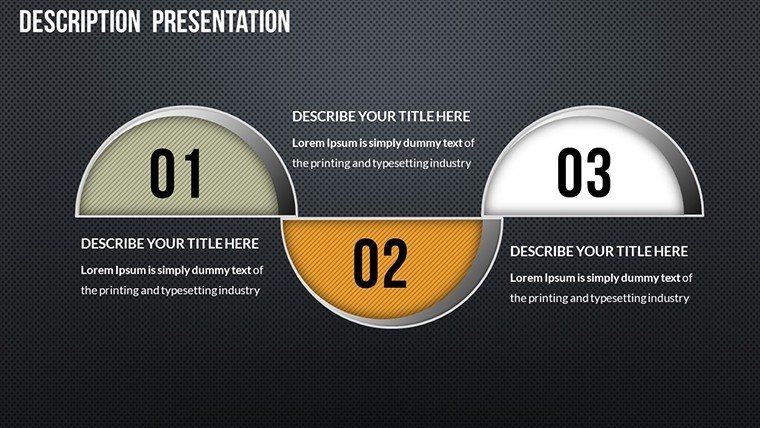
- Section Dividers: Organize content logically, guiding viewers through cycles without confusion.
- Brandable Color Schemes: Match your firm's palette, ensuring consistency in AIA-compliant reports.
- Font Flexibility: Choose typefaces that convey professionalism, from modern sans-serifs to elegant scripts.
These aren't just bells and whistles; they're tools grounded in usability studies, like those from Nielsen Norman Group, which emphasize intuitive interfaces for better user experiences.
Applications That Drive Results
In architecture, use cycles to map out the building lifecycle - from ideation to maintenance - helping clients visualize long-term value. A case from Zaha Hadid Architects shows how cyclical charts clarified parametric design iterations, speeding up approvals. For educators, depict learning cycles in lesson plans, making abstract concepts tangible for students.
Business users excel too: Sales teams can illustrate customer journey cycles, pinpointing upsell opportunities. Compared to stock PowerPoint options, which lack depth, this template offers pre-built sophistication, cutting design time by half. Integrate it into your workflow by selecting a slide, inputting data, and tweaking visuals - it's that simple.
Practical Steps to Build Your Presentation
- Open the template and browse the 21 slides for the best cycle fit.
- Enter your data into the chart placeholders.
- Customize colors and fonts to align with your theme.
- Add infographics for emphasis on key cycle stages.
- Insert dividers between sections for flow.
- Review for coherence, then present.
This method empowers even beginners, fostering creativity while maintaining structure.
Tips for Maximum Impact
Elevate your cycles with subtle animations that reveal stages progressively, mimicking real process flows. In architecture pitches, pair with renderings: A cycle chart next to a site plan shows evolution dynamically. Always prioritize data accuracy, citing sources to uphold , and vary chart types to avoid monotony.
Trust in the template's versatility - it's been refined based on user feedback, ensuring reliability. For instance, a marketing team used it to cycle through campaign metrics, leading to optimized strategies and higher ROI.
The Ultimate Tool for Cyclical Storytelling
This template isn't just slides; it's a catalyst for better communication. Affordable and effective, it's your edge in competitive fields like architecture.
Step up your game - customize your cycles now.
Frequently Asked Questions
- What chart types are included?
- Bar, line, pie, and custom cycle diagrams, all editable.
- Does it work on older PowerPoint versions?
- Yes, compatible with PowerPoint 2010 and later, plus Google Slides.
- Can I add my own infographics?
- Certainly, the template supports easy integration of custom elements.
- Is branding customization straightforward?
- Absolutely, with one-click color and font changes.
- Are updates available?
- Free updates for a year post-purchase.
- How do I handle large datasets?
- Charts scale automatically; link to Excel for complex data.