Timeline PowerPoint Charts - Ready to Present | ImagineLayout


Type: PowerPoint Charts template
Category: Timelines
Sources Available: .pptx
Product ID: PC00514
Template incl.: 28 editable slides
28 Slides Across Layouts: Full Contents
28 slides come included in the PPTX download.
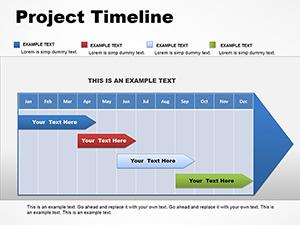
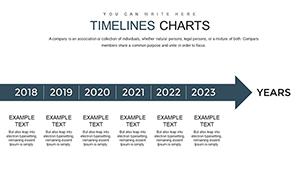
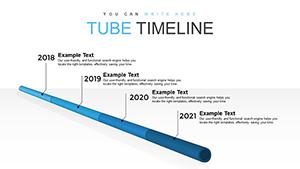
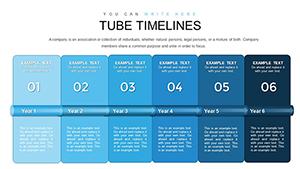
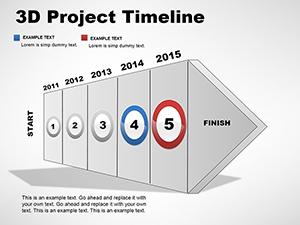
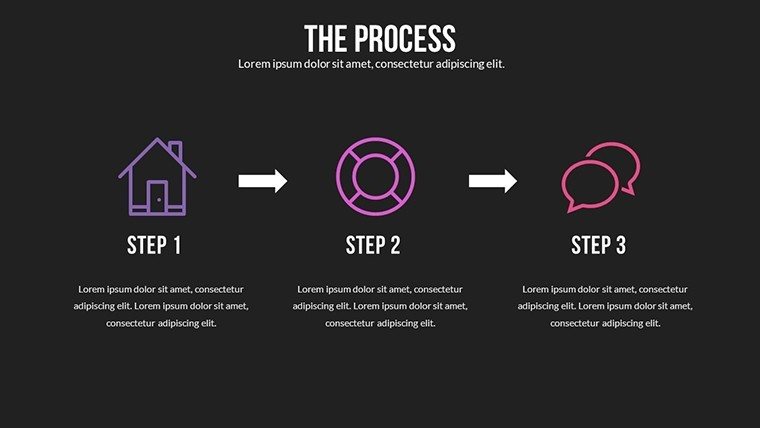
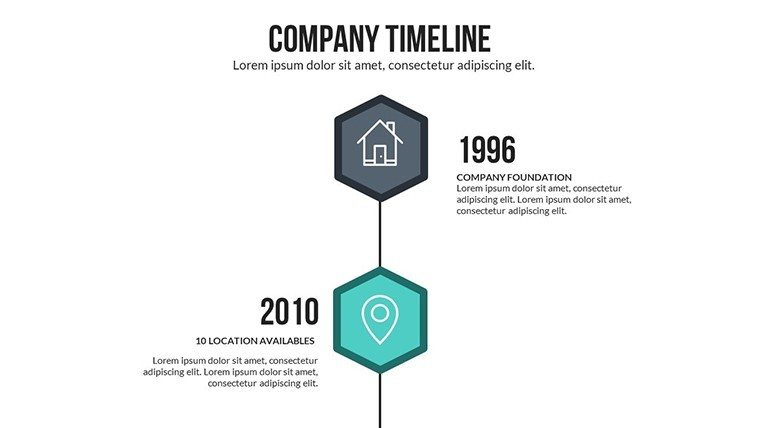
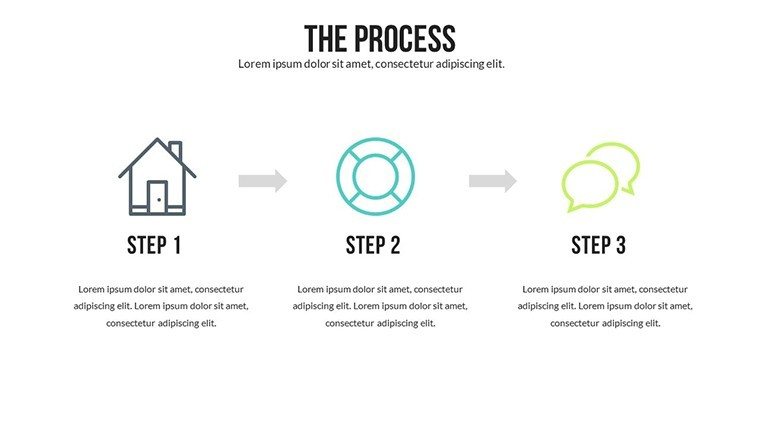
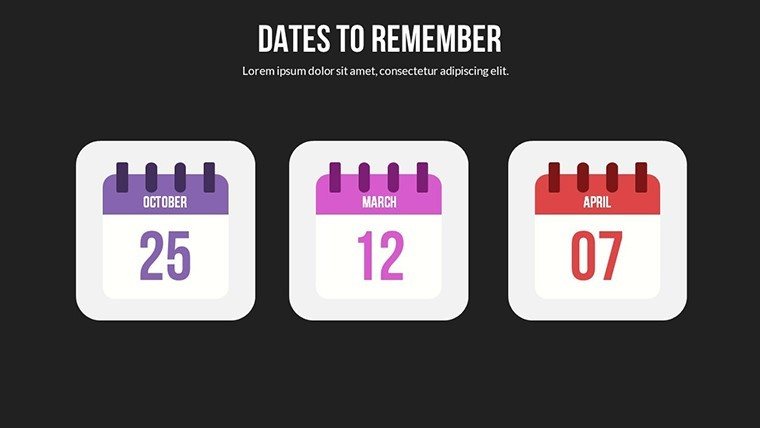
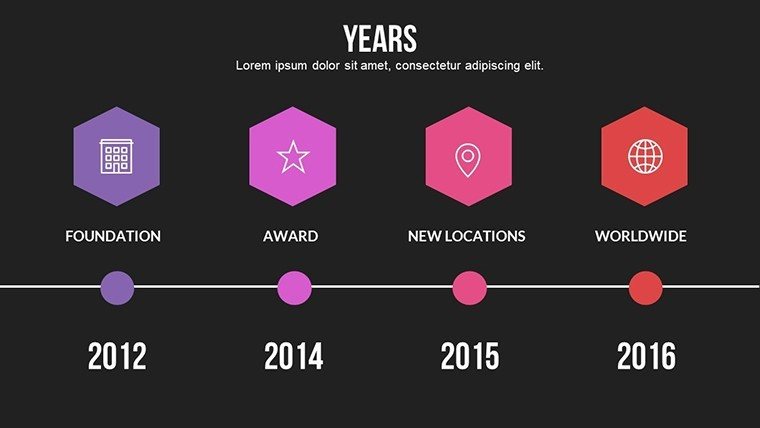
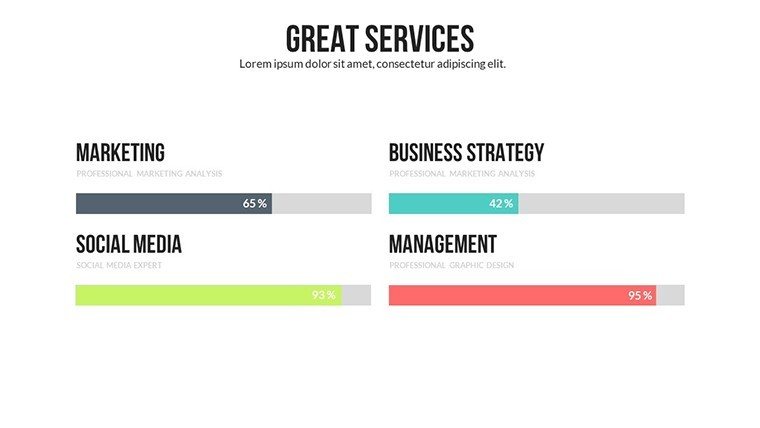
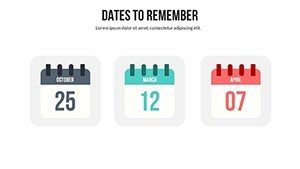
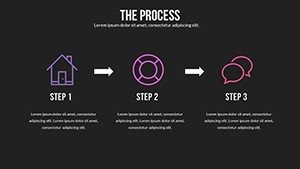
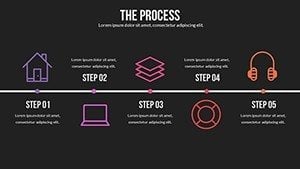
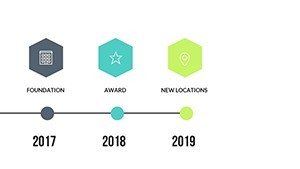
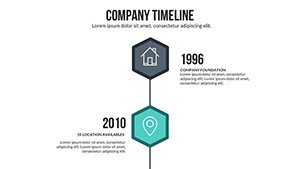
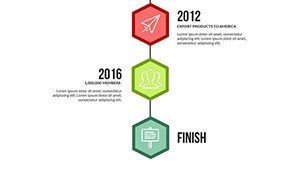
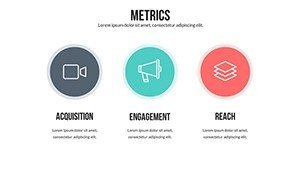
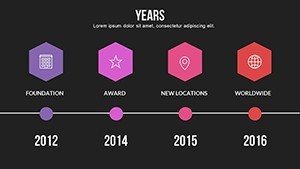
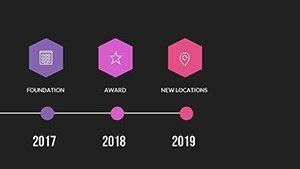
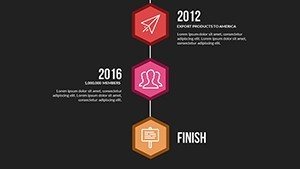
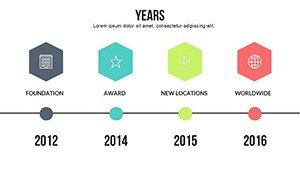
Milestone markers track chronological data.
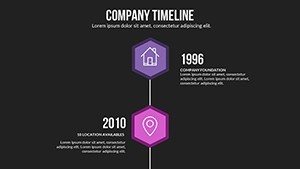
Layouts support narrative flow across time.
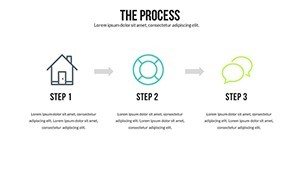
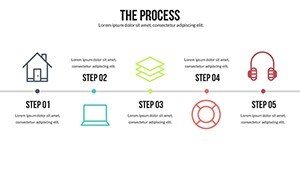
Connectors link events for visual continuity.
Compatibility fits standard PowerPoint use.
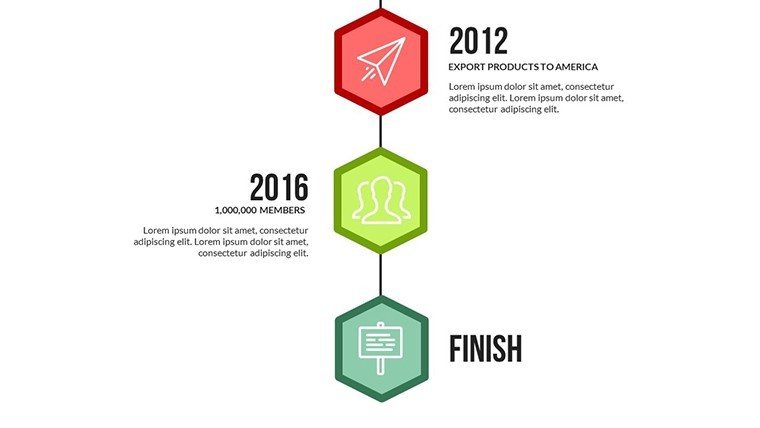
Slides combine for project tracking where milestones build the story.
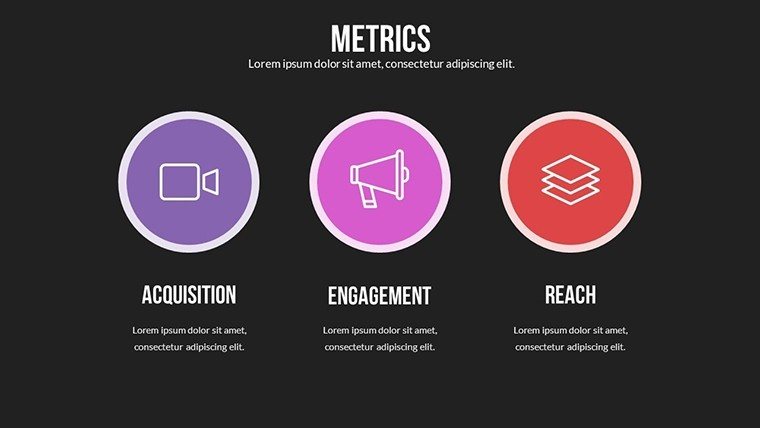
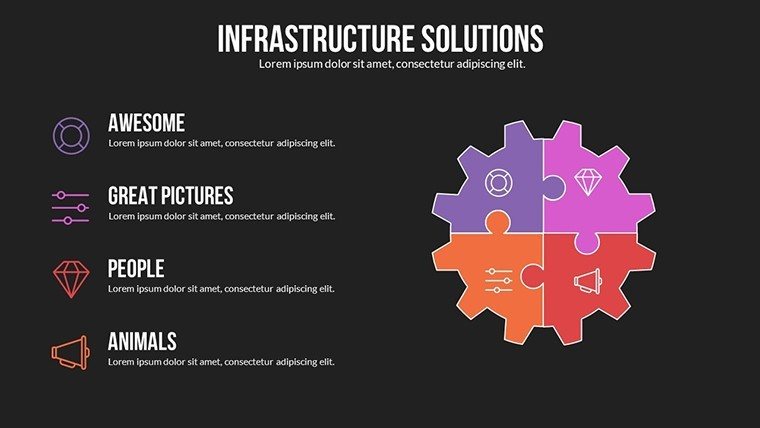
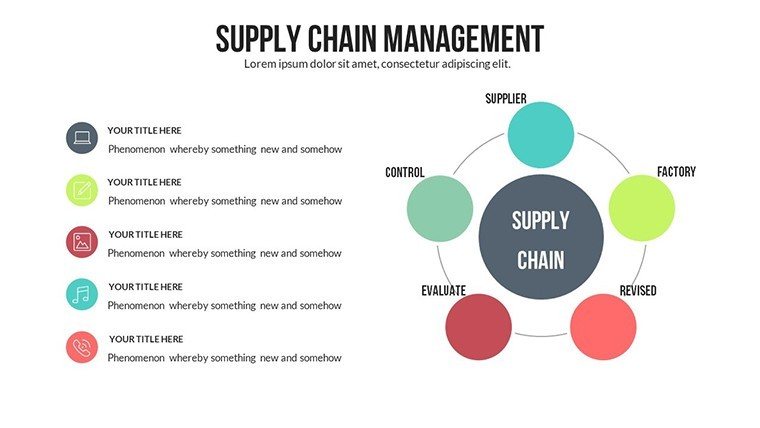
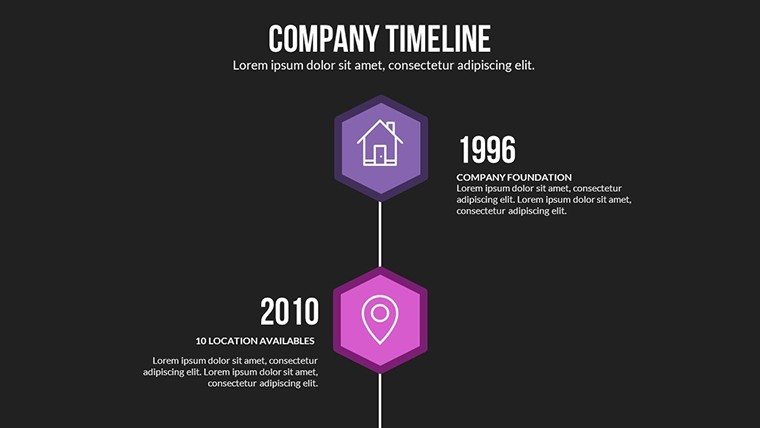
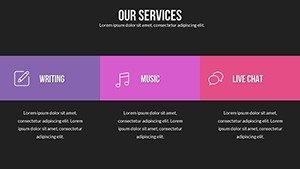
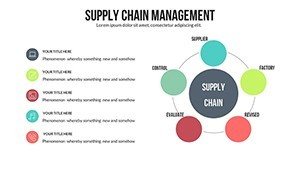
Diagram structure organizes events sequentially.
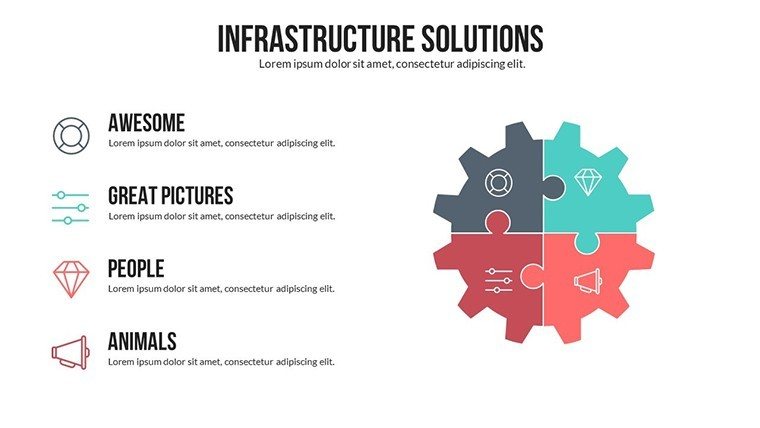
Information spacing separates dates from descriptions.
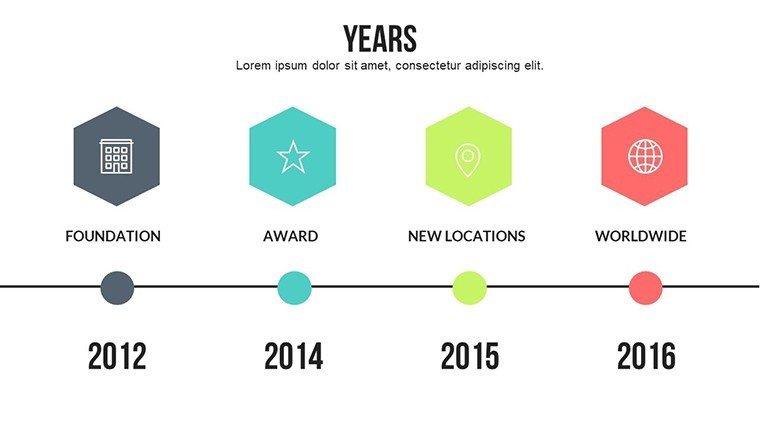
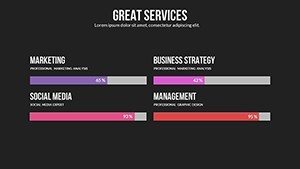
Color contrast highlights phase transitions.
This format enables clear communication in academic lectures.
This set integrates full timeline storytelling unlike the static chart collections elsewhere.
Its marker style uses flow direction rather than isolated 3D effects.
It suits project tracking best because the layout aids sequence perception over neighboring options.
The single purchase covers all 28 editable slides with no separate free tier listed on page.
Format and Compatibility Details
Editing traits define timeline behavior.
Markers reposition without breaking lines.
Text placeholders update event details.
Connectors adjust for new sequences.
Exports cover final distribution needs.
| Feature | Details |
|---|---|
| Editable shapes | milestone markers move independently |
| Text placeholders | labels update without regrouping |
| Color theme adjustments | slide master palette applies |
| Diagram connectors | lines adjustable in direction |
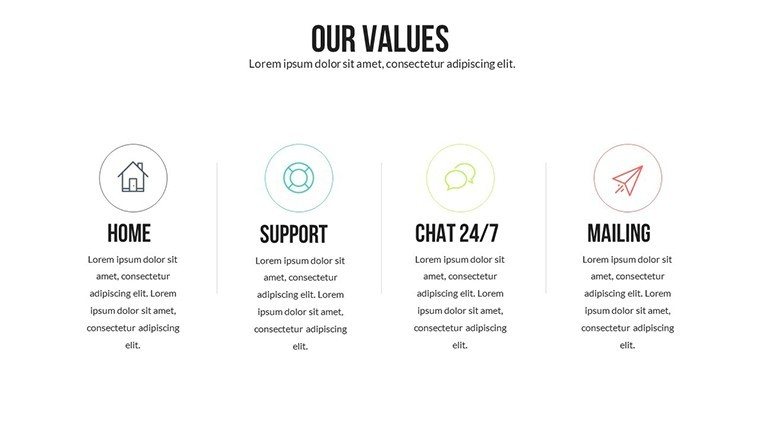
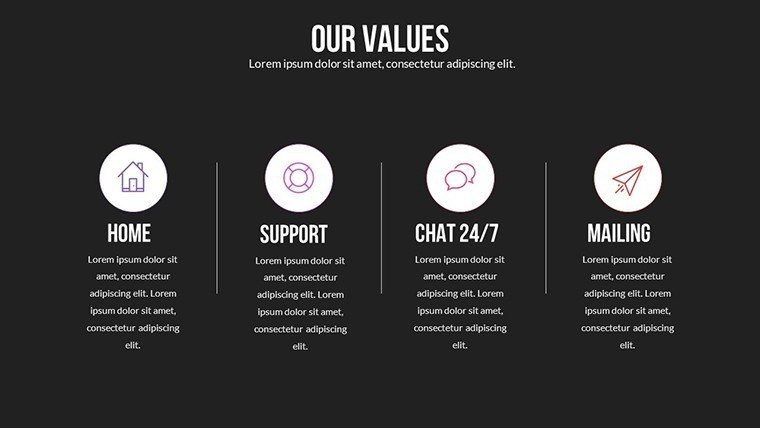
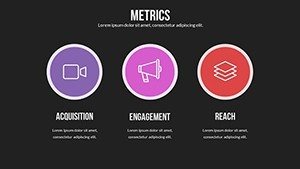
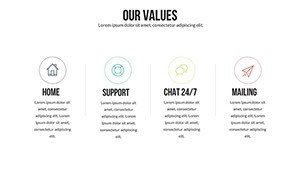
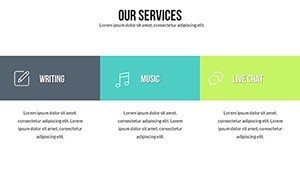
| Icon layers | replaceable without layout change |
| Export options | .pptx PDF supported |
These features speed updates.
Aspect ratio holds at 16:9.
No animation support appears.
Customization in 5 Steps
Customization follows five steps for PPTX files.
Editing difficulty sits at moderate level.
- Open the .pptx file in PowerPoint (1 minute)
- Replace placeholder text (3 minutes)
- Apply brand colors through slide master (2 minutes)
- Adjust milestone connectors (4 minutes)
- Export as PPTX or PDF (1 minute)
Total time stays under 20 minutes.
Markers maintain alignment during edits.
Color theme adjustments affect the full sequence.
Typical Use Cases by Role
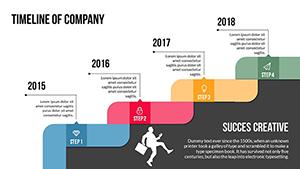
Project managers in construction chart project journeys from blueprint to completion.
This reuses the file across three client reports.
Historians in academia adapt milestones for lectures.
Preparation time falls from 3 hours to 45 minutes.
Business leaders in technology structure quarterly reviews with the same timelines.
Engineers swap color schemes for internal reporting.
Adaptation supports five consecutive briefings.
Download the template and build your timeline story.
Compared to Starting From Zero
Manual timeline creation takes two hours for moderate skill.
Connectors often misalign on projection.
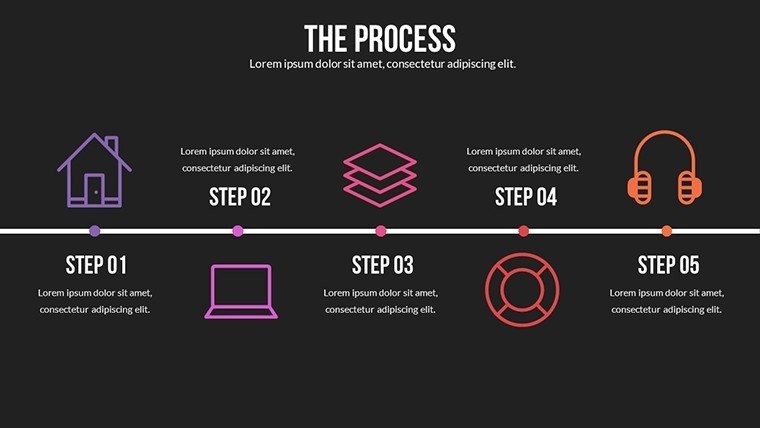
This layout keeps markers outside text zones.
Sequence perception improves without rework.
Visual hierarchy emerges from chronological order.
Zone segmentation clarifies phase boundaries.
Flow direction supports narrative progression.
Teams avoid alignment errors common in blank slides.
Information spacing enhances readability.
Layout composition fits project data structures.
Get the template and tell your timeline story.
Which PowerPoint versions support this file?
The PPTX opens fully in PowerPoint 2016 2019 and Microsoft 365 on Windows and Mac.
Earlier versions may need conversion through online tools.
Slide master adjustments remain available in current releases.
Testing confirms no layout shifts across these editions.
How do I change the color scheme?
Open the slide master view in PowerPoint.
Select the color palette and update theme colors.
Changes apply to all milestones and connectors automatically.
Save the file and the new scheme appears on every slide.
What does the license allow for client work?
Use in internal company presentations and paid client projects is permitted.
Resale or sublicensing of the file itself is not allowed.
Modified versions may appear in client deliverables.
Keep the original file for your own records only.
What file formats are provided?
The download contains a single PPTX file.
No KEY or other formats appear listed.
Export to PDF happens directly from PowerPoint.
Editing stays within the native PPTX environment.
What is the refund policy?
Refunds are available within 14 days if the file fails to open in supported PowerPoint versions.
Contact support with details of the issue.
No refund applies after successful download and use.
The policy covers technical compatibility problems only.