Pictorial PowerPoint Charts - Instant Download | ImagineLayout


Type: PowerPoint Charts template
Category: Illustrations
Sources Available: .pptx
Product ID: PC00511
Template incl.: 20 editable slides
Package Contents
20 slides come included in the PPTX download.
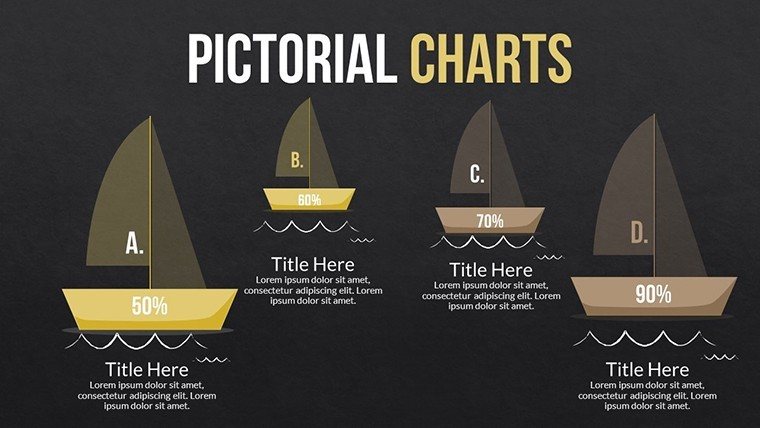
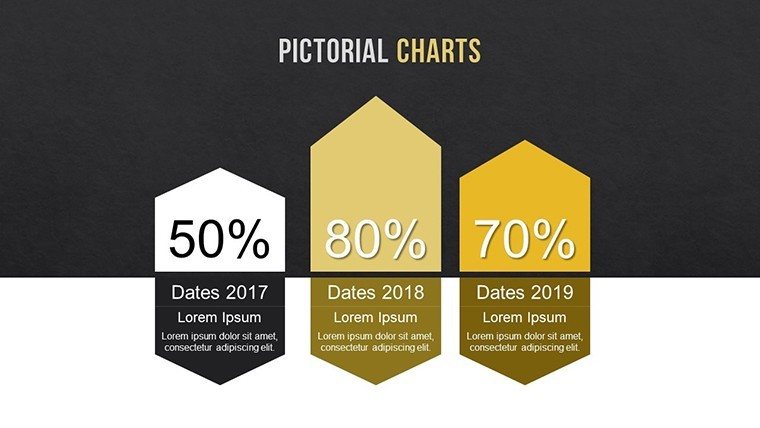
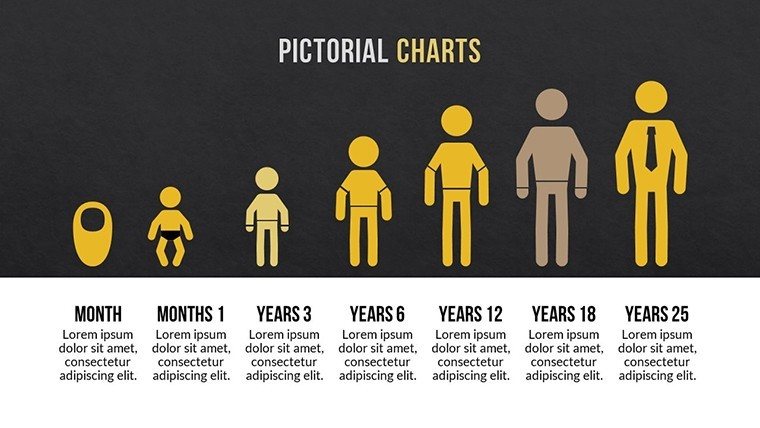
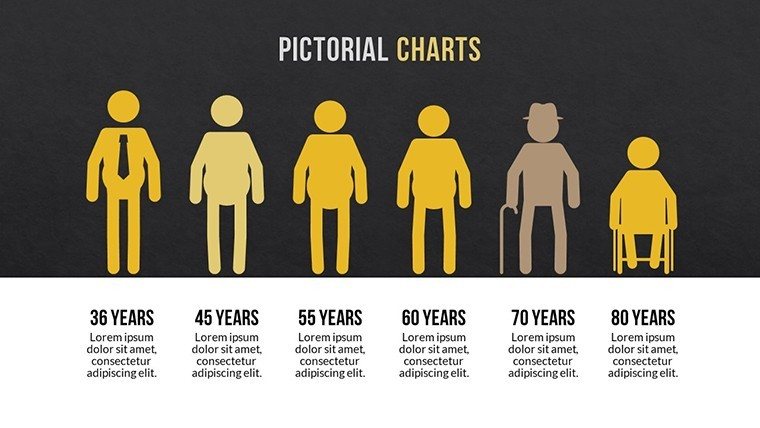
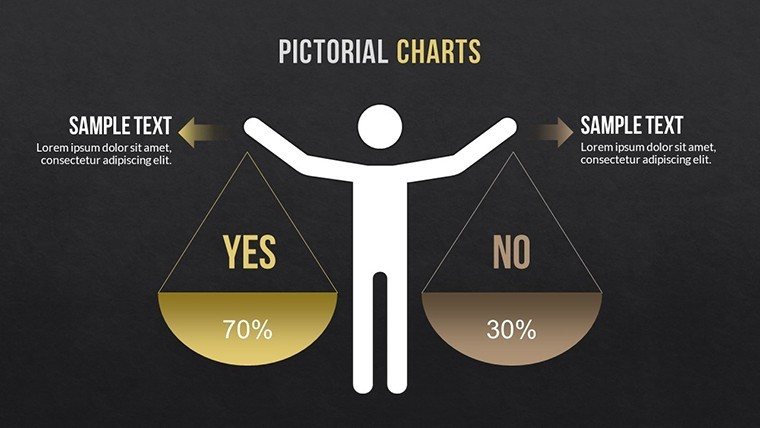
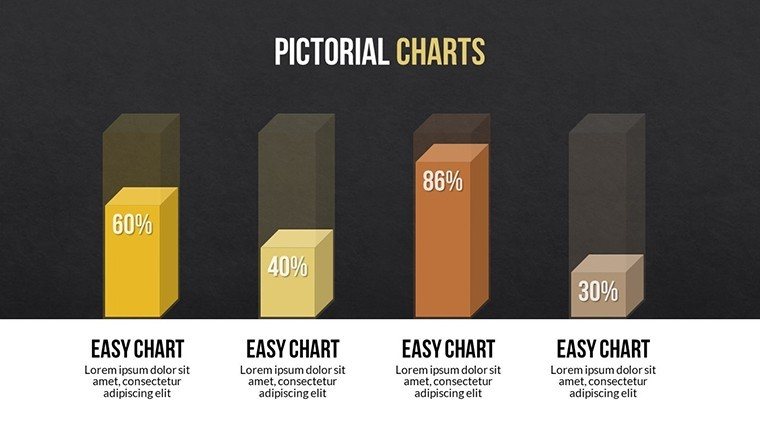
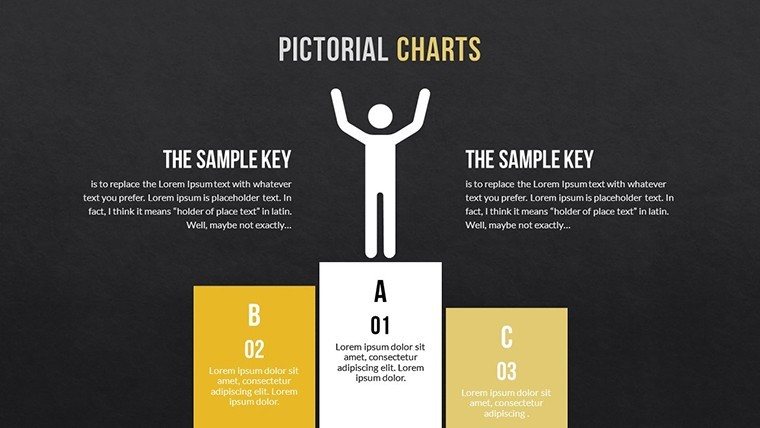
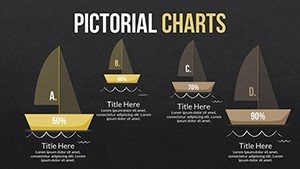
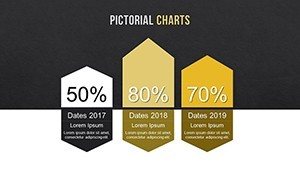
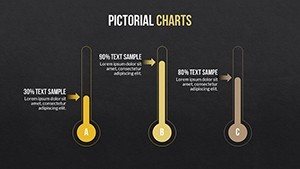
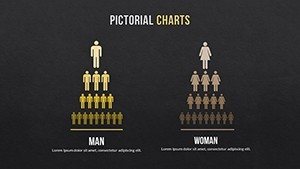
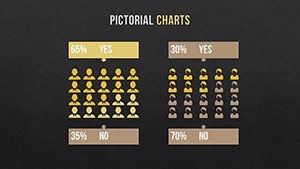
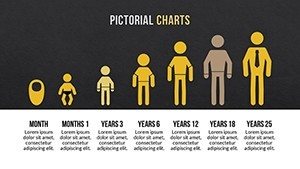
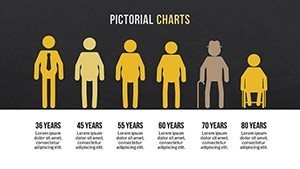
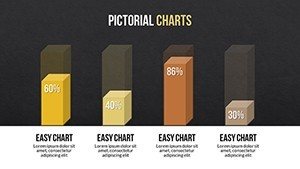
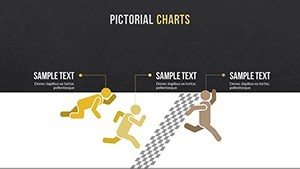
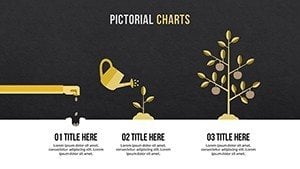
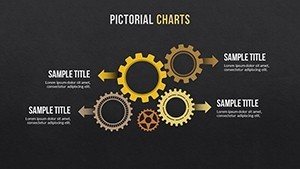
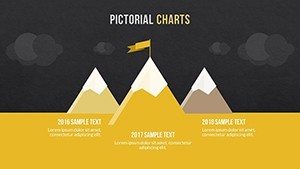
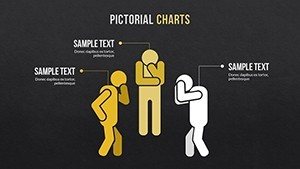
Illustrations pair with data for tangible visuals.
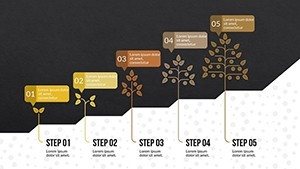
Backgrounds support multiple diagram types.
Color palettes remain flexible for brand adjustments.
File works in standard PowerPoint setups.
Slides integrate for educational sessions where concepts need visual support.
Layout composition uses illustrations to guide attention.
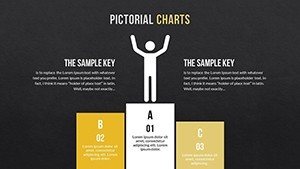
Information spacing separates images from text labels.
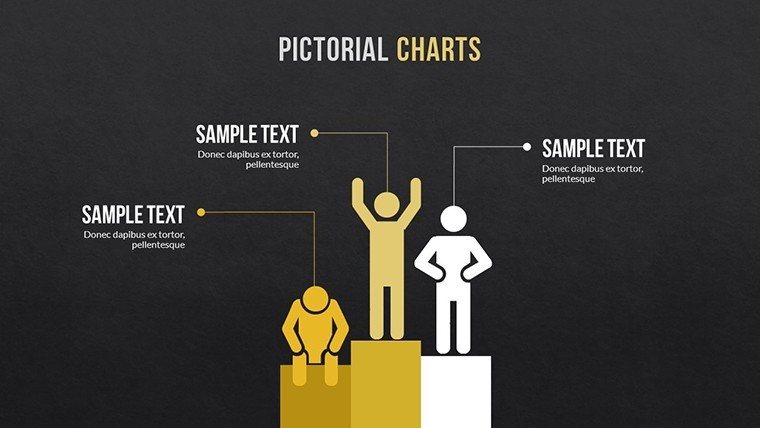
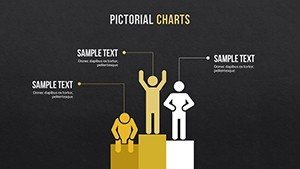
Color contrast highlights key data points.
This structure works well for teams that deliver training sessions.
This set stands apart because it converts abstract data into pictorial elements unlike the single-focus sets common elsewhere.
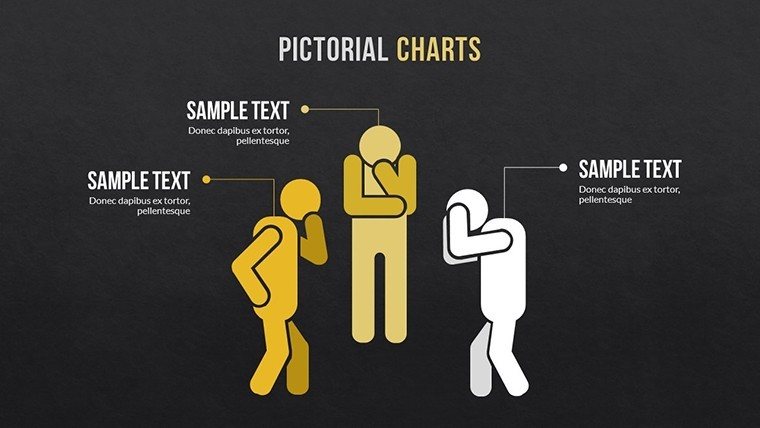
Its illustrative style relies on icon layers rather than flat color count alone.
It suits educational presentations best because the diagram type improves recall over neighboring chart styles.
The single purchase covers the full 20 editable slides with no separate free tier listed on page.
At a Glance
Editing features determine how pictorial elements respond.
Icons replace without layout disruption.
Text placeholders update independently.
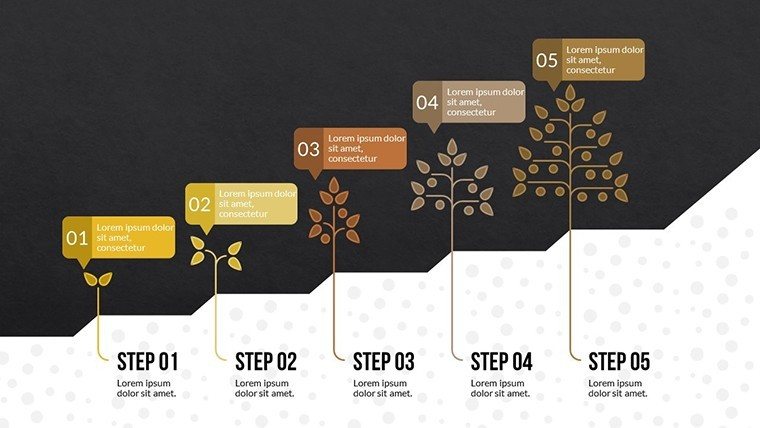
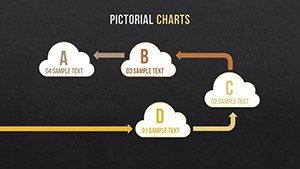
Connectors adapt to new data flows.
Export remains simple for final decks.
| Feature | Details |
|---|---|
| Editable shapes | illustrative segments resize independently |
| Text placeholders | labels update without regrouping |
| Color theme adjustments | apply via slide master palette |
| Diagram connectors | lines adjustable in weight and direction |
| Icon layers | replaceable without layout shift |
| Export options | .pptx and PDF supported |
These options minimize rework.
Aspect ratio holds at 16:9.
No animation is listed.
Adapting the Template to Your Brand
Customization follows five steps for the PPTX format.
Editing difficulty sits at moderate level.
- Open the .pptx file in PowerPoint (1 minute)
- Replace placeholder text (3 minutes)
- Apply brand colors through slide master (2 minutes)
- Adjust illustration labels (4 minutes)
- Export as PPTX or PDF (1 minute)
Total time stays under 20 minutes.
Icon layers update across slides.
Color theme adjustments propagate automatically.
Who Reaches for This Template
Trainers in the education industry explain theories by replacing icons in pictorial slides.
This method reuses the file across five training sessions.
Executives in marketing adapt illustrations for sales presentations.
Preparation time falls from 3 hours to 45 minutes.
Consultants in creative fields structure client workshops with the same visuals.
Project managers swap color schemes for internal reports.
Adaptation supports three consecutive briefings.
Download the template and start editing your pictorial charts today.
Building From Scratch vs. Starting Here
Creating similar slides manually requires two hours for a moderate-skill user.
Illustrations often misalign and lose impact on screens.
This layout keeps icons layered separately from text.
Comprehension improves without added effort.
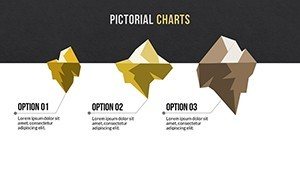
Visual hierarchy emerges from the pictorial arrangement.
Zone segmentation separates concepts clearly.
Flow direction guides the audience naturally.
Teams in business presentations avoid common alignment issues.
Information spacing prevents visual overload.
Layout composition supports dual coding for recall.
Get the template and enhance your next presentation.
Which PowerPoint versions support this file?
The PPTX opens fully in PowerPoint 2016 2019 and Microsoft 365 on Windows and Mac.
Earlier versions may need conversion through online tools.
Slide master adjustments remain available in current releases.
Testing confirms no layout shifts across these editions.
How do I change the color scheme?
Open the slide master view in PowerPoint.
Select the color palette and update theme colors.
Changes apply to all illustrations and text placeholders automatically.
Save the file and the new scheme appears on every slide.
What does the license allow for client work?
Use in internal company presentations and paid client projects is permitted.
Resale or sublicensing of the file itself is not allowed.
Modified versions may appear in client deliverables.
Keep the original file for your own records only.
What file formats are provided?
The download contains a single PPTX file.
No KEY or other formats appear listed.
Export to PDF happens directly from PowerPoint.
Editing stays within the native PPTX environment.
What is the refund policy?
Refunds are available within 14 days if the file fails to open in supported PowerPoint versions.
Contact support with details of the issue.
No refund applies after successful download and use.
The policy covers technical compatibility problems only.