 Click to zoom
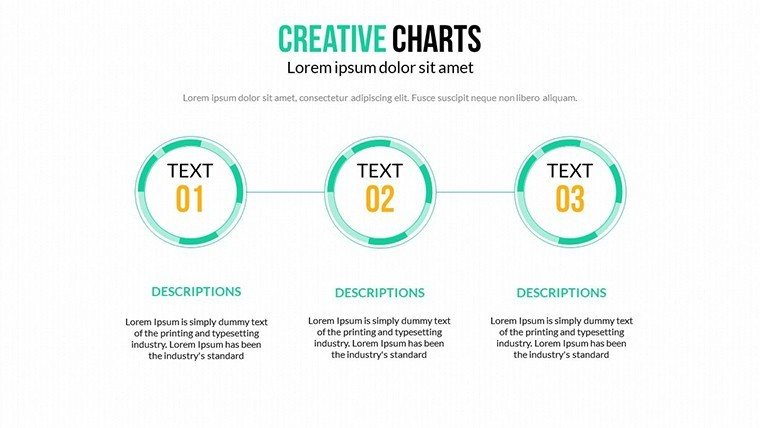
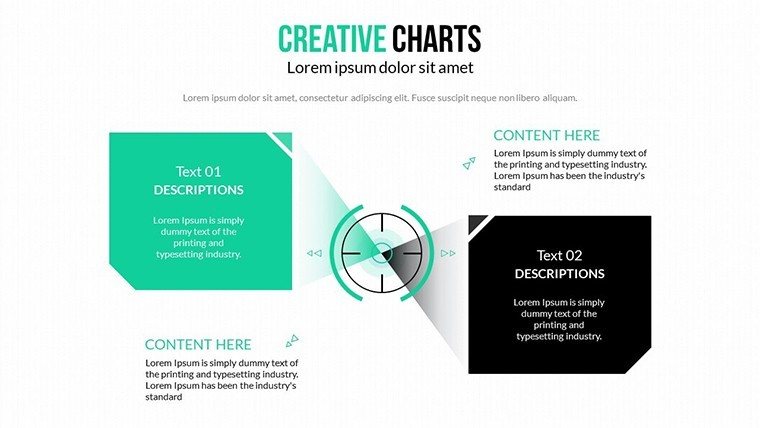
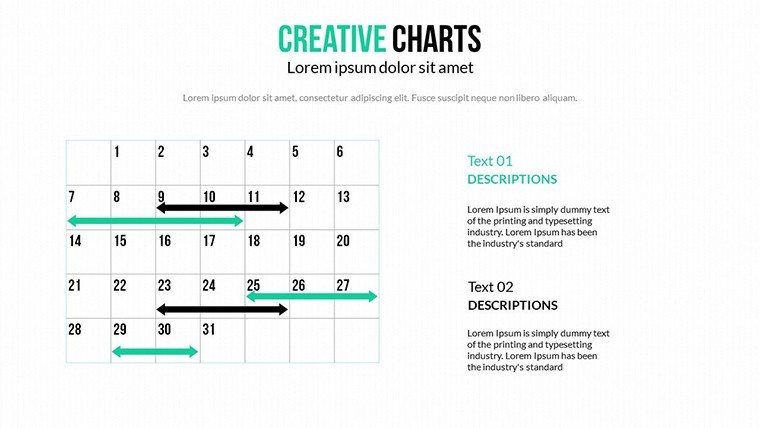
Creative Light Process Charts - Fully Editable PPTX
| Format | .pptx |
| Slides | 21 unique layouts |
| Aspect ratio | 16:9 |
| Compatibility | PowerPoint |
| Animated | No |
| Language | English |
| License | Commercial |
| File size | — |
| Version | v1.0 |
| Last updated | March 2026 |
What's inside
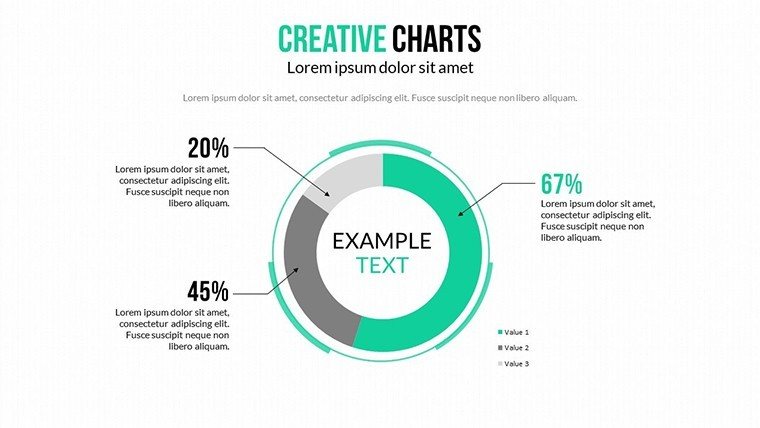
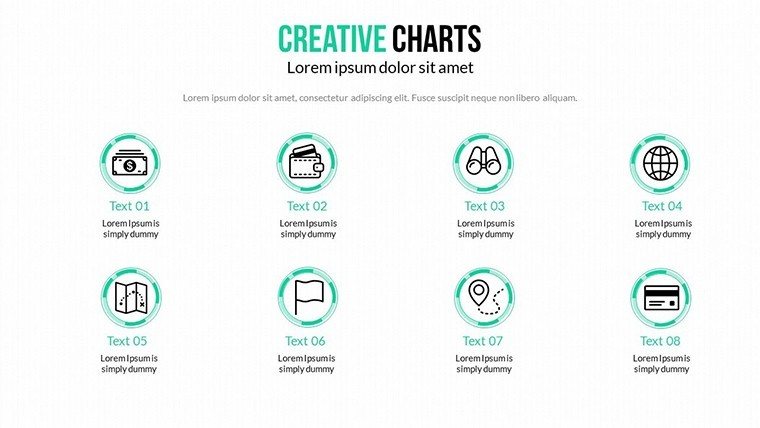
21 Process Diagrams in Light Palette: Files Included
21 diagrams arrive in the download.
The set includes flowcharts for operational processes along with matrices for risk assessments.
These elements combine to cover full analysis workflows from asset management through growth matrices in one deck.
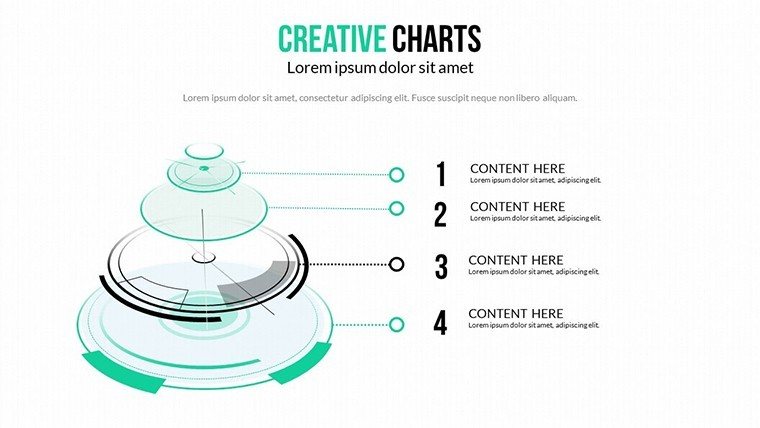
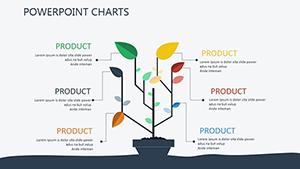
Unlike dark-themed sets the design here uses soft color palettes with light hues to reduce visual fatigue. It suits best the task of Ansoff growth matrix presentation for strategists since light segmentation aids hierarchy perception without overload. The single purchase covers the full 21 slides with all diagrams in PPTX.
Technical Specs
FeatureDetailsDiagram categoriesflowcharts matrices and risk graphsEditable elementsshapes connectors and labels independentColor theme adjustmentscompatible with PowerPoint slide master paletteAnimation supportsubtle transitions editable per slideExport optionsPPTX for editing and PDF for sharingPowerPoint compatibility2016 and newer versionsThree Situations Where This Pays Off
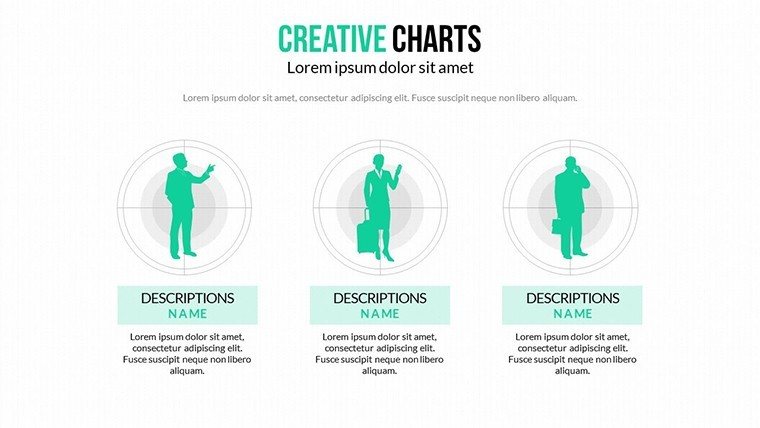
Business Development Manager in Tech Firm
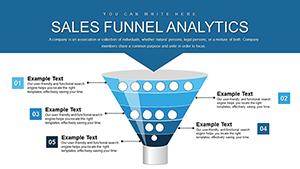
A business development manager in a tech firm presents Ansoff matrices. These charts cut preparation from three hours to 45 minutes by updating light hues for market penetration visuals.
Risk Analyst in Finance
A risk analyst in finance maps operational processes for board review. The same file reuses across five briefings by swapping color schemes while preserving soft palette clarity.
Download to Begin Editing Your Process Analysis
From Download to Final Deck
Moderate difficulty suits users familiar with basic PowerPoint tools.
- Open the .pptx file in PowerPoint 2016 or newer (1 minute)
- Replace placeholder text with your analysis details (3 minutes)
- Adjust brand colors through the slide master palette (2 minutes)
- Edit diagram labels and animation timings (4 minutes)
- Export as PPTX or PDF for the meeting (1 minute)
Total time stays under 15 minutes for a branded version.
Building From Scratch vs. Starting Here
Building equivalent process diagrams from scratch demands advanced design skills and three hours minimum. Many users struggle with color contrast or zone segmentation when starting blank.
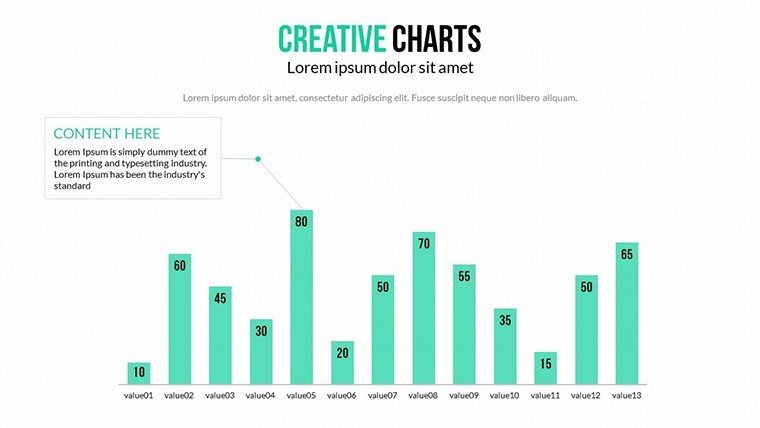
This approach requires only moderate skill and under 15 minutes. Soft palettes segment phases rather than decorate to focus attention on data structure.
Light hues here differentiate variables across groups which helps audiences follow risk assessments without visual fatigue.
Get the Full Set of Creative Light Charts Now
Which PowerPoint versions does this template support?PowerPoint 2016, 2019, 2021 and Microsoft 365 on Windows or Mac all open the PPTX file without issues. Earlier versions may lack some animation features but core diagrams remain editable. Test the file in your installed version before full commitment if using legacy software. The slide master ensures consistent layouts across versions.
How do I change the color scheme?Open the slide master view in PowerPoint. Select the theme colors section and update the palette to match your brand. Apply changes across all 21 slides automatically. Save the file to lock in the new scheme for future use.
What license applies to the purchase?Commercial use in client work and internal presentations is fully permitted. Resale of the template or any derivative as standalone product remains prohibited. Sublicensing to third parties is not allowed under the terms. Contact support for specific enterprise licensing questions.
Is there a free version available?The product page does not list a separate free tier. The single purchase includes the complete set of 21 editable slides with diagrams. All features shown in the description come with the paid file. No limitations apply after purchase.
What file formats are included and what opens them?The download contains only the PPTX format. Microsoft PowerPoint or compatible viewers such as Keynote with import open it directly. PDF export is available after editing for distribution. No additional JPG or other formats appear in the package.
What is the refund policy?Refunds are processed within 14 days of purchase if the file fails to open in supported PowerPoint versions. Provide proof of compatibility issue for approval. No refunds after successful download and editing. Support assists with any technical problems before refund requests.
Good for
- Project roadmaps and sprint plans
- Product launch timelines
- Quarterly or annual review decks
- Company history and milestone summaries
Licence
reviews
I downloaded this for a school project and it worked better than expected.
The graph layouts were clean and easy to follow.
A few slides looked repetitive though.
I liked the timeline sections most.
Pretty useful if you need charts quickly.
FAQ
Will it work in Google Slides?
Are fonts embedded?
Can I use this for client work?
What's the refund policy?
Do you update the template after purchase?
Similar templates
See all PowerPoint Charts →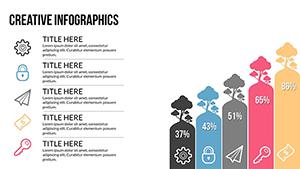
All 21 slides