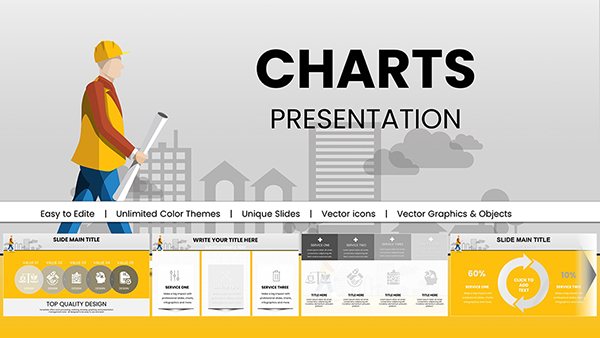
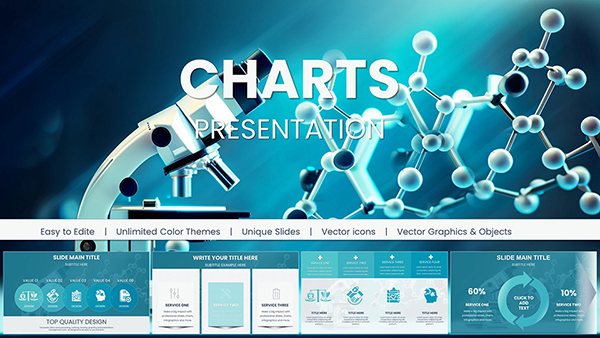
Services Company PowerPoint Charts Template for Seamless Processes


Type: PowerPoint Charts template
Category: Process
Sources Available: .pptx
Product ID: PC00472
Template incl.: 14 editable slides
For service-oriented businesses navigating complex client interactions and project timelines, our Services Company PowerPoint Charts Template is your ultimate ally. This collection of 14 editable slides specializes in visualizing processes, sequences, and relationships, turning abstract service flows into clear, actionable diagrams. Tailored for consultants, IT firms, and management teams, it addresses the pain points of miscommunication and inefficiency head-on. Envision mapping out a client onboarding journey with interconnected flowcharts that highlight key touchpoints, or illustrating resource allocation in a Gantt-style chart that adapts to your data. Compatible with PowerPoint and Google Slides, these charts come with vector icons and color variations, allowing effortless branding. Drawing from project management standards like those from PMI, this template ensures your presentations not only look professional but also adhere to best practices for clarity and engagement. Whether you're refining internal workflows or pitching to prospects, this tool empowers you to communicate value with precision, fostering better team alignment and client satisfaction in a competitive landscape.
Core Features Tailored for Service Industries
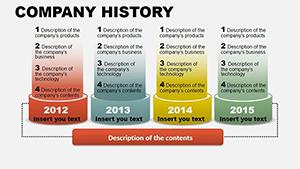
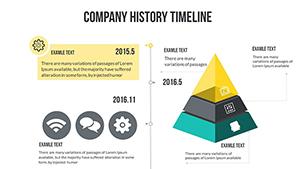
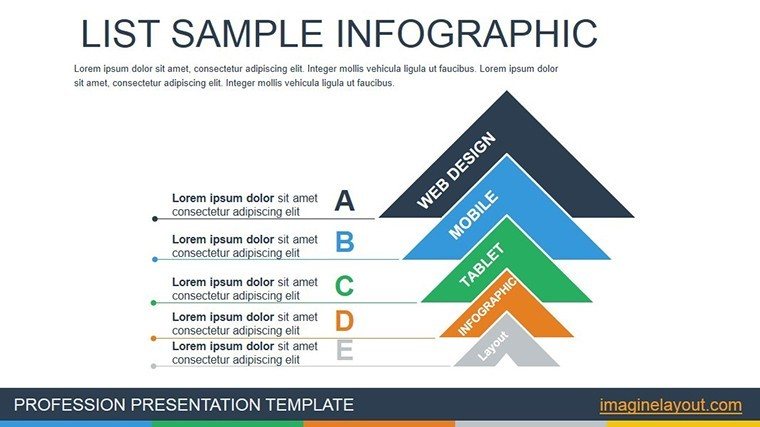
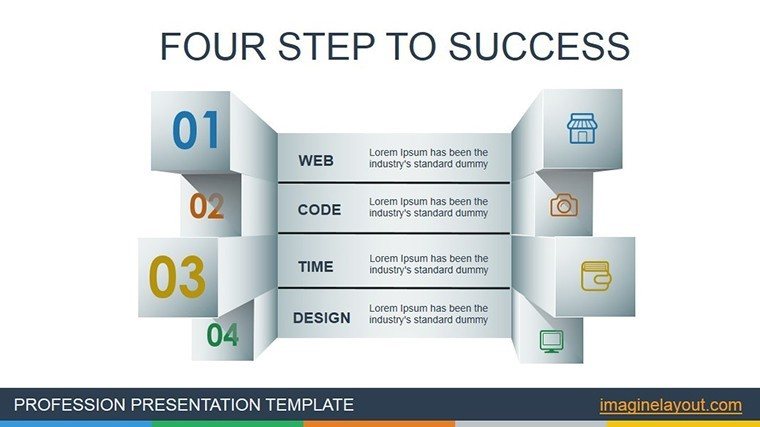
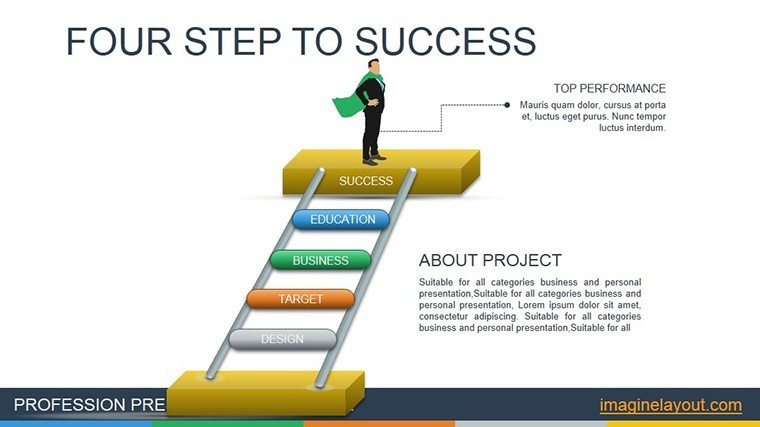
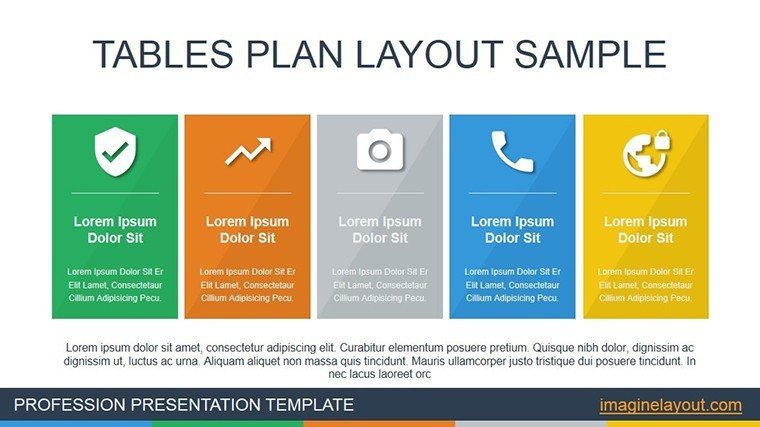
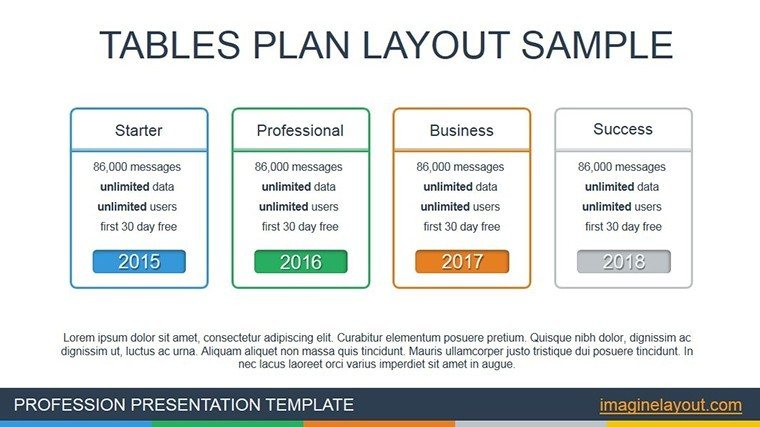
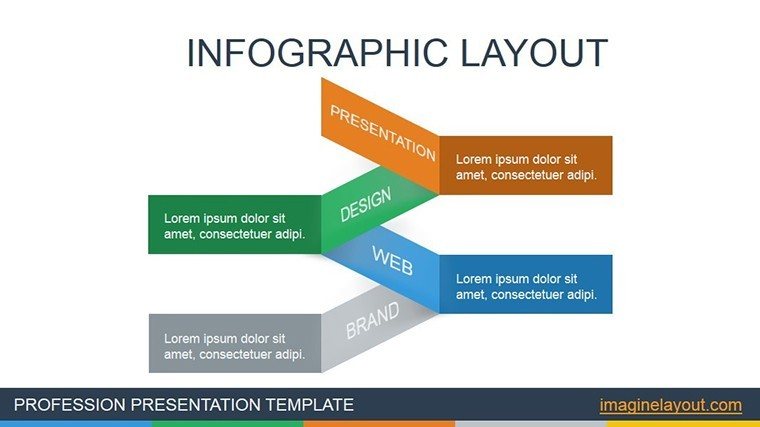
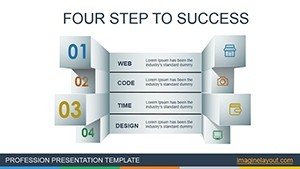
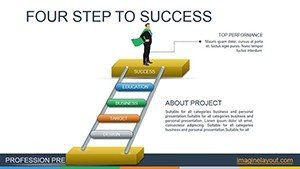
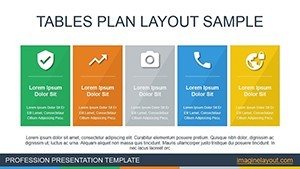
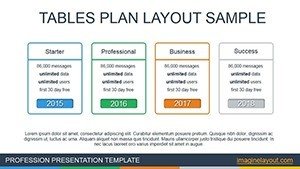
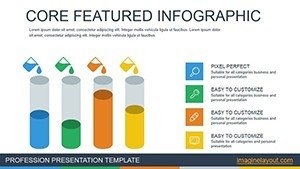
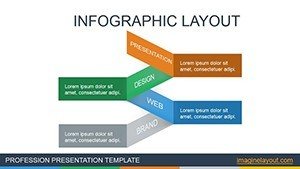
At its core, this template excels in depicting interactions and sequences, essential for services where timing and coordination are key. Each slide is built with editable objects that represent stakeholders, messages, and milestones. For example, Slide 1 presents a basic process flowchart for service delivery cycles; Slide 2 expands into a swimlane diagram to assign responsibilities across teams. Slide 3 introduces timeline charts for project phasing, while Slide 4 uses matrix charts to analyze service portfolios. These designs incorporate custom animations for step-by-step reveals, making complex processes digestible. Unlike standard PowerPoint tools that force you to start from scratch, our pre-built structures save hours, with built-in data validation to prevent errors.
Enhancing Project Management with Visual Aids
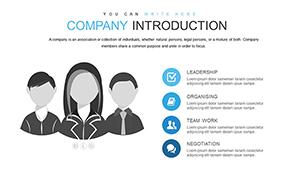
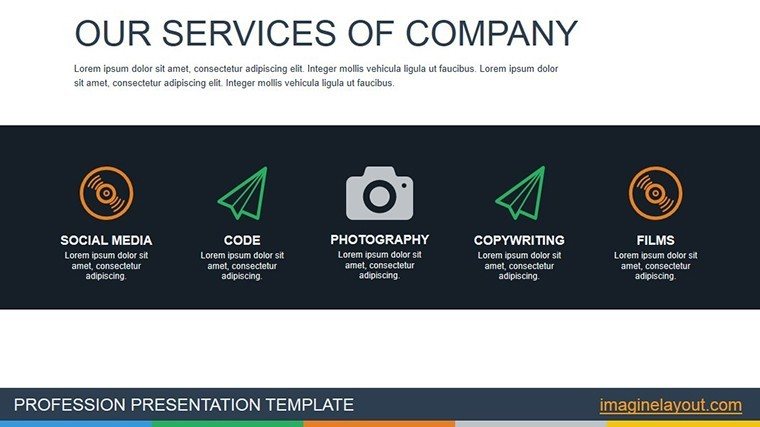
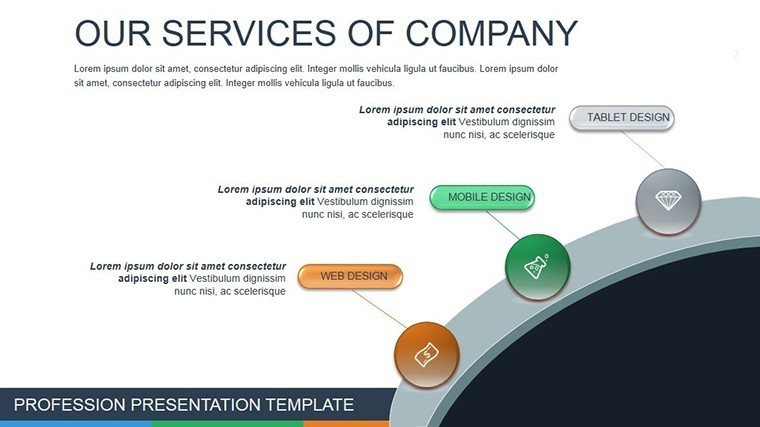
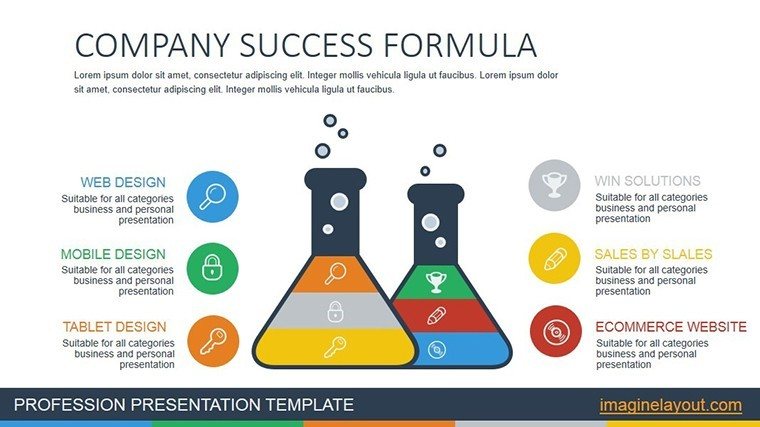
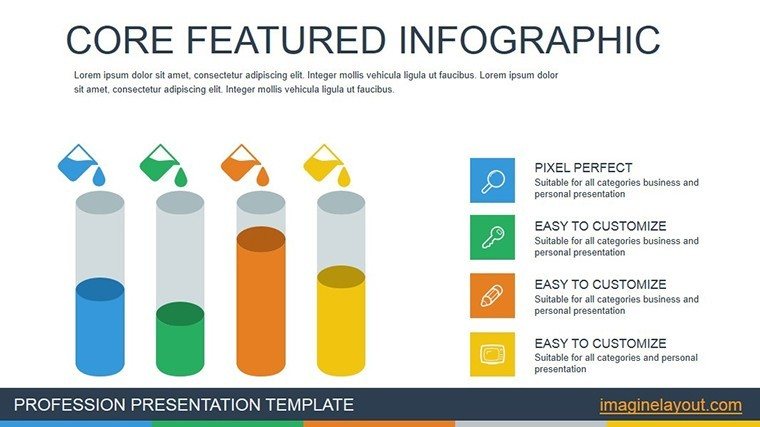
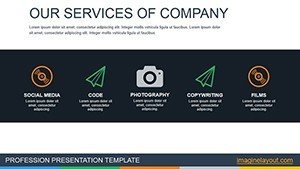
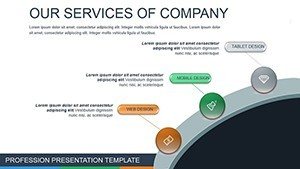
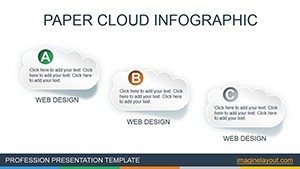
In project management, where multiple teams and shifting deadlines converge, charts like these are indispensable. Use them to allocate resources visually, spotting bottlenecks before they arise. A real estate services firm, for instance, could employ a dependency chart to map property acquisition steps, ensuring all parties – from agents to legal – are synchronized. The template's vector icons, themed around business services, add a professional touch without clutter.
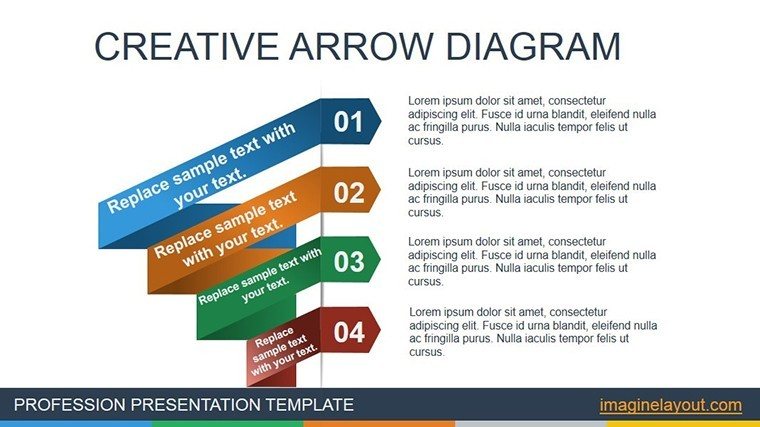
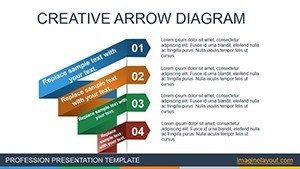
- Process Flowcharts: Map sequences with arrows and nodes for clear navigation.
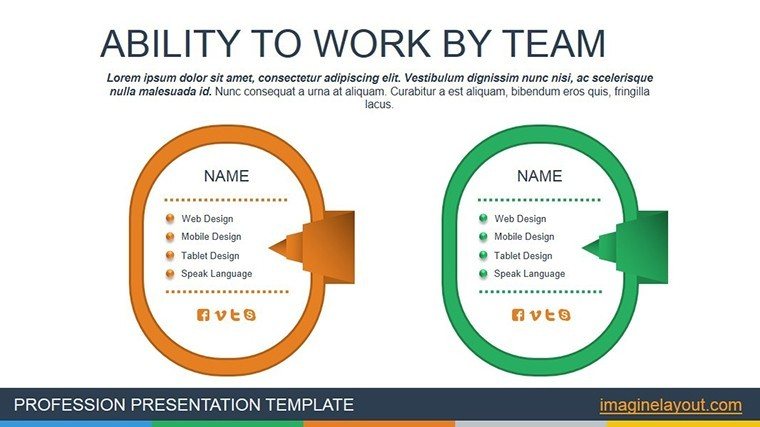
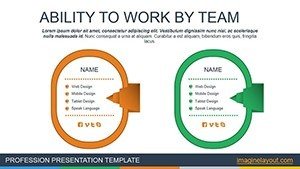
- Interaction Diagrams: Show message flows between entities in real-time scenarios.
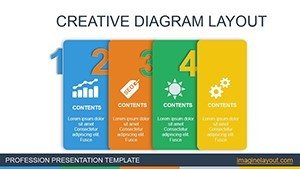
- Customizable Colors: Adapt to your corporate palette for brand consistency.
- Editable Vectors: Scale and modify icons for specific service contexts.
Diverse Use Cases in Service Sectors
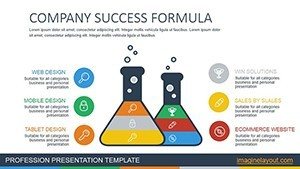
From consulting to hospitality, this template adapts seamlessly. In IT services, animate a sequence chart to demonstrate software implementation phases, helping clients visualize ROI. For financial advisors, use bubble charts to illustrate risk assessments, drawing on standards from CFA Institute for credibility. A case study: A marketing agency streamlined their campaign planning presentations, resulting in 25% faster client approvals. Educators in business schools can dissect service blueprints, enhancing student comprehension of operational strategies.
Practical Workflow Integration Tips
- Import your service data into the template's placeholders.
- Adjust node connections to reflect actual process flows.
- Incorporate animations for phased reveals during meetings.
- Link to external docs for deeper dives into specifics.
- Export as PDF for client handouts post-presentation.
This method, informed by agile methodologies, ensures agility in your service deliveries. Compared to generic charts, these specialized ones reduce misinterpretations, boosting overall efficiency.
Expert Insights for Optimal Use
Leverage color psychology – blues for trust in financial services, greens for growth in consulting. Keep diagrams to under 10 elements per slide to avoid overload, as per visualization gurus like Stephen Few. For urban planning services, adapt flowcharts to zoning processes, mirroring AICP standards. Regular updates via data links keep your charts current, a must in dynamic service environments.
Standing Out in a Crowded Market
What sets this apart? Its focus on service-specific visuals, unlike broad templates that dilute impact. With over 800 ratings averaging high, users praise its intuitiveness and results-driven design. It's more than slides; it's a catalyst for better business outcomes.
Elevate your service presentations now – download this template and chart a course to success.
Frequently Asked Questions
What types of services benefit most from this template?
It's ideal for consulting, IT, finance, and any sector involving processes and interactions.
Can I add my own icons?
Yes, the vector-based design allows easy import and integration of custom icons.
Does it support team collaboration?
Absolutely, works seamlessly in shared Google Slides environments for real-time edits.
How do I handle complex processes?
Use layered diagrams and animations to break them down into manageable views.
Is there a mobile version?
Compatible with PowerPoint mobile apps, though best on desktop for detailed editing.