 Click to zoom
Animated 3D Infographic PowerPoint Template - Fully Editable & Instant Download
| Format | .pptx |
| Slides | 14 unique layouts |
| Aspect ratio | 16:9 |
| Compatibility | PowerPoint |
| Animated | No |
| Language | English |
| License | Commercial |
| File size | — |
| Version | v1.0 |
| Last updated | February 2026 |
What's inside
Presenting complex hierarchical data or processes with static slides often leaves audiences disengaged and struggling to follow. This animated 3D infographic PowerPoint template solves that challenge by delivering visually striking slides with depth and motion that guide viewers through information step by step.
With 14 unique slides incorporating 3D elements and built-in animations, it transforms flat data into engaging stories - perfect for professionals who need to communicate organizational structures, strategies, or concepts clearly and memorably.
Whether preparing for a client meeting, training session, or internal review, this template helps you create presentations that hold attention and drive better understanding.
Key Features
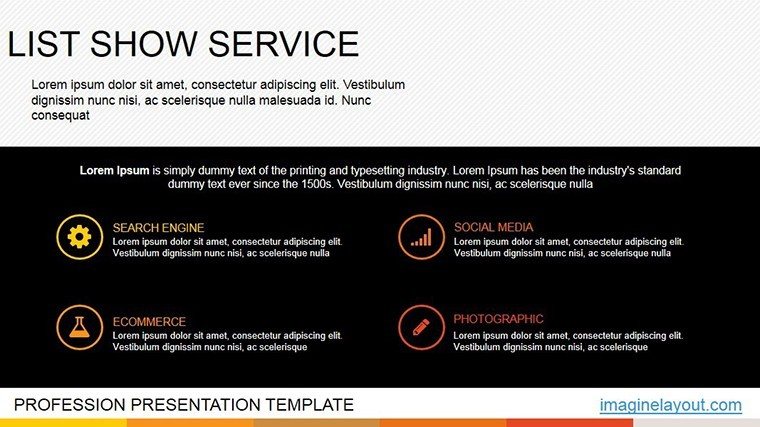
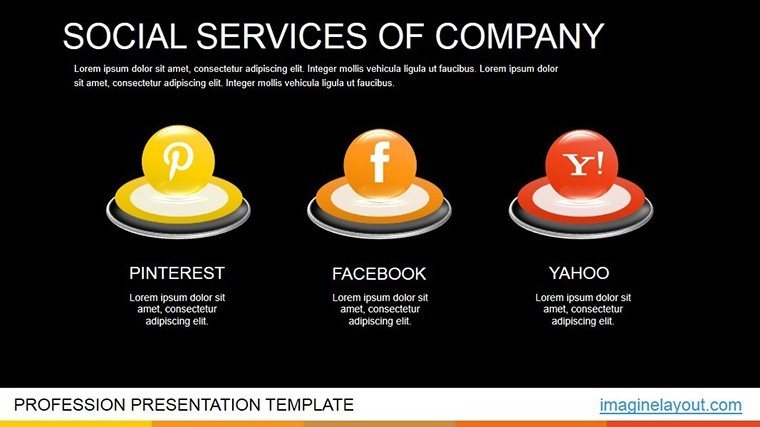
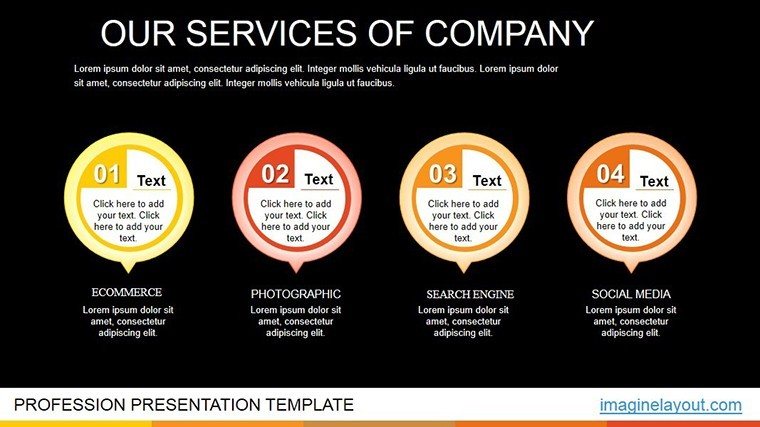
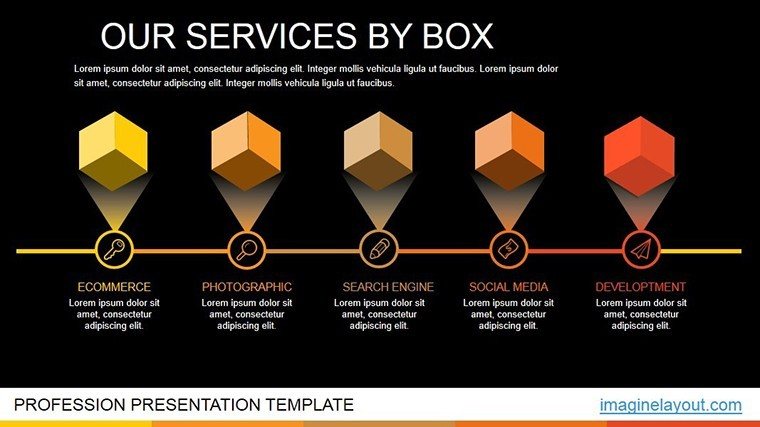
- 14 fully editable slides with unique layouts
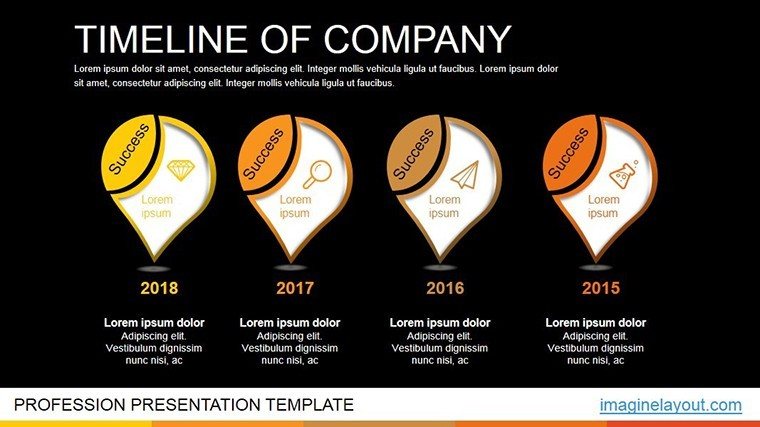
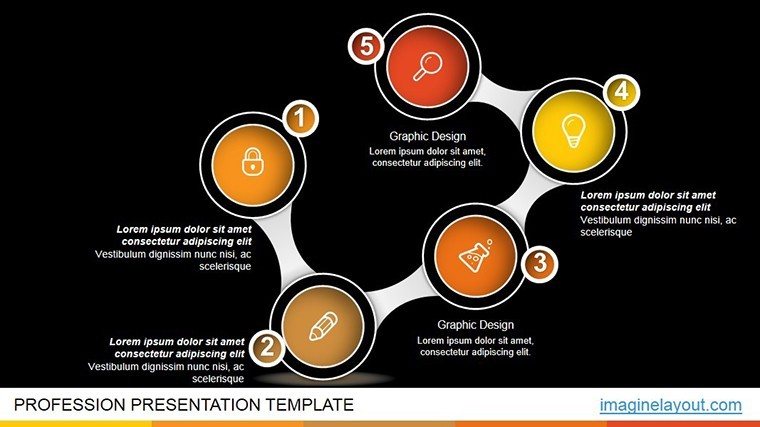
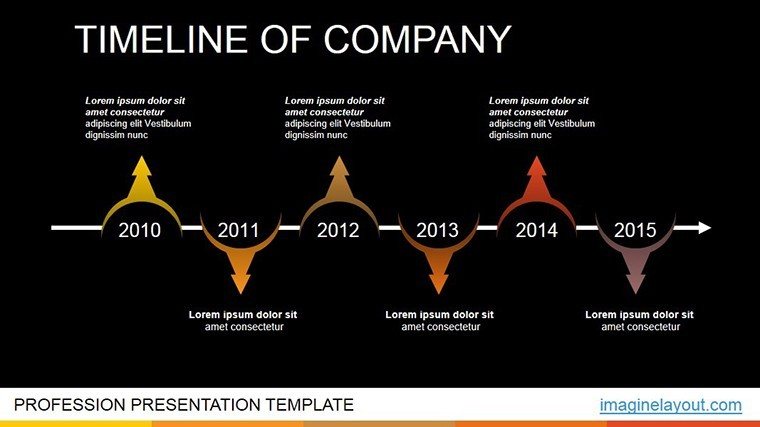
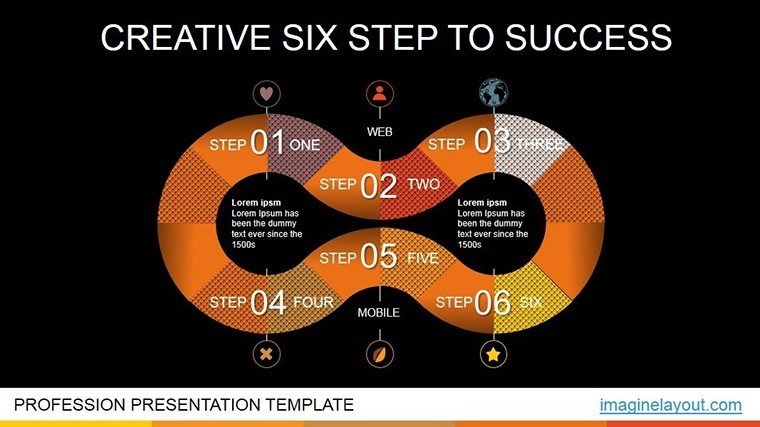
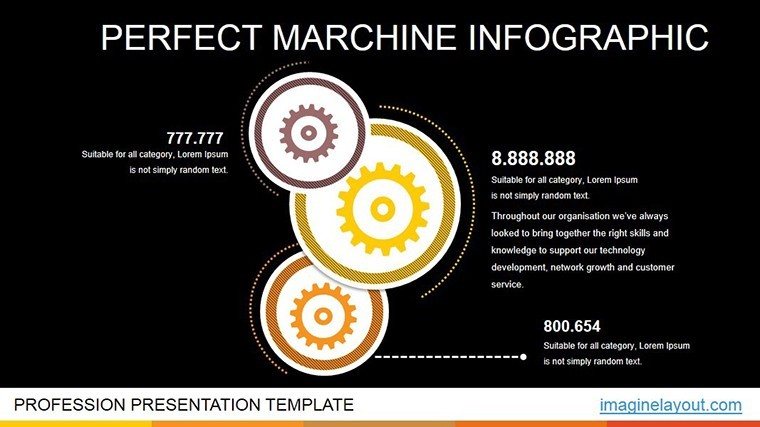
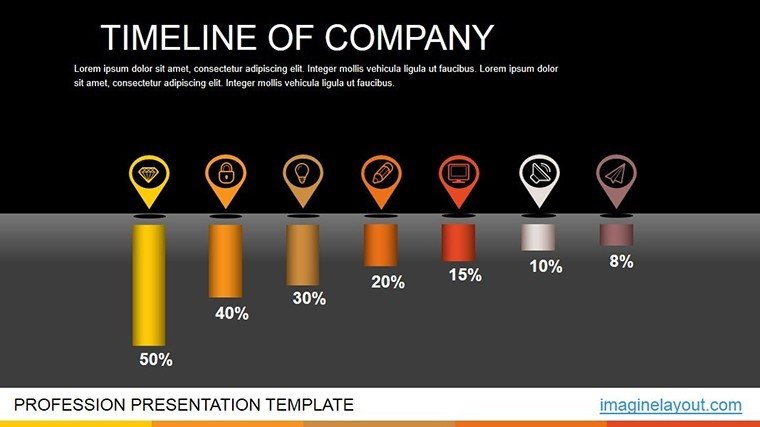
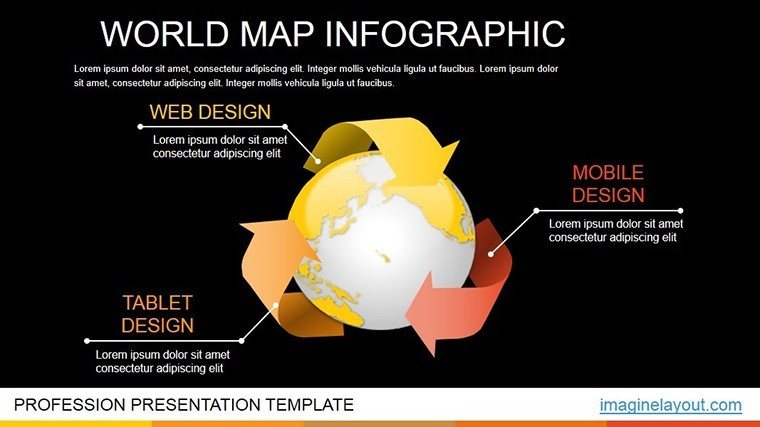
- 3D infographics including bar charts, pie charts, pyramids, funnels, and organizational trees
- Pre-built dynamic animations for entrance, emphasis, and smooth transitions
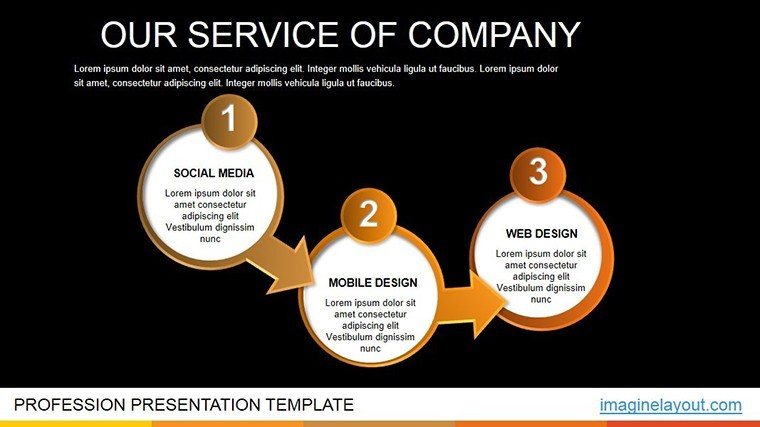
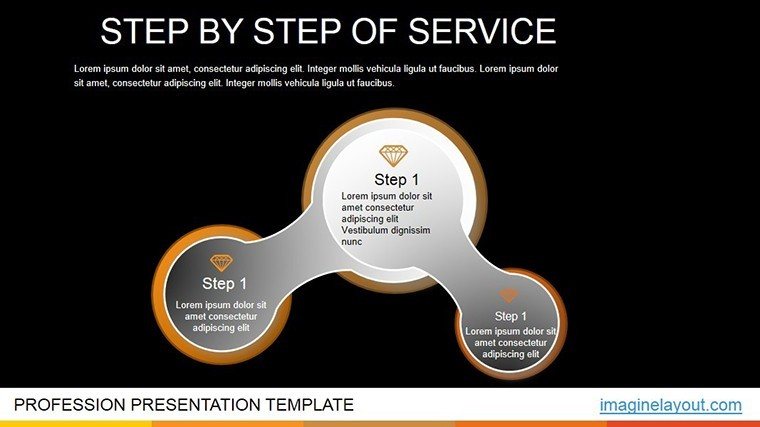
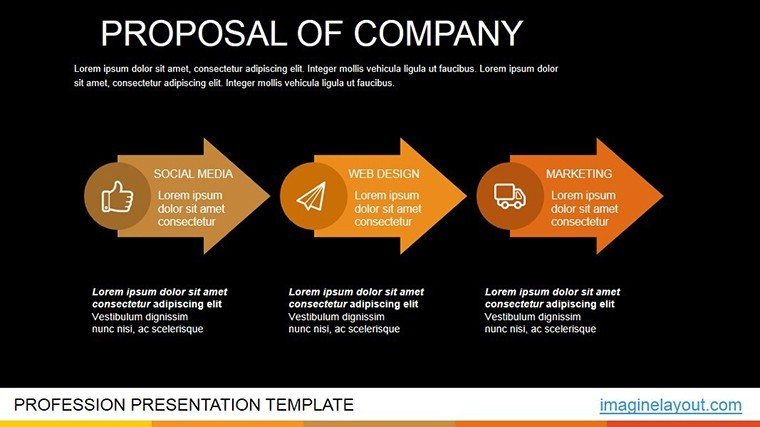
- Animated matrices and flowcharts for process visualization
- Complete customization of colors, text, shapes, and animation timing
- Full compatibility with Microsoft PowerPoint and Google Slides
Why Choose Animated 3D Infographics?
3D elements add visual depth that makes hierarchical relationships and spatial data instantly clearer, helping audiences grasp complex structures without confusion.
Animations direct focus sequentially, reducing cognitive load and improving retention compared to traditional static charts.
In professional environments, these dynamic visuals create a polished, modern impression that strengthens your message and keeps viewers engaged throughout the presentation.
This approach is especially effective for virtual or large-audience settings where maintaining interest is critical.
How to Use This Template
After instant download, open the .pptx file directly in PowerPoint or Google Slides. Replace placeholder text and data - charts update automatically when values are changed.
Customize colors and fonts to match your brand using theme options or individual element editing. Animations are pre-configured but easily adjustable via the animation pane for custom timing and order.
Duplicate or rearrange slides to fit your content needs, then rehearse to align narration with visual builds for maximum impact.
Ready to create more engaging presentations? Download this template and get started immediately.
Professional Scenarios
Business & Corporate Presentations
Display organizational hierarchies with rotating 3D org charts or build strategic pyramids layer by layer to clearly communicate reporting lines and responsibilities.
Consulting & Strategy
Illustrate client processes using animated funnels and matrices to present recommendations with visual clarity and professional flow.
Education & Training
Teach layered concepts or frameworks with progressive animations that help learners visualize relationships and build understanding incrementally.
Internal Operations
Share team structures, project timelines, or decision frameworks in meetings with engaging visuals that improve alignment and discussion.
Transform your next presentation with professional animated 3D infographics - add to cart now for instant access.
What software is required to use this template?It is fully compatible with Microsoft PowerPoint and Google Slides. No additional software is needed.
Are the animations pre-built and editable?Yes, all slides include professional pre-built animations that are ready to use. You can easily modify timing, order, or effects in PowerPoint's animation pane.
Can I customize colors and layouts?Absolutely - every element is fully editable. Change colors to match your brand, modify layouts, resize shapes, and update text without restrictions.
How many slides are included?The template contains 14 unique, professionally designed editable slides focused on 3D infographics and animations.
Is this template suitable for business presentations?Yes, it's specifically designed for professional use cases including organizational charts, strategy visualization, training materials, and client presentations.
Good for
- Project roadmaps and sprint plans
- Product launch timelines
- Quarterly or annual review decks
- Company history and milestone summaries
Licence
reviews
The flowchart pages were useful for explaining our support process.
Pretty standard template but easy to work with.
Some icons felt random in places.
I appreciated that the slides weren’t overloaded.
Good enough for office use.
FAQ
Will it work in Google Slides?
Are fonts embedded?
Can I use this for client work?
What's the refund policy?
Do you update the template after purchase?
Similar templates
See all PowerPoint Charts →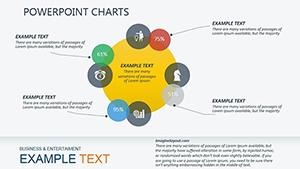

All 14 slides