Most Template Animation PowerPoint Charts


Type: PowerPoint Charts template
Category: Tables
Sources Available: .pptx
Product ID: PC00459
Template incl.: 20 editable slides
Data comparison demands more than rows and columns; it requires animation to unveil patterns and insights vividly. Our Most Template Animation PowerPoint Charts offers 20 editable slides with color variations, custom effects, vector icons, and JPGs, perfect for turning comparisons into captivating visuals. Suited for analysts, educators, and strategists, this template facilitates high-quality animations that play on any computer. Echoing principles from data viz pioneer Hans Rosling, it prioritizes clarity and engagement in storytelling. In PPTX format, it's fully editable for text, colors, and media, expanding your creative scope. Users value how it simplifies contrasts - like sales across regions or metrics over time - making presentations almost interactive. With wide functionality, it's ideal for boardrooms or classrooms, where animated reveals heighten understanding and retention, driving informed discussions and outcomes.
Premier Features for Animation Excellence
Highlights include advanced animations, quality images, easy color/text changes, full editability, and media insertion capabilities.
- High-Quality Animations: Create attractive motion for data flows.
- Color Variations: Endless palettes for thematic consistency.
- Vector Icons: Scalable graphics for sharp visuals.
- Media Support: Insert videos/audio for multimedia depth.
- Broad Compatibility: Plays smoothly on most devices.
Core Benefits for Data-Driven Work
Enables effortless comparisons, enhances visual appeal, and ensures universal playback, per Tableau's data best practices.
Perfect for Data Comparators
Analysts contrast KPIs; teachers illustrate concepts; planners evaluate options.
Slide Insights and Breakdowns
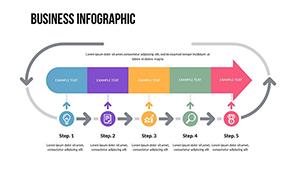
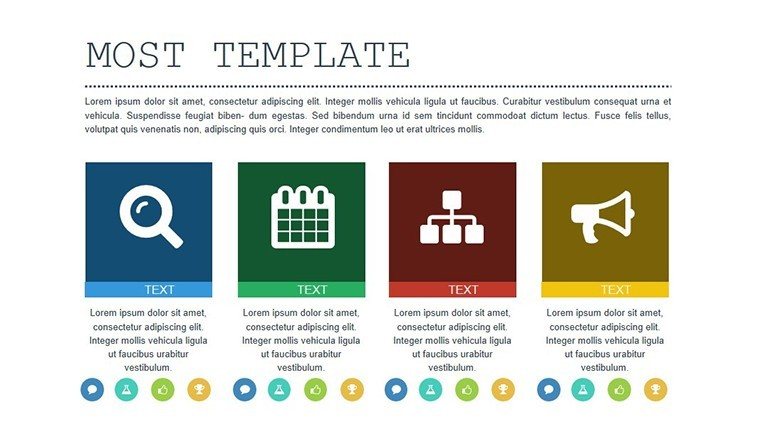
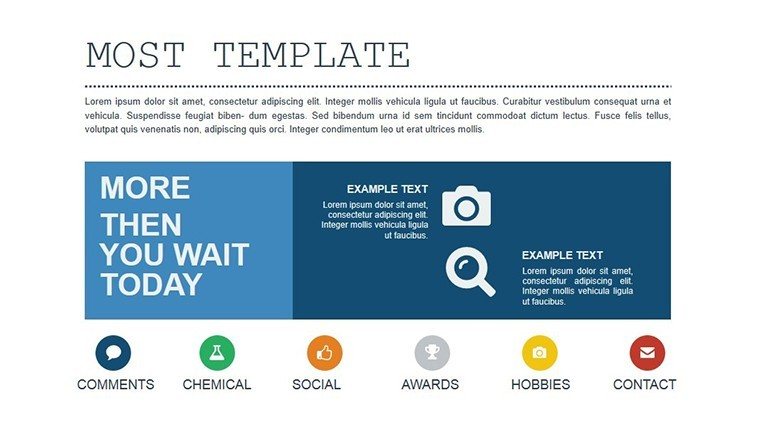
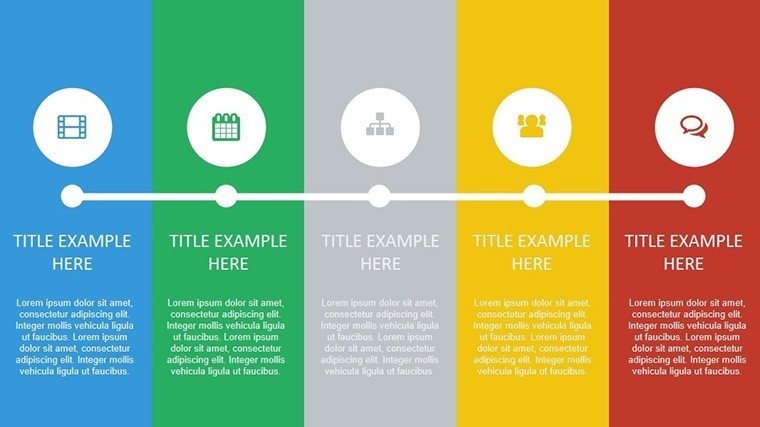
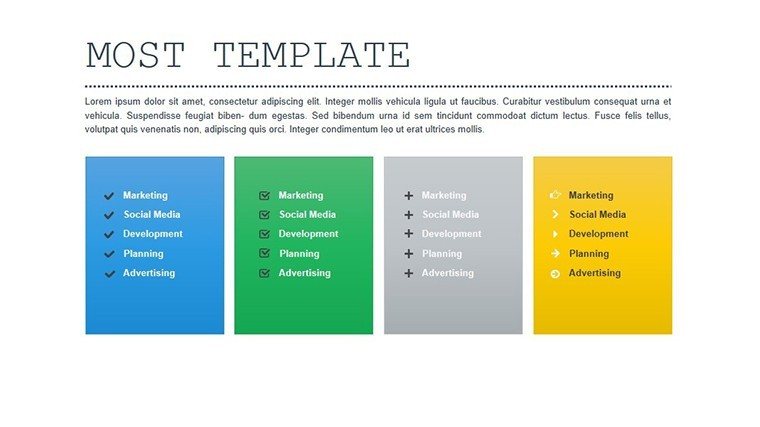
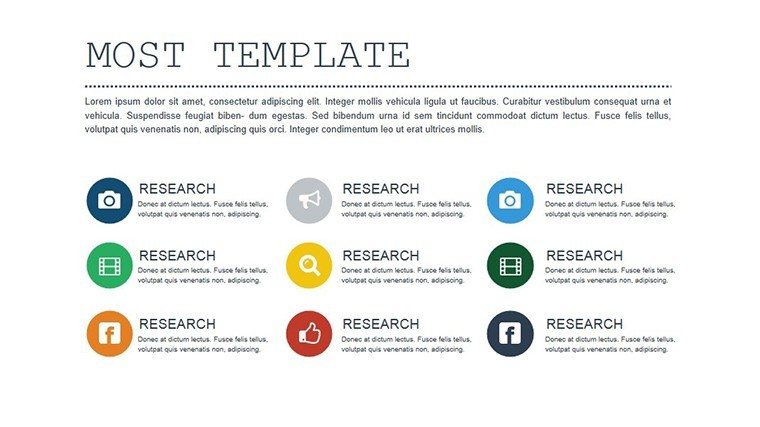
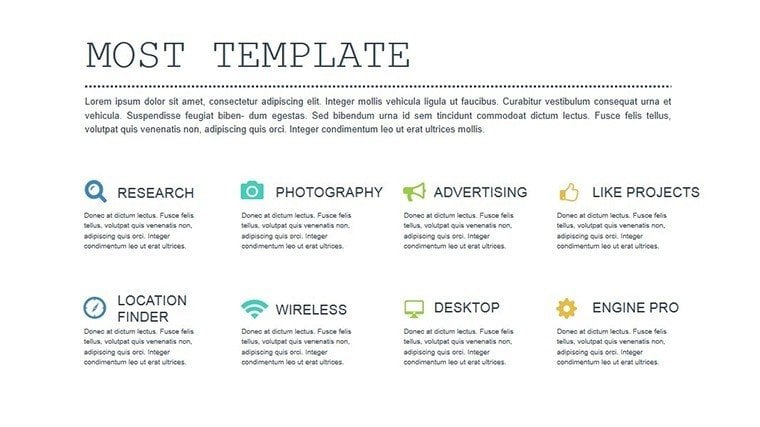
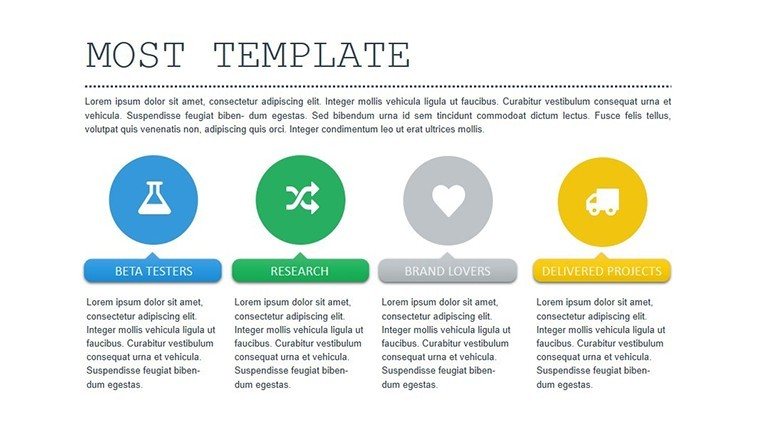
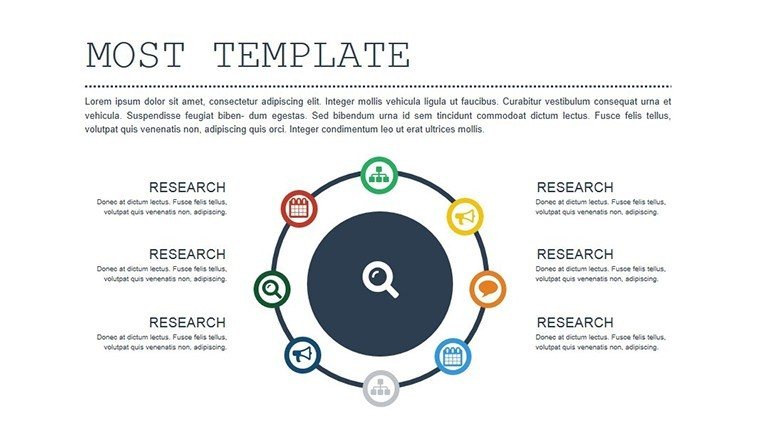
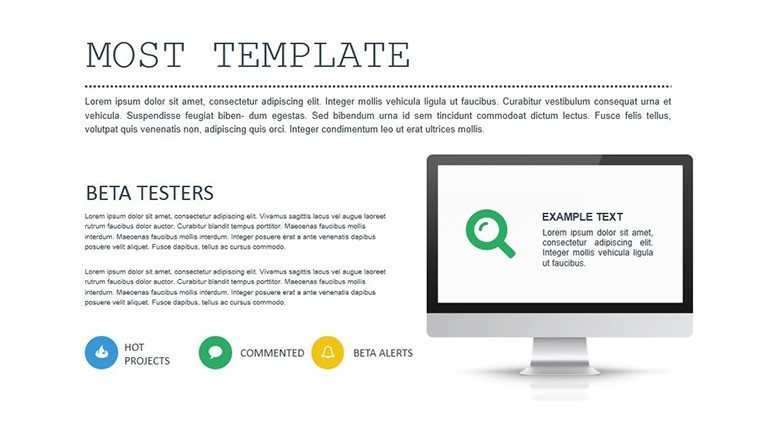
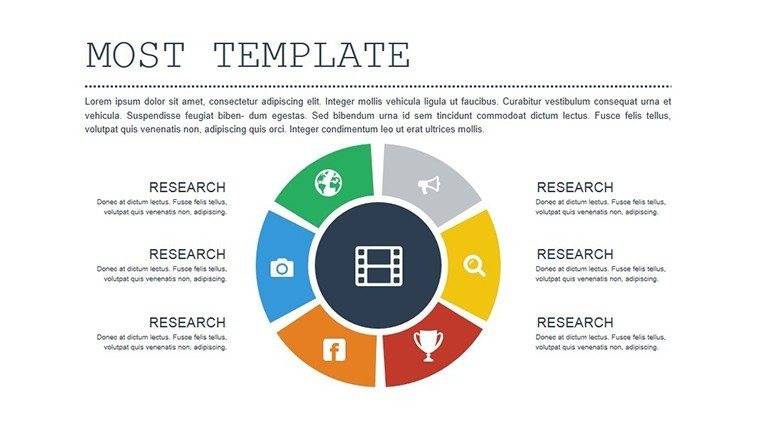
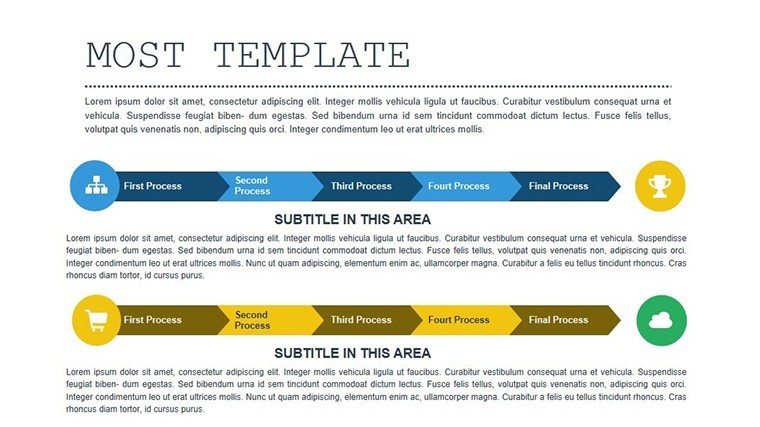
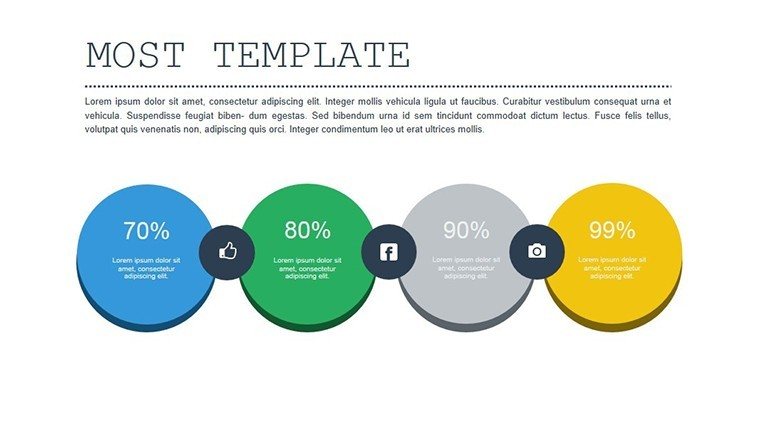
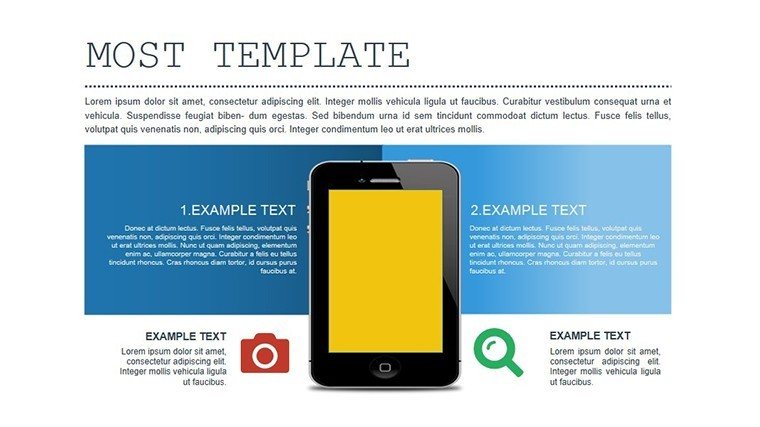
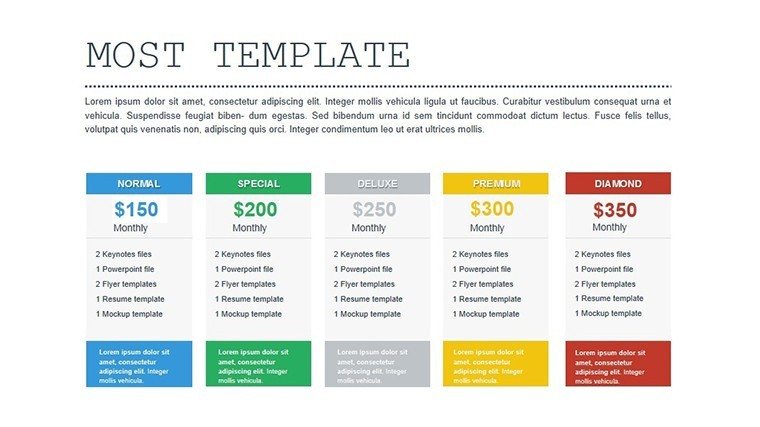
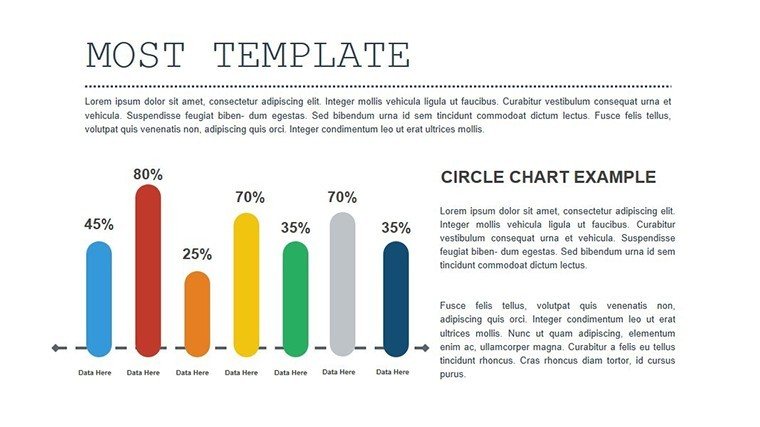
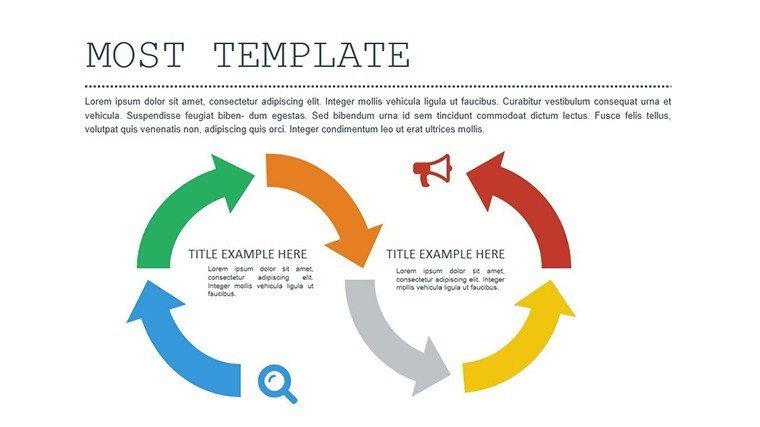
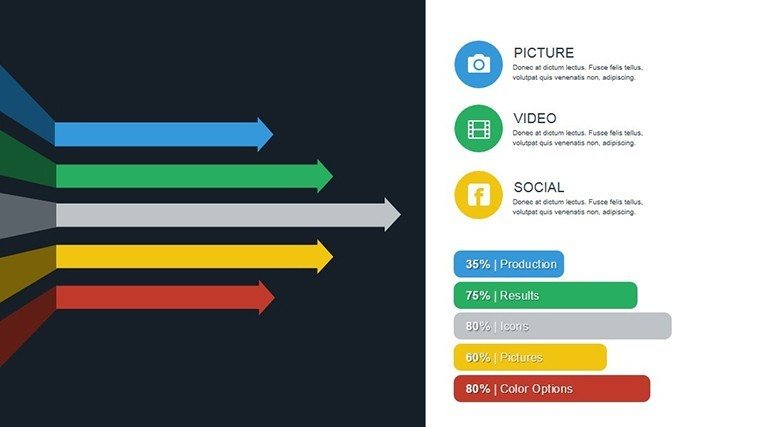
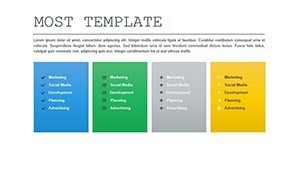
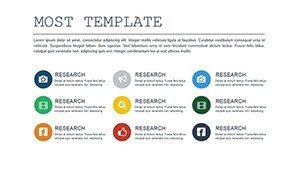
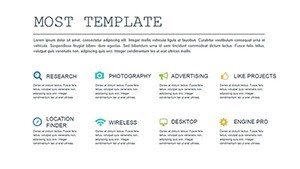
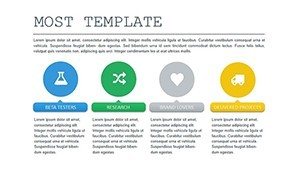
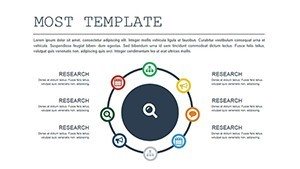
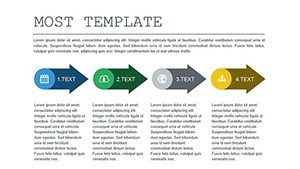
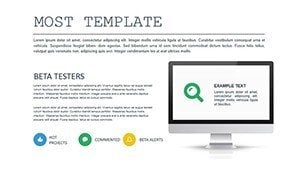
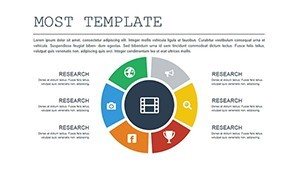
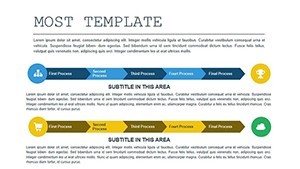
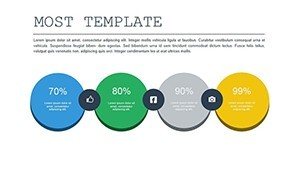
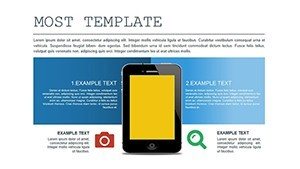
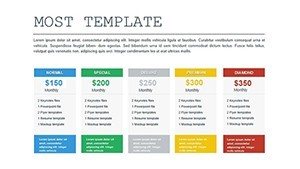
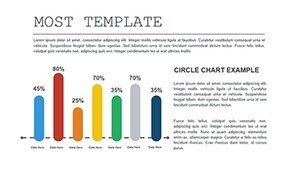
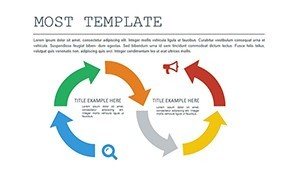
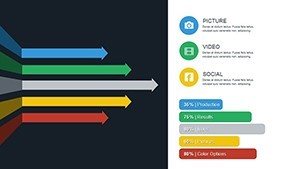
20 slides focus on comparisons: animated tables, chart builds, icon-enhanced summaries.
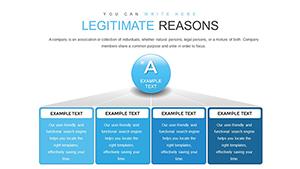
- Comparison Tables: Animate side-by-sides.
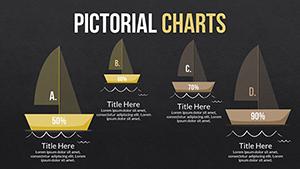
- Metric Charts: Reveal differences dynamically.
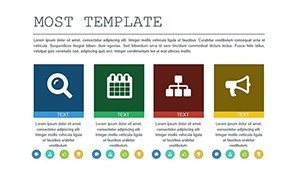
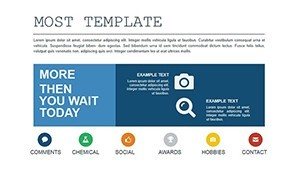
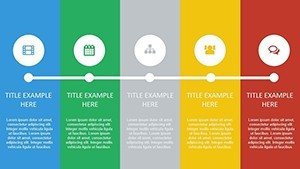
- Icon Integrations: Visual aids with motion.
- Multimedia Slides: Embed for context.
- Summary Animations: Conclude with impact.
Real-Life Comparisons and Wins
A finance team animated budget variances, aiding decisions; a researcher compared studies per APA guidelines, publishing successfully.
Advanced Customization Advice
Balance animations for pacing; use icons sparingly; integrate with Excel for live data.
Workflow Synergies
Connect to BI tools like Power BI; export for web sharing.
Master data animation - grab this template and compare with confidence.
Frequently Asked Questions
- What makes the animations unique?
- Custom effects with high-quality, editable elements.
- Can I change colors easily?
- Yes, fully adjustable for any scheme.
- Is it limited to charts?
- No, includes tables and icons for variety.
- How compatible is it?
- Plays on almost any computer via PPTX.
- Can I add audio?
- Yes, insert fragments for enhanced narratives.
- Are icons vector-based?
- Yes, scalable without quality loss.