Professional PowerPoint Charts Template for Versatile Data Viz


In today's fast-paced professional world, conveying complex data effectively can make or break your presentation. Imagine having a toolkit that turns raw numbers into visually stunning narratives, captivating your audience from the first slide. Our Professional PowerPoint Charts Template is precisely that - a comprehensive collection of 16 fully editable slides designed for versatility and impact. Whether you're a business executive preparing quarterly reports, a marketer showcasing campaign results, or an educator illustrating statistical concepts, this template empowers you to communicate with clarity and confidence.
Crafted with precision, each slide incorporates high-quality graphics that align with modern design standards, ensuring your presentations look polished and professional. The template's drag-and-drop functionality means you spend less time fiddling with formats and more time focusing on your message. Compatible with PowerPoint and Google Slides, it's accessible across platforms, making collaboration seamless. Think about the last time a bland chart lost your audience's attention - this template eliminates that risk by offering customizable colors, fonts, and layouts that match your brand identity.
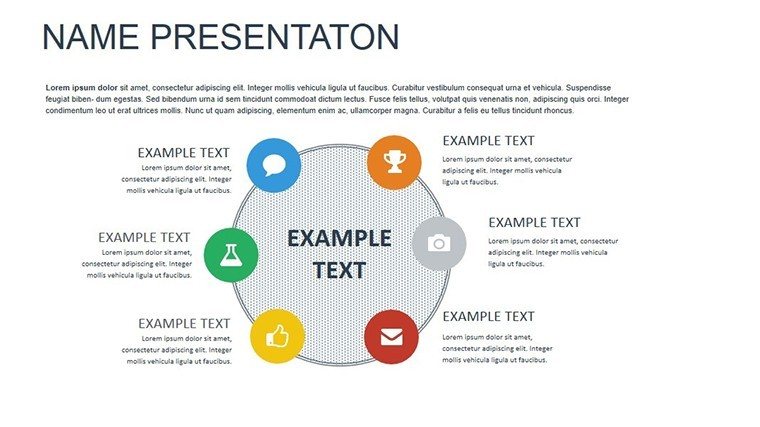
Beyond aesthetics, the real value lies in its practical applications. For instance, in corporate settings, use the bar charts to compare sales figures across regions, highlighting trends that drive strategic decisions. Educators can leverage pie charts to break down demographic data in sociology classes, fostering deeper understanding among students. Entrepreneurs pitching to investors will appreciate the scatter plots for demonstrating market correlations, turning abstract ideas into tangible insights. With built-in icons and symbols, you can add thematic elements that resonate with your topic, like financial motifs for budget reviews or educational icons for training sessions.
Key Features That Set This Template Apart
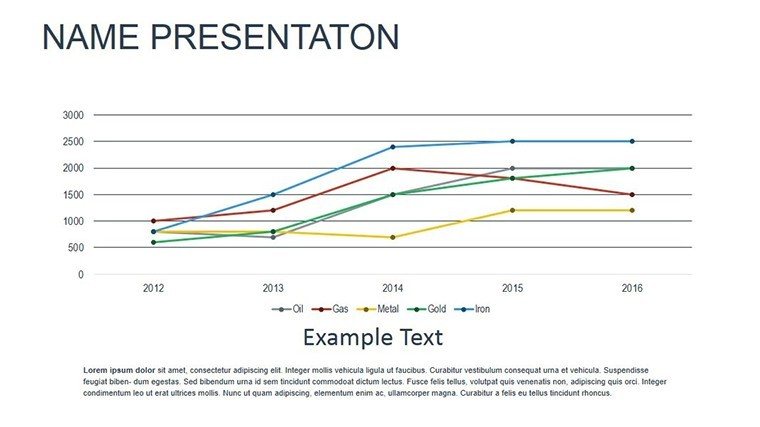
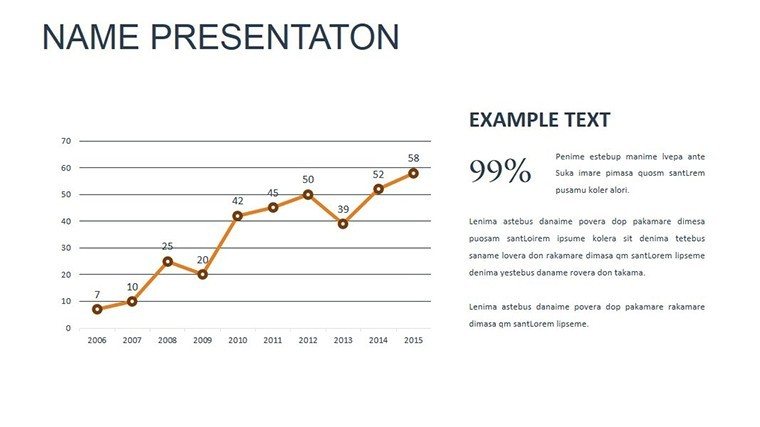
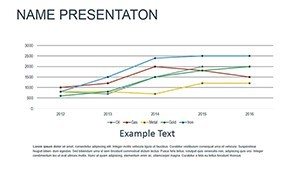
What makes this Professional PowerPoint Charts Template a must-have? Start with its core versatility: a mix of bar charts for comparative analysis, line graphs for trend tracking over time, pie charts for proportional breakdowns, and scatter plots for relationship mapping. Each element is fully editable, allowing you to input your data directly and watch the visuals update in real-time. This isn't just about pretty pictures; it's about data integrity - ensuring your graphs accurately reflect the numbers without manual errors.
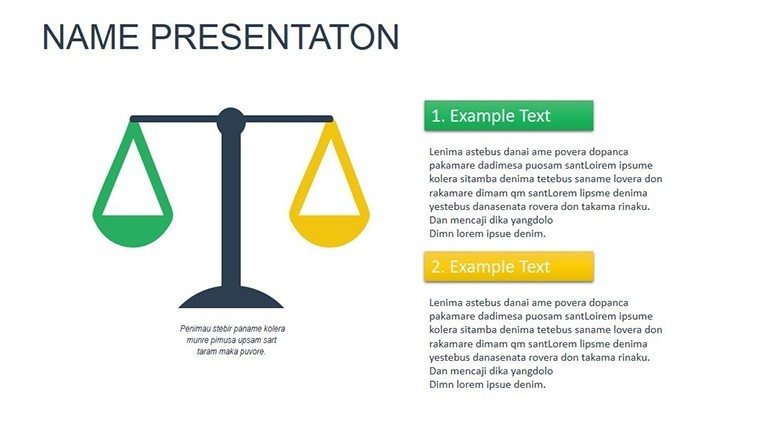
- Customizable Design Elements: Adjust colors to your brand palette, resize fonts for readability, and tweak styles to fit formal or creative tones.
- User-Friendly Interface: No advanced skills needed; intuitive tools like step-by-step guides help even beginners create pro-level slides.
- High-Resolution Graphics: Crisp visuals that maintain quality when projected or shared digitally, avoiding pixelation issues common in basic templates.
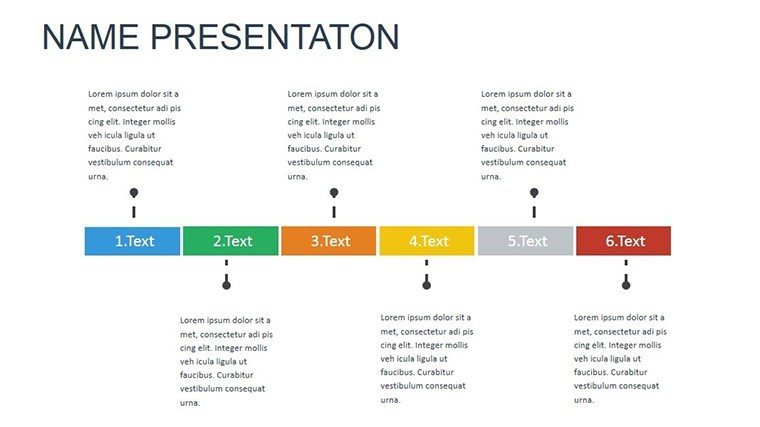
- Consistency Across Slides: Unified themes ensure your presentation flows logically, building a cohesive story from introduction to conclusion.
Moreover, the template includes infographics and tables that complement the charts, providing a holistic data presentation toolkit. For example, pair a line graph with a supporting table to offer both visual and detailed numerical views, catering to diverse audience preferences.
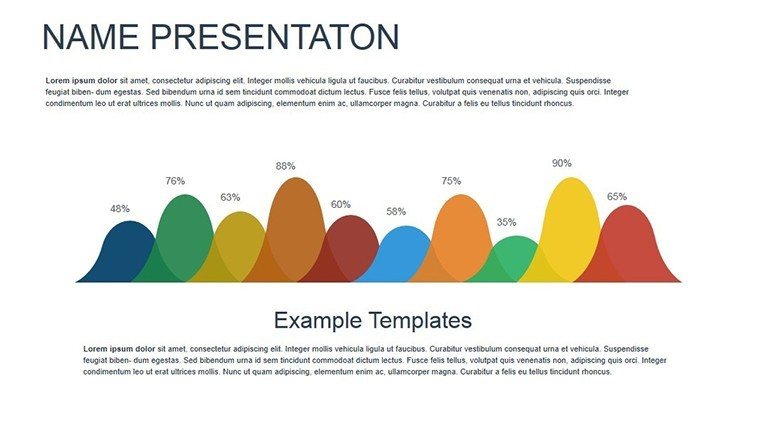
Real-World Applications and Use Cases
Let's dive into how this template shines in action. Consider a sales team at a mid-sized tech firm: using the bar charts, they visualized quarterly revenue growth, pinpointing underperforming products and prompting targeted improvements. This led to a 15% sales uplift in the following quarter, as per similar case studies from industry leaders like Gartner. In academia, a professor utilized pie charts to depict research funding allocations, making grant proposals more persuasive and securing additional resources.
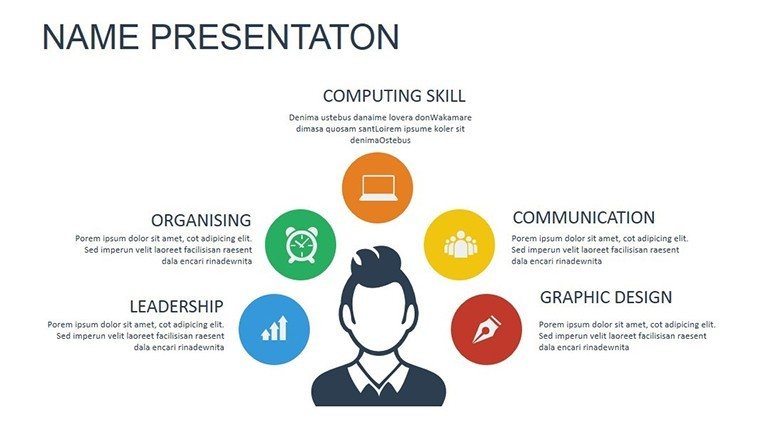
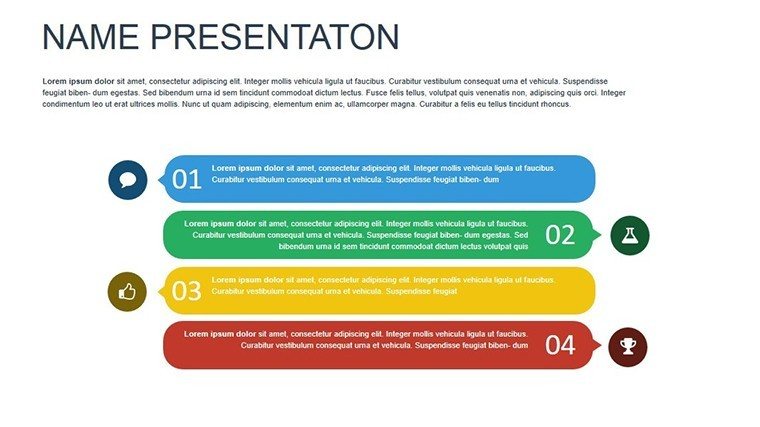
For startups, the scatter plots are invaluable in investor decks, illustrating user growth versus marketing spend to justify funding requests. Step-by-step: First, import your dataset into the slide. Second, select the chart type that best represents your variables. Third, customize aesthetics to align with your pitch theme. Finally, rehearse to ensure the data tells a compelling story. This workflow integrates seamlessly with tools like Excel for data import, streamlining your preparation.
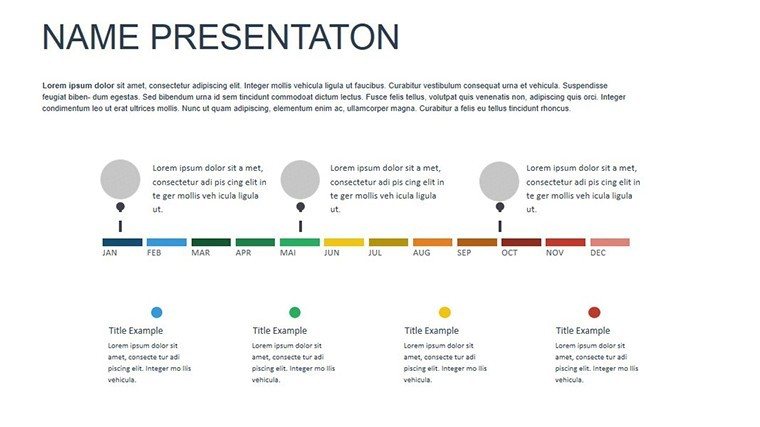
Compared to basic PowerPoint defaults, this template offers themed icons - think upward arrows for growth metrics or gears for process efficiencies - that add contextual depth without clutter. It's not just about charts; it's about elevating your entire narrative. In project management, use timelines integrated with graphs to show progress against benchmarks, helping teams stay aligned and accountable.
Detailed Slide Breakdown
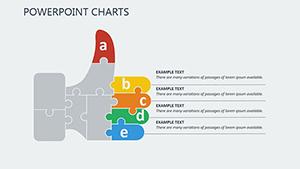
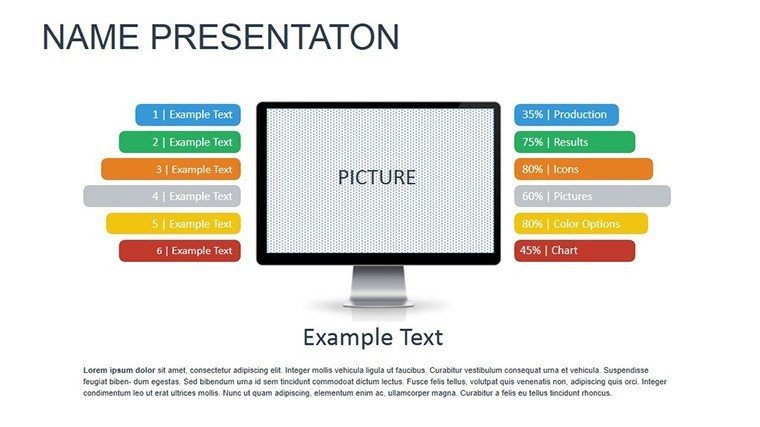
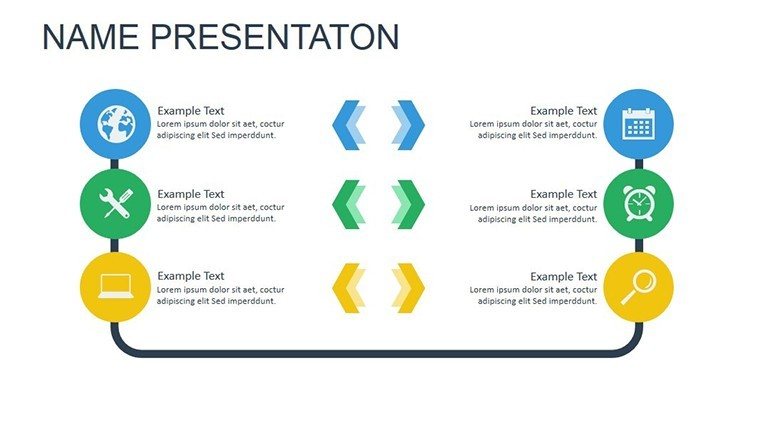
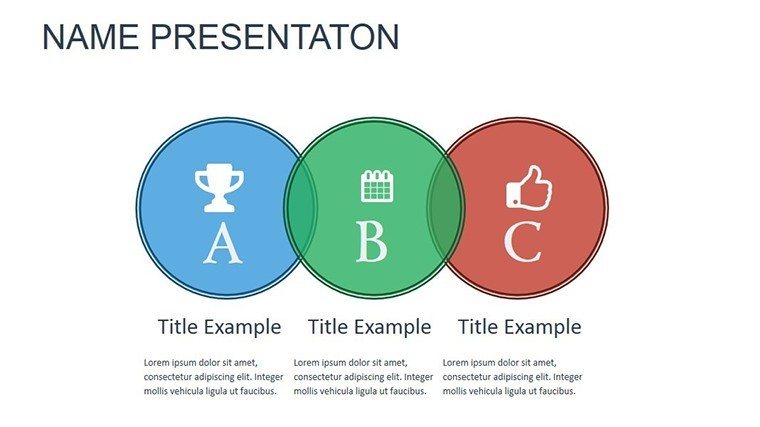
Slide 1: Title slide with professional header and subtitle placeholders. Slide 2: Basic bar chart for simple comparisons. Slide 3: Stacked bar for multi-category data. Slide 4: Line graph for trends. Slide 5: Multi-line for comparative trends. Slide 6: Pie chart basics. Slide 7: Doughnut variation for emphasis. Slide 8: Scatter plot simple. Slide 9: Bubble chart for three-variable data. Slide 10: Combo chart mixing types. Slide 11: Area chart for cumulative data. Slide 12: Radar for multi-axis comparisons. Slide 13: Infographic with icons. Slide 14: Table with embedded graph. Slide 15: Summary slide with key takeaways. Slide 16: Q&A or contact slide.
Each slide comes with placeholders for titles, legends, and axis labels, ensuring accessibility and compliance with standards like those from the American Institute of Graphic Arts (AIGA) for clear data visualization.
Expert Tips for Maximizing Impact
As an SEO and design expert, I recommend starting with color psychology - use blues for trust in financial charts or greens for growth in sustainability reports. Avoid overcrowding; limit data points to 5-7 per chart for cognitive ease. Integrate animations sparingly to reveal data progressively, keeping audiences engaged. For , back your charts with sources; add footnotes linking to reputable data like Statista or industry reports. This builds trustworthiness, crucial for professional contexts.
In workflow integration, link this template with Google Analytics for real-time data pulls, or use it in virtual meetings via Zoom for interactive sessions. A light touch of humor: Ever had a chart so confusing it needed its own presentation? This template ensures that never happens again.
Ultimately, this Professional PowerPoint Charts Template isn't just a download - it's an investment in your communication prowess. Ready to transform how you present data? Download today and start crafting presentations that inspire action.
Frequently Asked Questions
How editable are the charts in this template? Fully editable - change data, colors, fonts, and layouts with ease using PowerPoint's built-in tools.
Is this template compatible with Google Slides? Yes, import the .pptx file directly into Google Slides for seamless use and collaboration.
Can I use this for commercial purposes? Absolutely, it's licensed for professional use in business, education, and more.
What if I need more slides? The template is expandable; duplicate and customize existing slides as needed.
Does it include animation options? Yes, pre-set subtle animations are included, which you can modify or remove.