Christmas PPT Charts - Instant Download


Type: PowerPoint Charts template
Category: Free Templates, Illustrations
Sources Available: .pptx
Product ID: PC00430
Template incl.: 10 editable slides
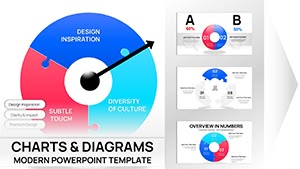
Package Contents for Holiday Charts
10 editable slides come in the free download.
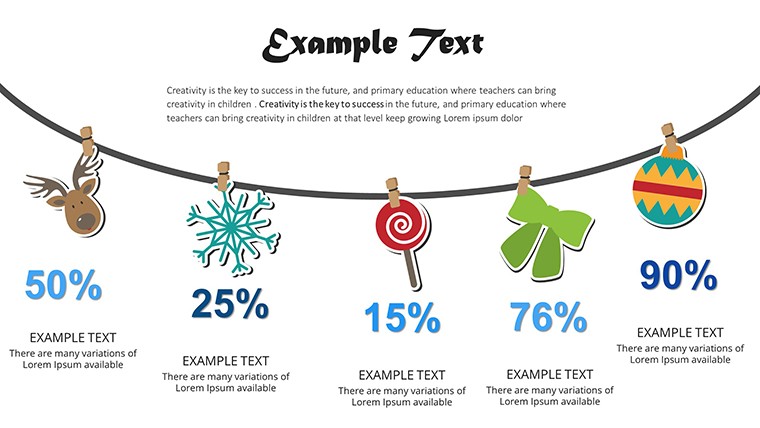
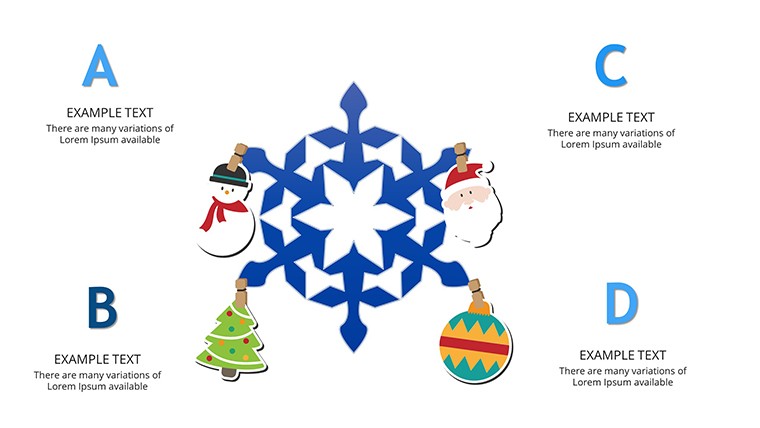
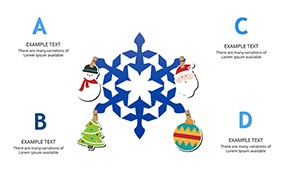
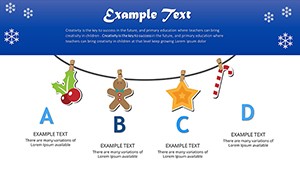
Festive chart layouts combine with animation effects to support both business reports and educational sessions.
Unlike standard process sets this one uses seasonal visual hierarchy and color contrast to maintain engagement during holiday presentations.
Format and Compatibility Details
| Feature | Details |
|---|---|
| Slides / diagrams included | 10 editable festive charts with animations |
| Editable elements | shapes and icons replaceable without regrouping |
| Text placeholders | update across all slides instantly |
| Color theme adjustments | via slide master in PowerPoint 365 |
| Animation support | apply or remove with one click |
| File formats | PPTX for editing and PDF export |
Adapting the Template to Your Brand
Beginner difficulty.
- Step 1 - Open the .pptx file in PowerPoint (1 minute)
- Step 2 - Replace placeholder text (3 minutes)
- Step 3 - Apply brand colors through the master slide palette (2 minutes)
- Step 4 - Adjust chart data and animation timing (4 minutes)
- Step 5 - Export as PPTX or PDF (1 minute)
Three Situations Where This Pays Off
Educators in academic settings use this in training sessions to deliver seasonal lessons that cut preparation time from 2 hours to 30 minutes.
Business pros reuse the file across three year-end reports by swapping color schemes.
Marketing teams adapt the same slides for client proposals during holiday campaigns.
Download the free file and start creating.
Why This Template, Not a Blank Slide
Creating festive charts manually takes 3 hours and moderate design skill.
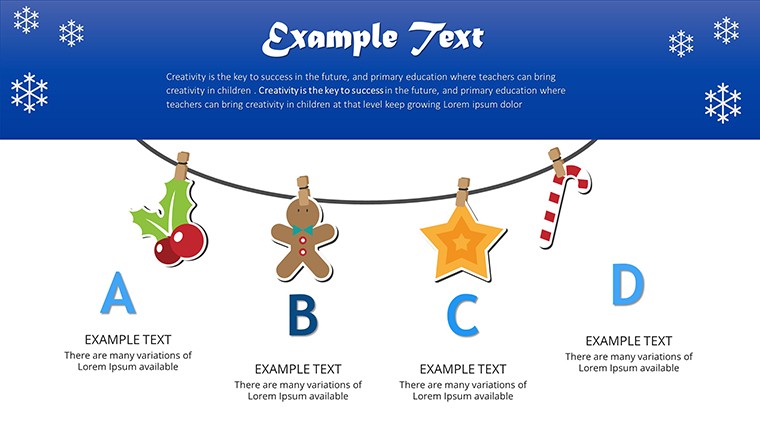
Zone segmentation with holiday icons keeps information spacing clear on large screens.
This layout delivers flow direction that guides the eye without extra effort.
Get the file instantly and present.
PowerPoint Version Compatibility
Which PowerPoint versions open this file?
PowerPoint 2016 and newer including 365 and Mac editions open the PPTX without conversion. Animation effects remain intact.
How do I change the color scheme?
Switch to slide master view, pick new theme colors and apply. All 10 slides update at once.
What does the license allow?
Internal use and client work are permitted. Resale of the template itself is prohibited.
What is included in the free version?
The free version gives full access to all 10 slides and animations at no cost.
What software opens the file?
PowerPoint 2016 or newer opens the PPTX. PDF export works for sharing.
What is the refund policy?
Since the file is free no refund applies but support is available if the download fails.
Educators often pair these charts with free templates for seasonal lessons.
Teams adapt the animations for internal reporting.
Professionals seeking festive visuals check holiday themed sets.