3D Puzzle Pie Charts PowerPoint Template


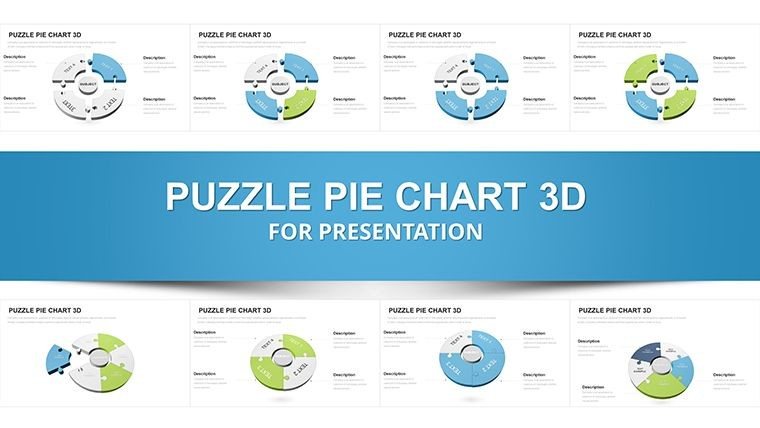


In high-stakes boardrooms and investor meetings, I`ve seen flat pie charts fall short time and again - audiences glaze over as proportions blend into forgettable slices. That`s why I rely on this 3D puzzle pie chart PowerPoint template to transform standard data breakdowns into engaging, interlocking visuals that drive home how every piece contributes to the whole.
With 45 ready-to-use slides, this collection turns complex allocations into clear, three-dimensional puzzle assemblies. The elevated design adds depth literally and figuratively, helping executives and teams grasp interconnections at a glance during quarterly reviews or strategy sessions.
Whether dissecting market segments or resource distributions, these puzzle-motif pies ensure your message sticks long after the presentation ends.
Exploring the Versatile Layouts in This 3D Puzzle Pie Collection
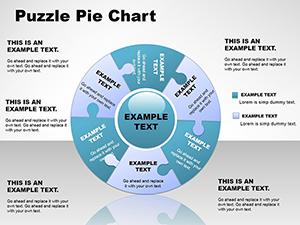
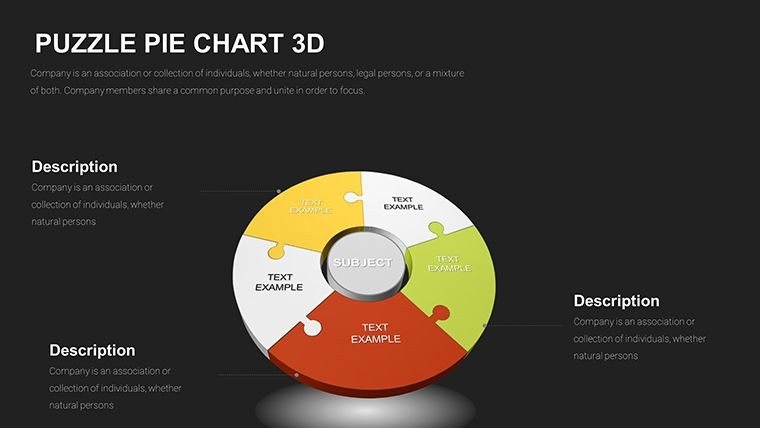
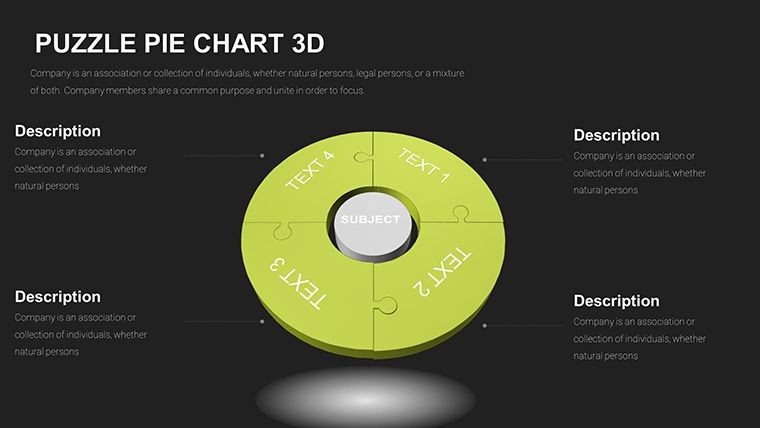
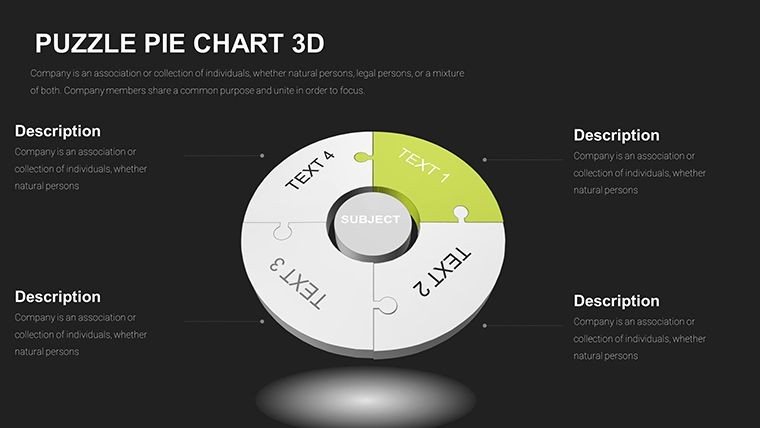
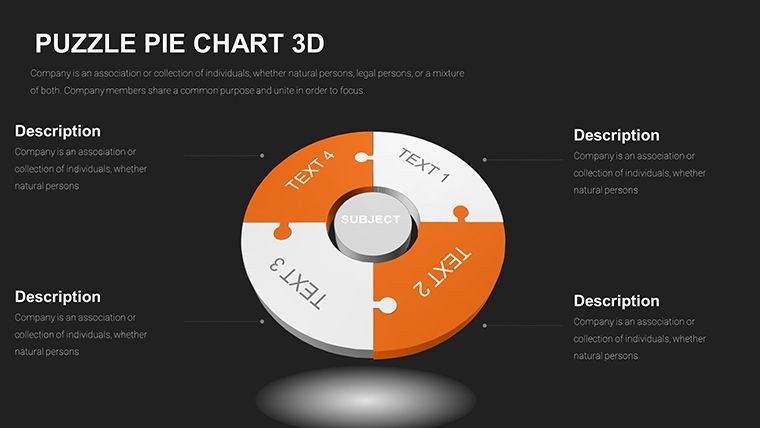
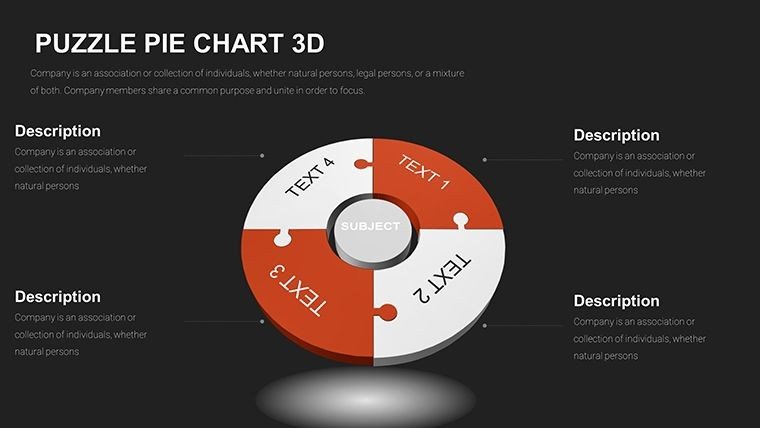
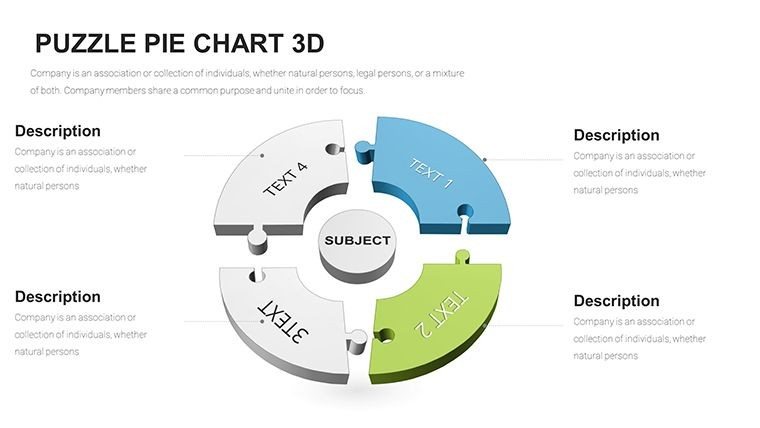
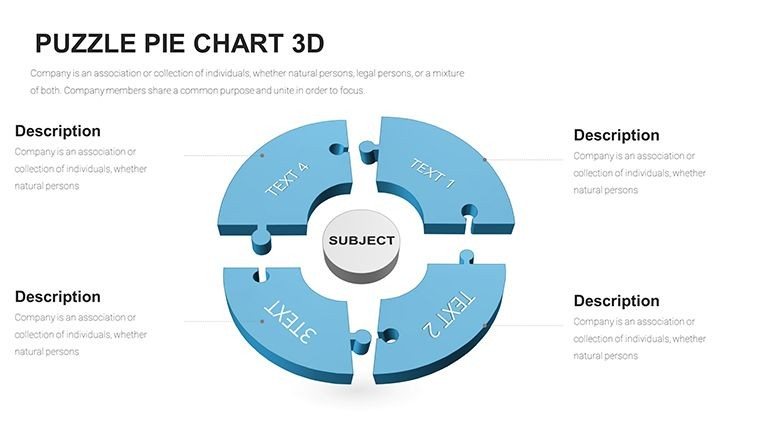
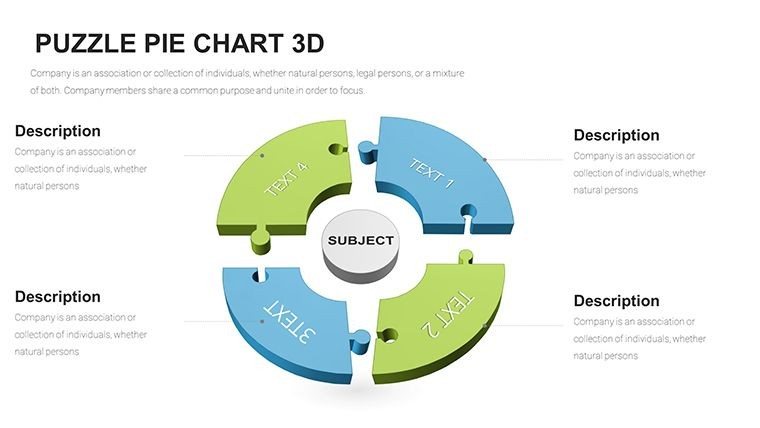
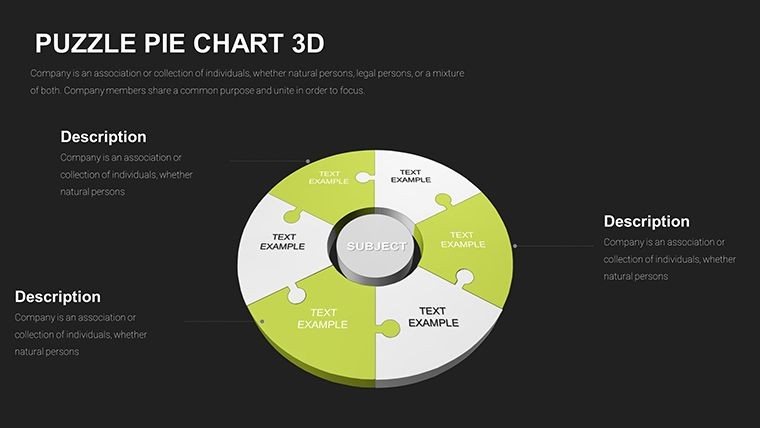
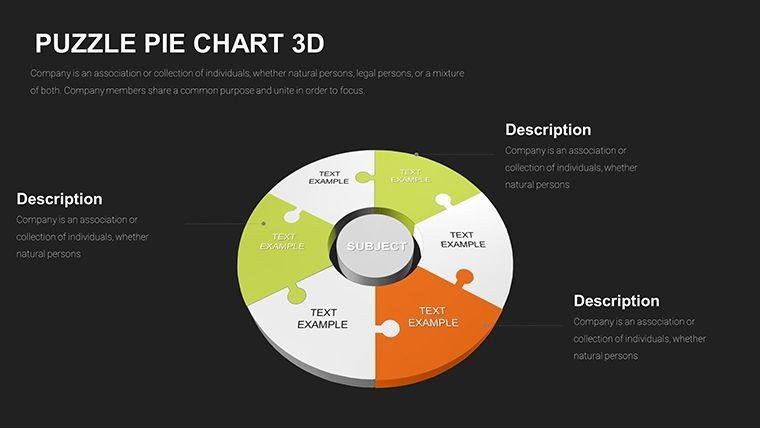
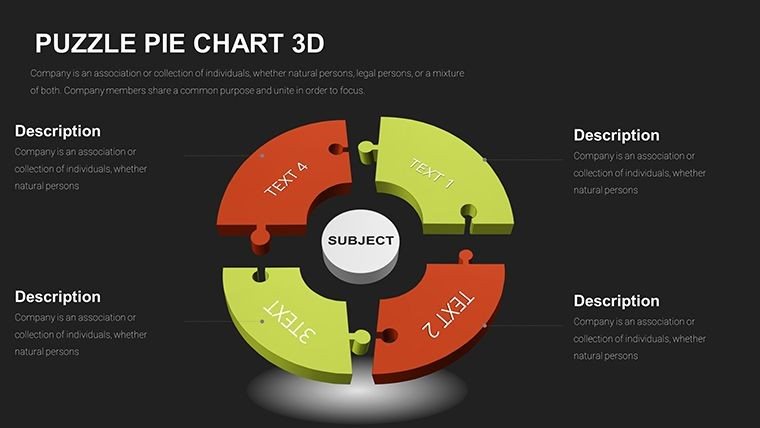
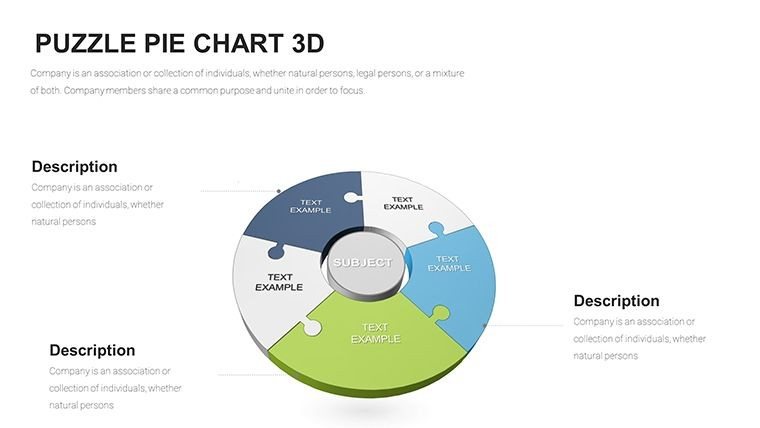
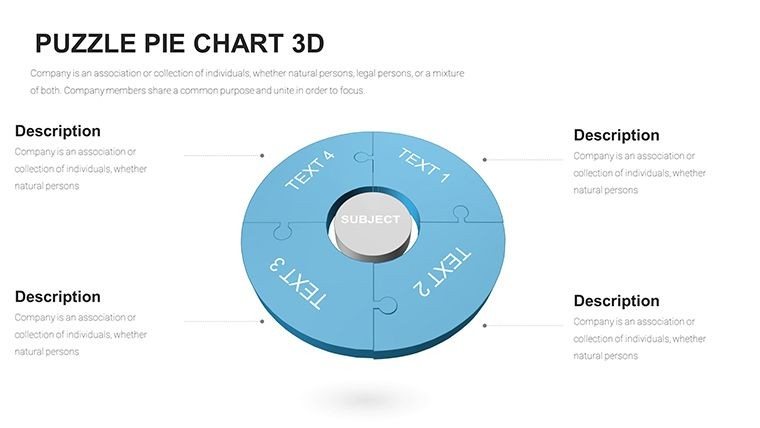
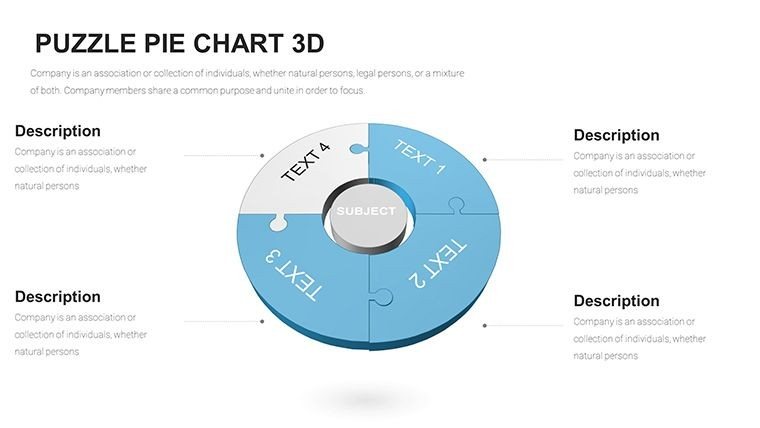
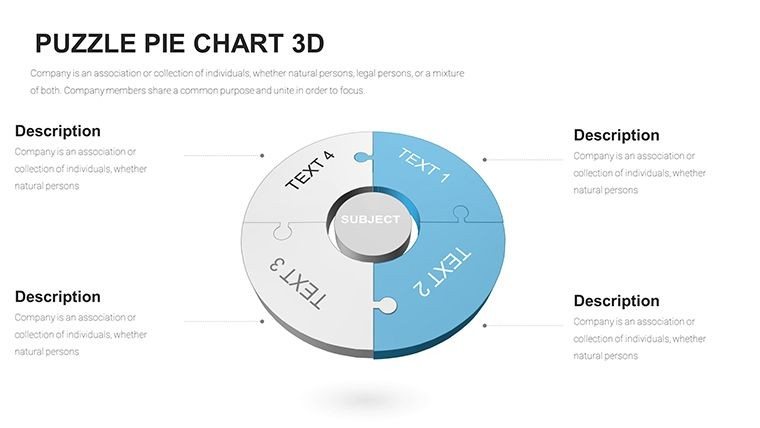
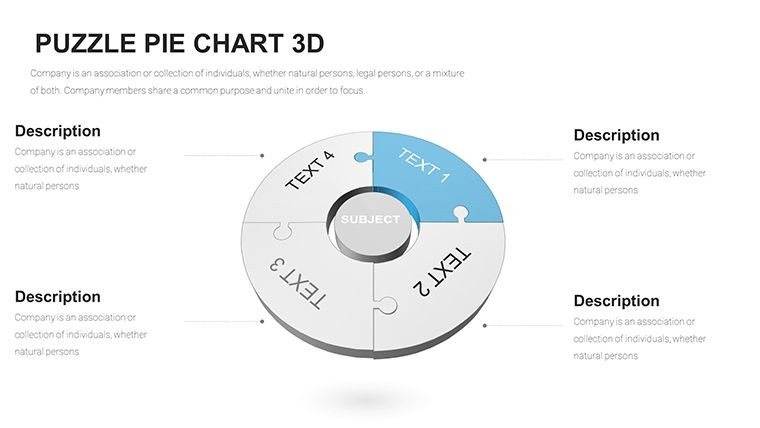
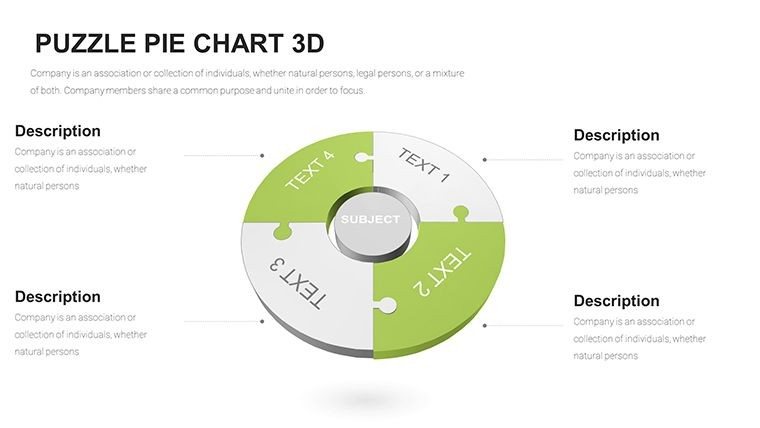
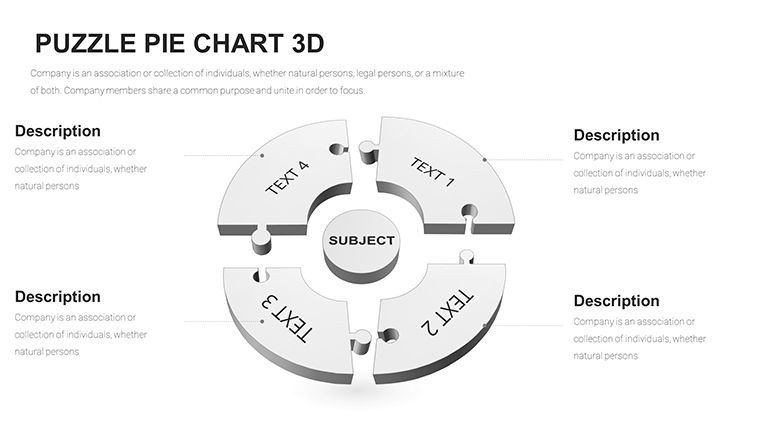
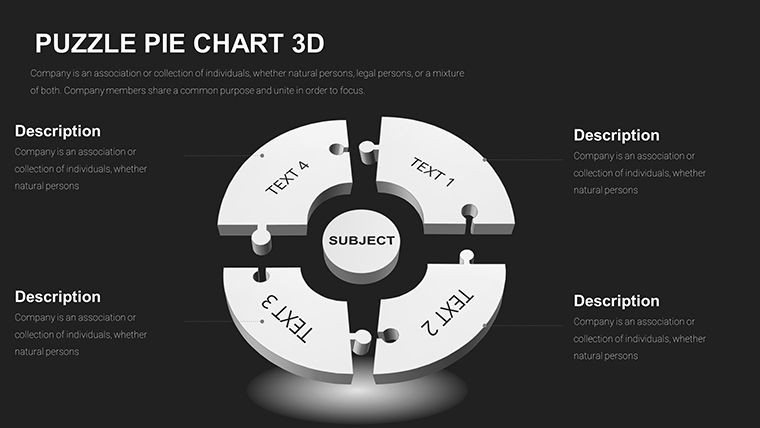
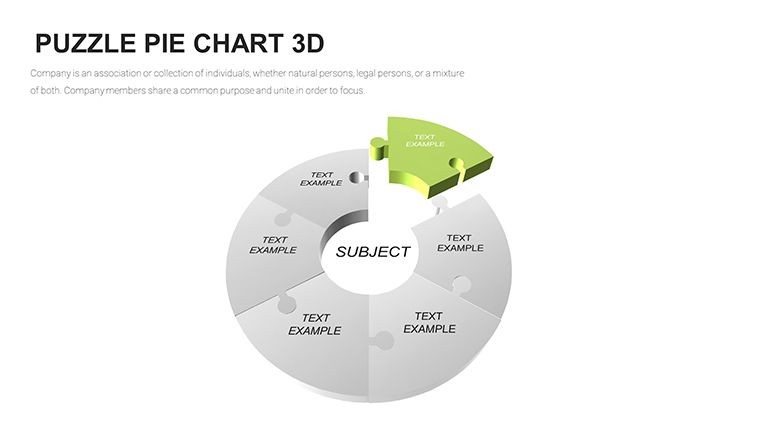
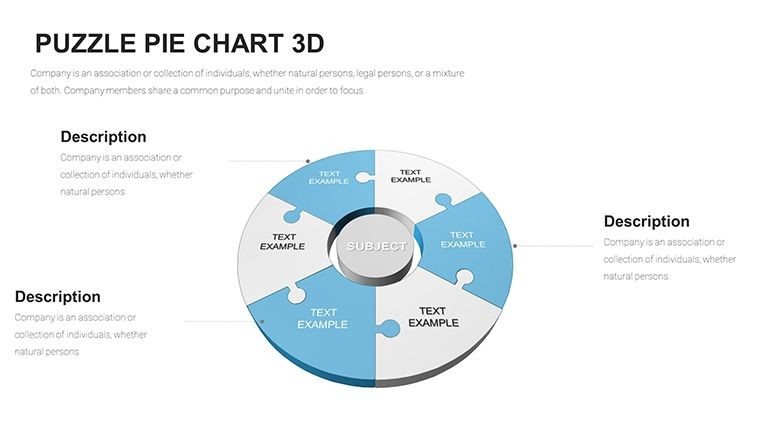
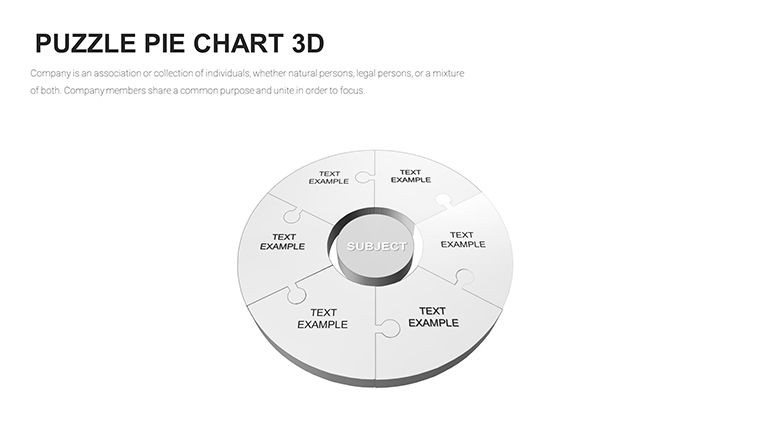
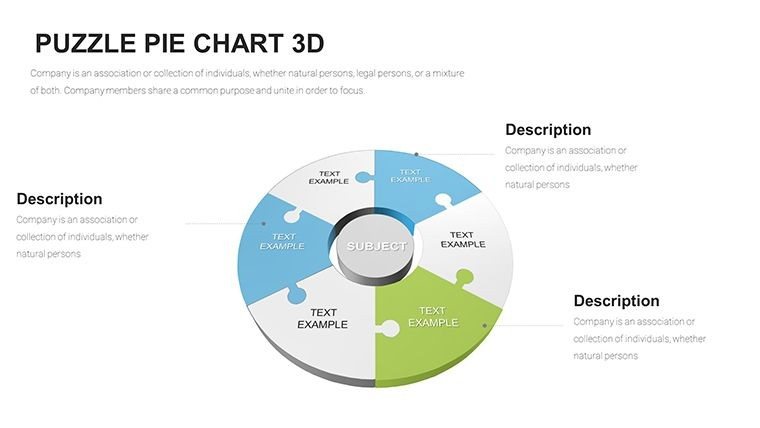
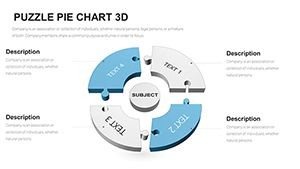
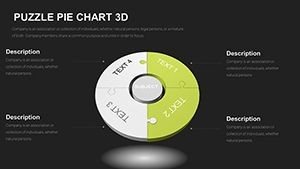
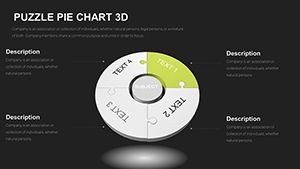
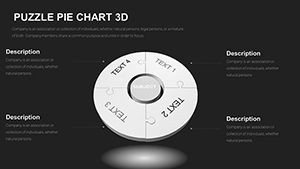
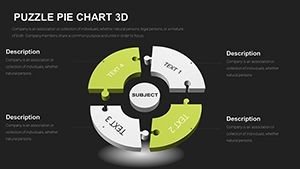
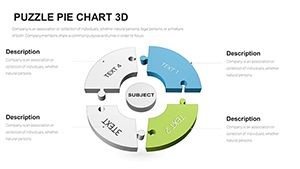
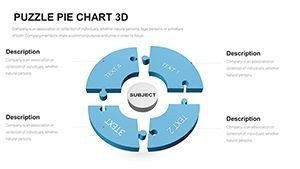
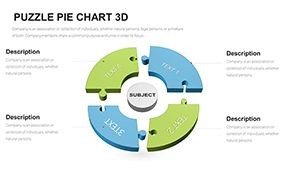
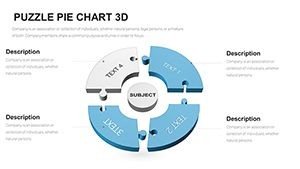
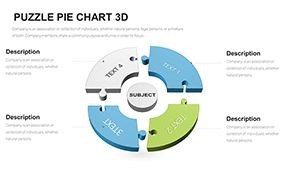
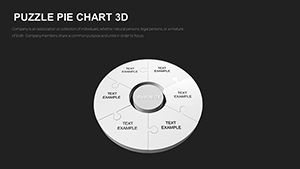
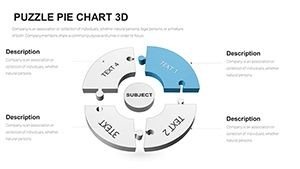
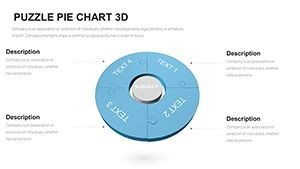
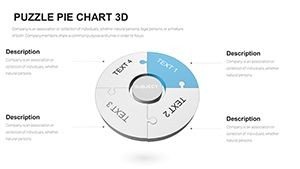
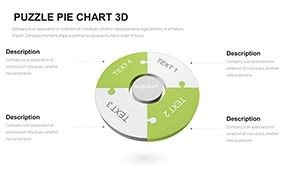
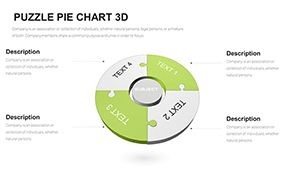
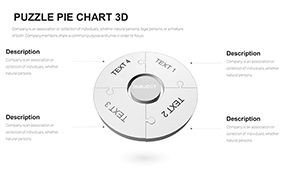
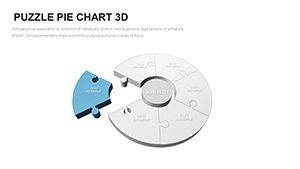
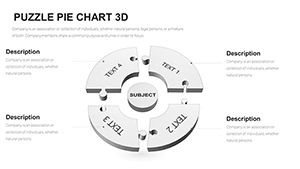
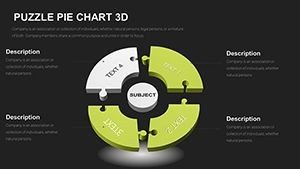
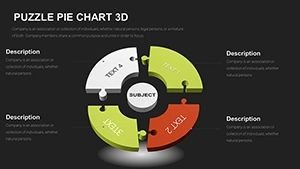
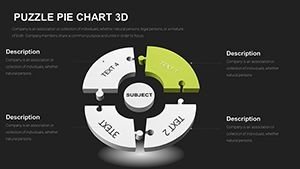
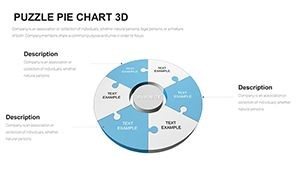
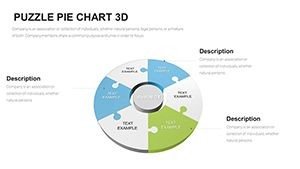
Each slide builds on the core concept of interlocking puzzle segments forming a complete pie, with variations tailored to different data needs.
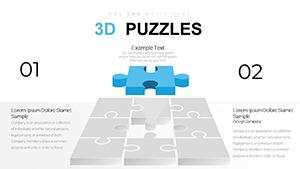
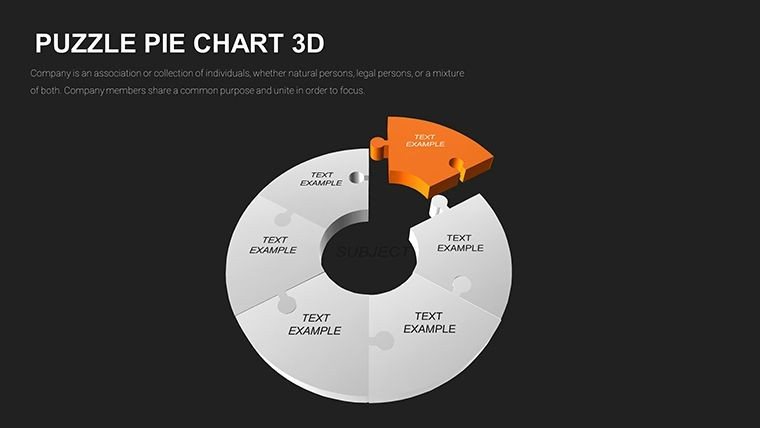
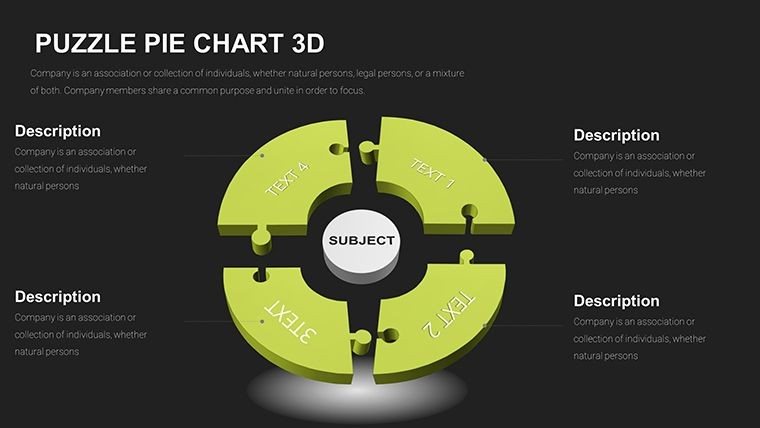
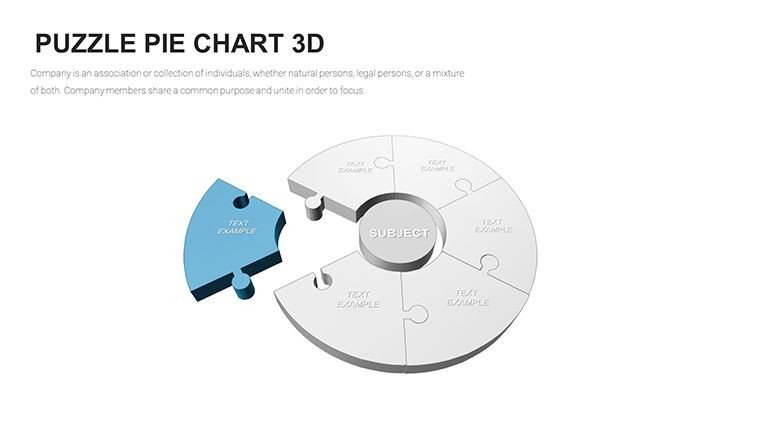
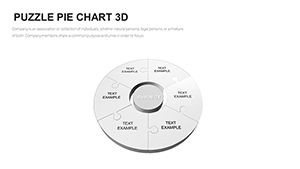
- Multi-segment foundations: Core layouts support up to 20 distinct pieces, ideal for detailed breakdowns where every category demands visibility.
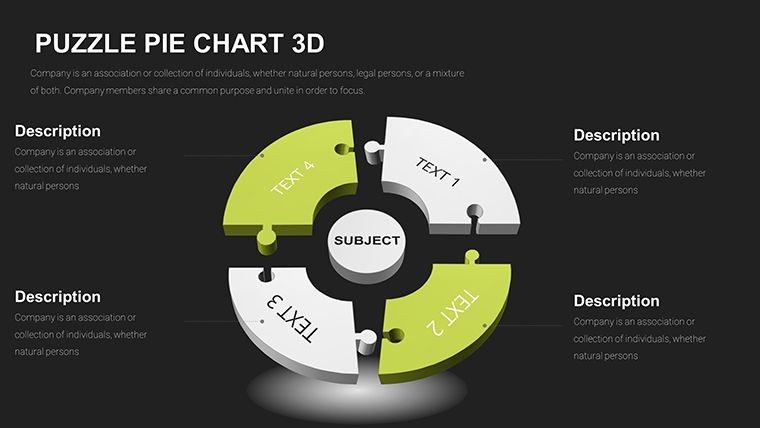
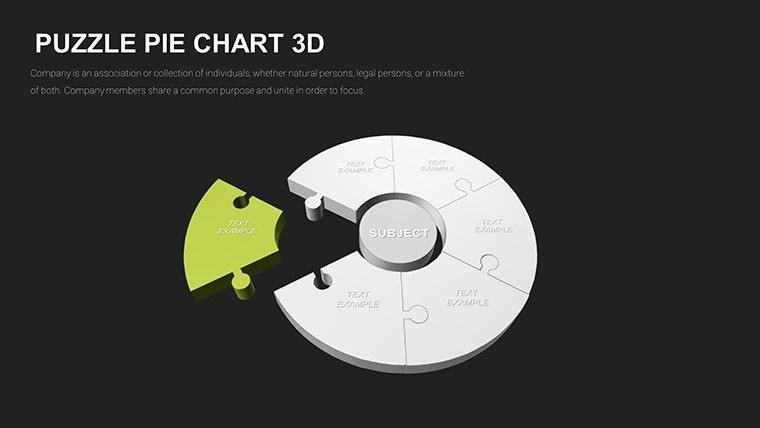
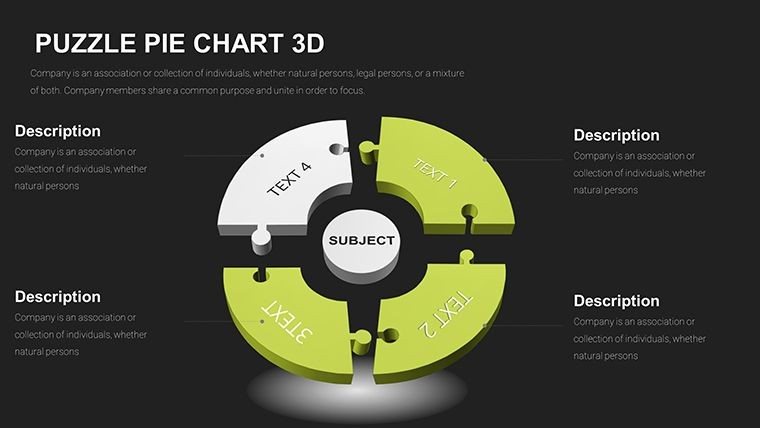
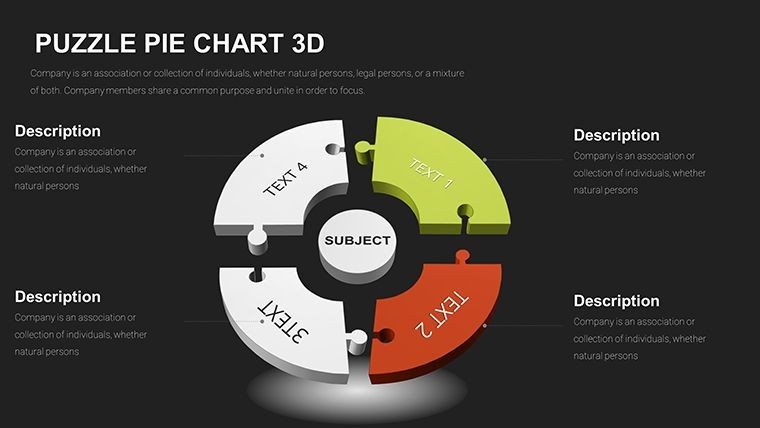
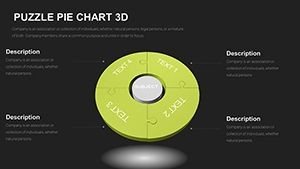
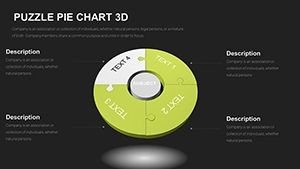
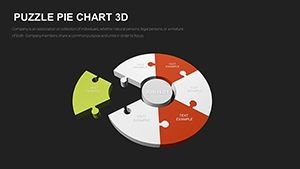
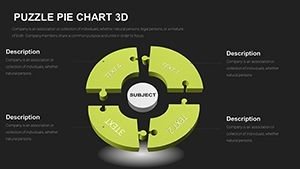
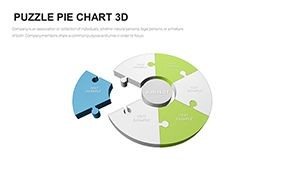
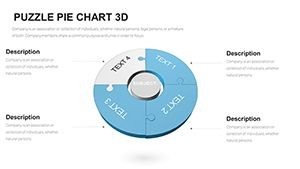
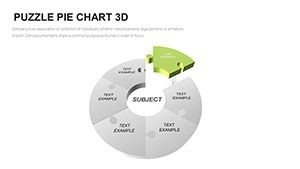
- Depth and rotation options: Adjustable 3D angles let you highlight specific segments by tilting or zooming, drawing attention exactly where needed.
- Assembly animation sequences: On-click builds where puzzle pieces snap together progressively reveal data stories step by step.
- Embedded text and icon zones: Dedicated areas within each segment for percentages, labels, or custom icons without cluttering the visual.
- Shadow and texture controls: Fine-tune realism with customizable gradients and elevations for professional polish.
The color-blind accessible palettes ensure inclusivity, while full editability means swapping hues to match corporate branding takes seconds.
Real-World Applications for These Interlocking Pie Visuals
In my consulting work with enterprise clients, these 3D puzzle pie charts shine when illustrating interdependent elements.
During a recent Fortune 500 strategy offsite, we used the assembly-style slides to map out ecosystem partnerships - each puzzle piece represented a stakeholder contribution, animating into place as we discussed alignment risks.
Project managers in agile environments appreciate the milestone variants, where segments lock together to show how deliverables fit into overall program success.
Educators teaching systems thinking deploy the biodiversity examples to demonstrate species interdependence in environmental reports.
Startup founders pitching revenue models benefit from the segmented revenue stream layouts that emphasize how diverse sources complete the financial picture.
Seamless Integration Into Your Existing Presentation Workflow
This template slots directly into decks built in PowerPoint 2016 or later, with full compatibility for Google Slides imports.
Drop in your data, adjust segment sizes via simple drag handles, and apply brand colors across all 45 slides in minutes. The one-time download provides lifetime access, meaning you can revisit and refine these visuals for recurring reports without starting over.
I`ve cut preparation time dramatically for client deliverables by maintaining a master deck with these puzzle pies ready for quarterly updates.
Practical Scenarios From Executive and Team Presentations
When advising C-level teams on portfolio optimization, the interlocking design perfectly conveys how divesting one unit affects the entire business puzzle.
In government grant proposals, we`ve visualized funding allocations across initiatives, with animated assembly underscoring collaborative requirements.
Marketing directors reviewing campaign performance use the consumer preference segments to highlight how channels fit together for total reach.
HR leaders presenting diversity metrics find the multi-piece layouts ideal for showing intersectional representation across departments.
Advantages Over Standard Approaches
| Aspect | This 3D Puzzle Pie Template | Default PowerPoint Pies | Building Custom From Scratch |
|---|---|---|---|
| Visual Engagement | Interlocking 3D puzzle motif creates memorable metaphors for interconnected data | Flat, static slices often overlooked | Hours spent aligning shapes manually |
| Animation Control | Built-in progressive assembly sequences | Limited basic entrances | Complex timing setups required |
| Customization Speed | Drag-to-resize segments, instant color matching | Manual formatting per chart | Extensive design work per use |
| Segment Capacity | Clean handling of up to 20 pieces | Cluttered beyond 8-10 slices | Layout breaks with complexity |
| Professional Depth | Adjustable shadows, rotations, textures | Basic 2D appearance | Inconsistent results without expertise |
Ready to make your proportion data truly interconnect in viewers` minds? Download this 3D puzzle pie chart template today and start building more impactful presentations.
Industry-Specific Applications for Puzzle Pie Visualizations
Finance teams mapping investment portfolios across asset classes find the interlocking segments perfect for risk distribution discussions.
Technology product managers illustrate feature prioritization, showing how components complete the user experience puzzle.
Healthcare administrators presenting patient care pathways use assembly animations to emphasize coordinated services.
Academic researchers detailing ecological balances deploy biodiversity-focused layouts for grant committees.
Marketing analysts reviewing multichannel attribution credit contributions across touchpoints with clear visual fitting.
Consultants delivering operational efficiency reports highlight process interdependencies that form organizational success.
Frequently Asked Questions
How many segments can these 3D puzzle pie charts accommodate clearly?
The layouts maintain readability up to 20 distinct pieces through thoughtful spacing and optional exploded views. For denser data, complementary slides offer highlighted subsets while showing the complete assembly.
Are the assembly animations customizable in timing and order?
Yes - each piece`s entrance, rotation, and snap-in effect can be reordered or adjusted in the animation pane, allowing you to control reveal sequence for narrative flow.
Can I import these slides directly into Google Slides?
Absolutely. Upload the .pptx file, and all 3D effects, animations, and editability translate seamlessly for cloud-based collaboration.
Do the templates include options for embedding icons within puzzle pieces?
Dedicated placeholder zones in each segment accept icons, logos, or small graphics alongside percentage labels for richer contextual storytelling.
Is branding consistent across all 45 slides easy to apply?
Master slide controls and theme colors make global updates instantaneous - change primary hues once, and every puzzle pie reflects your corporate palette.
Transform how your audiences perceive proportional data with these dynamic 3D puzzle pie charts. Instant access means elevating your next presentation is just moments away.