Professional Pie Chart PowerPoint Template: Visualize Data with Precision


Type: PowerPoint Charts template
Category: Relationship, Pie
Sources Available: .pptx
Product ID: PC00004
Template incl.: 37 editable slides
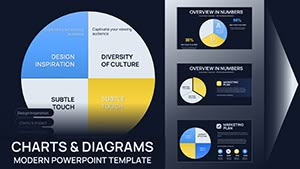
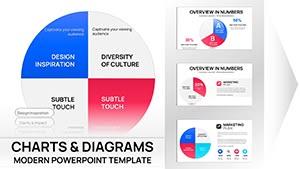
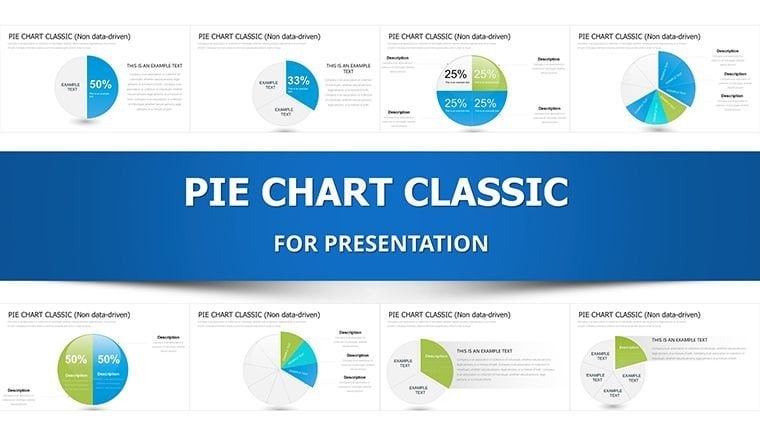
Imagine transforming dry numbers into a compelling narrative that captivates your audience, whether you're pitching a quarterly budget to stakeholders or breaking down market shares in a sales meeting. The Pie Classic PowerPoint Charts Template is your go-to toolkit for just that. With 37 meticulously crafted, fully editable slides, this template turns abstract data into intuitive pie charts that highlight proportions, percentages, and distributions effortlessly. Designed for professionals in business, finance, marketing, and education, it ensures your presentations aren't just informative - they're unforgettable.
What sets this template apart? It's not your standard clip-art filler; these charts draw from proven visualization principles, like those championed by data experts at Tableau and Edward Tufte, emphasizing clarity over clutter. Whether you're allocating resources in a project plan or illustrating customer demographics, the clean lines and customizable elements let you adapt on the fly. Compatible with PowerPoint and Google Slides, it's a time-saver that aligns with your brand's aesthetic - think sleek corporate blues or vibrant startup pops of color.
Unlock the Versatility of Pie Charts in Your Workflow
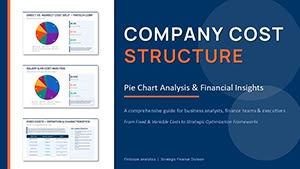
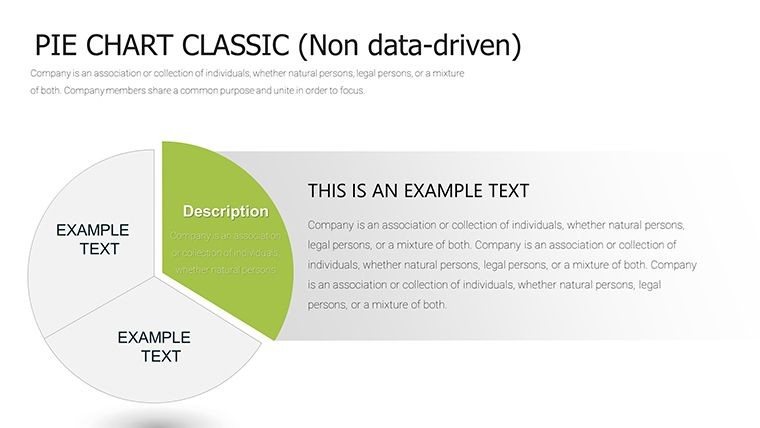
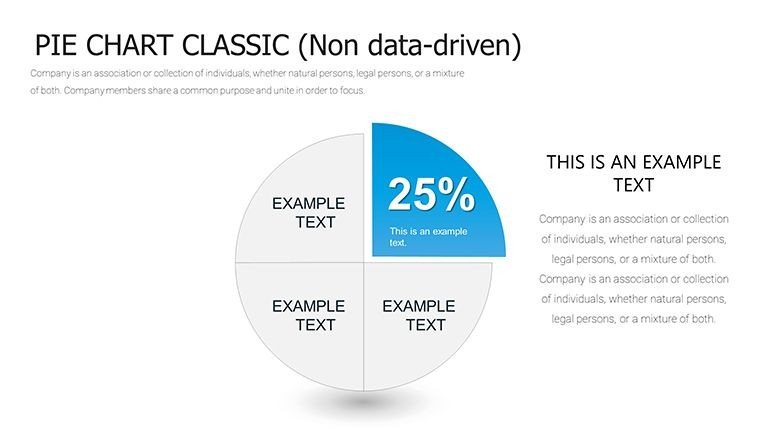
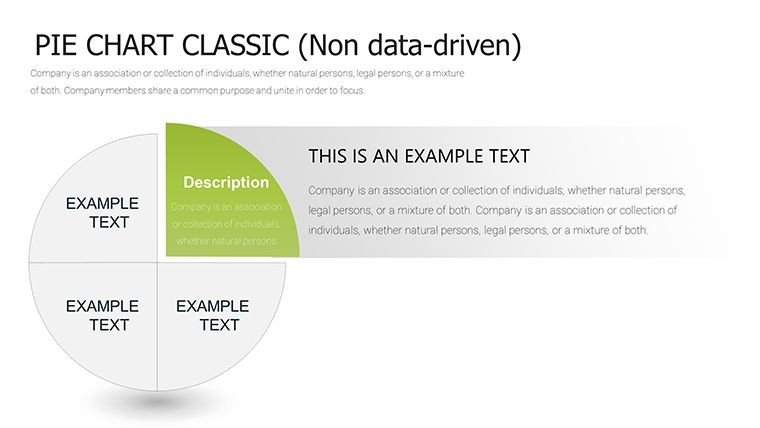
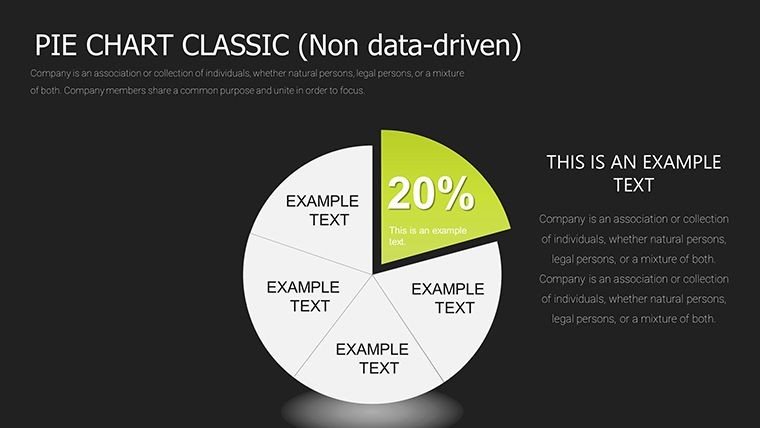
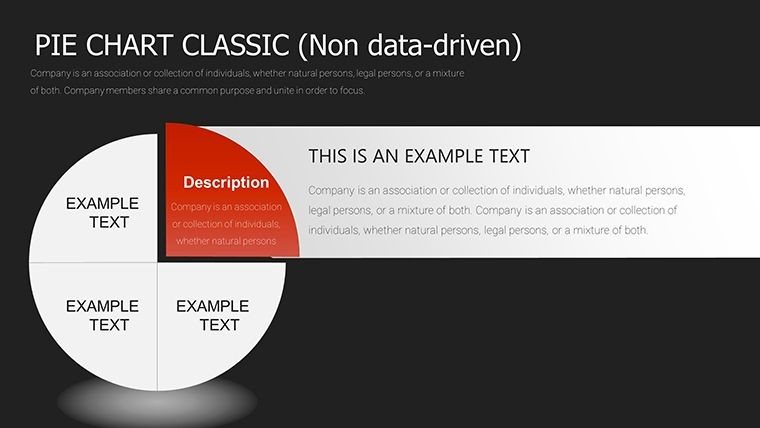
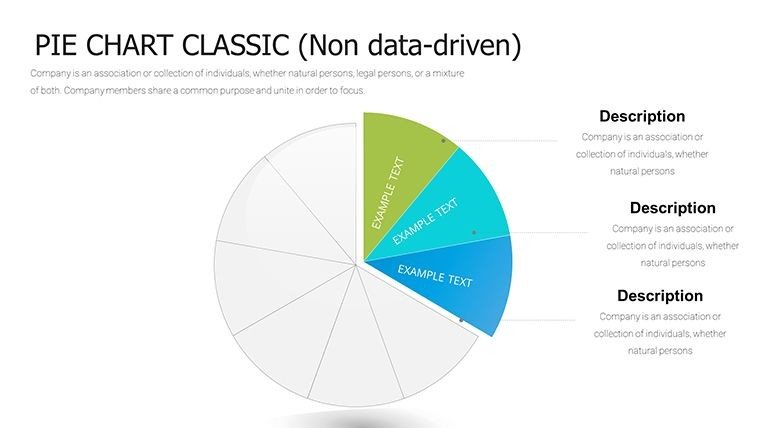
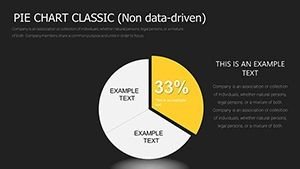
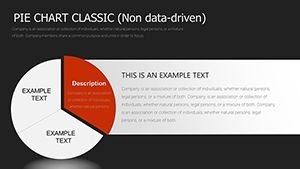
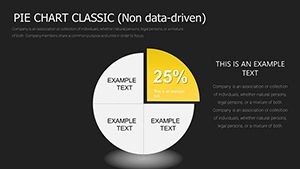
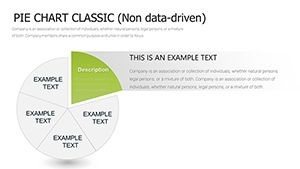
Pie charts have long been a staple in data storytelling because they excel at showing how parts contribute to a whole. In this template, we've expanded beyond basics to include donut variations, exploded segments, and multi-level pies for deeper insights. For instance, slide 12 features a nested pie that layers departmental expenses within overall budgets, ideal for finance teams dissecting annual reports.
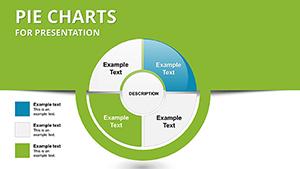
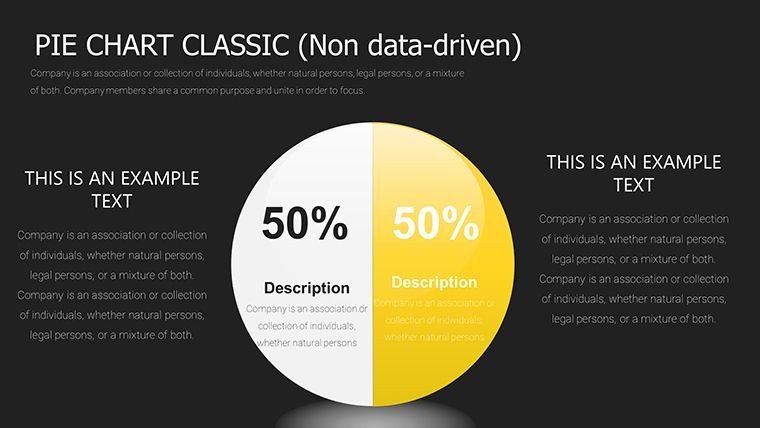
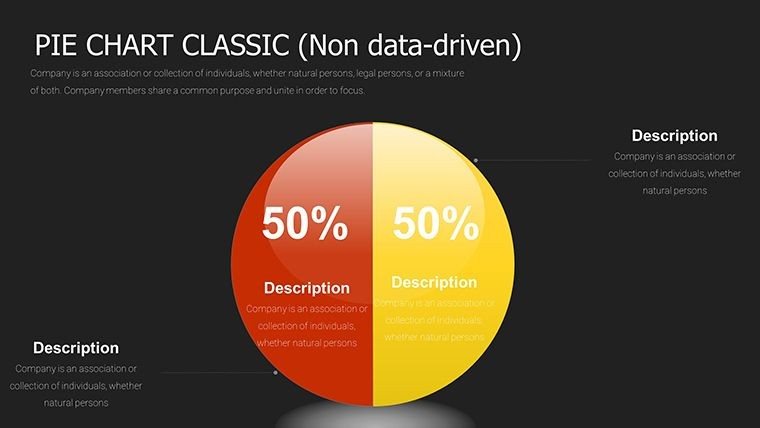
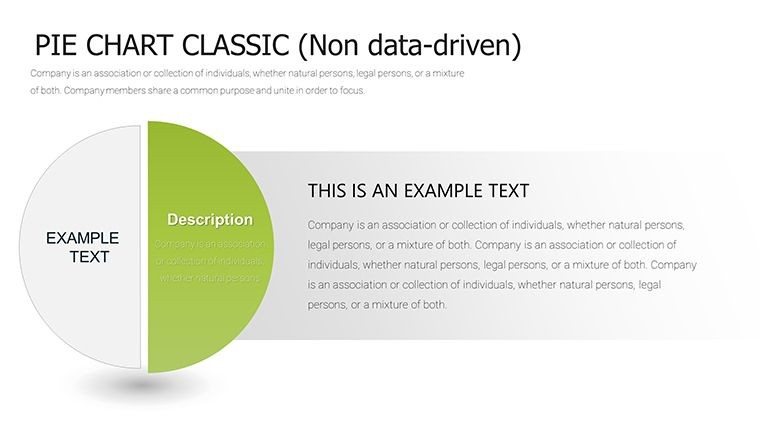
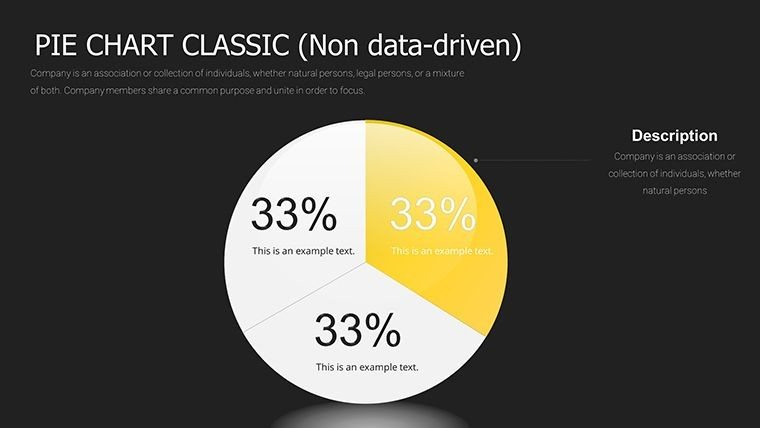
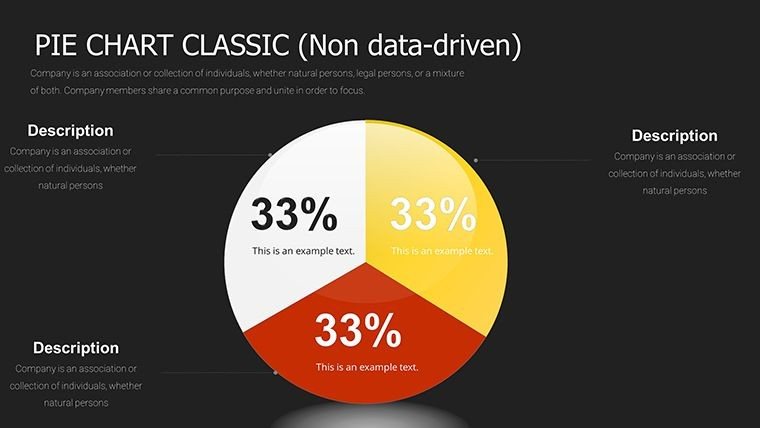
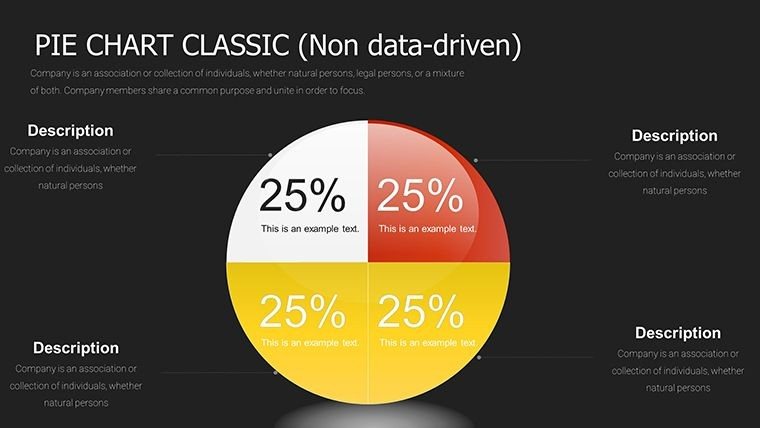
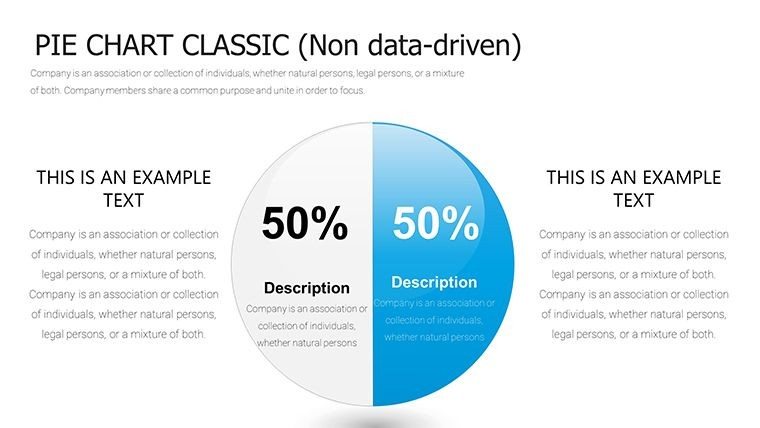
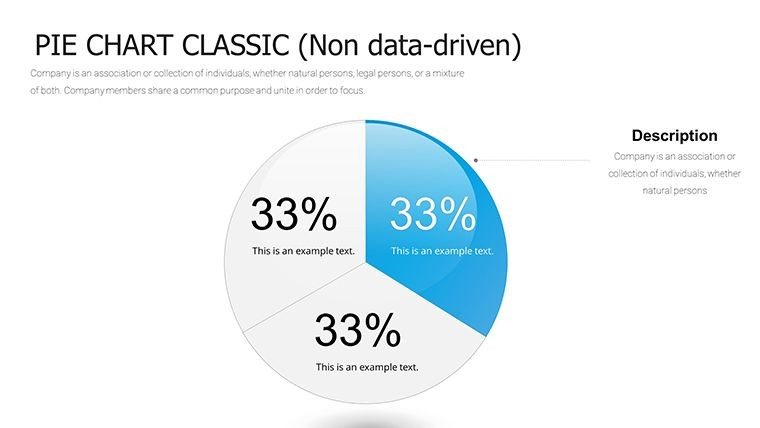
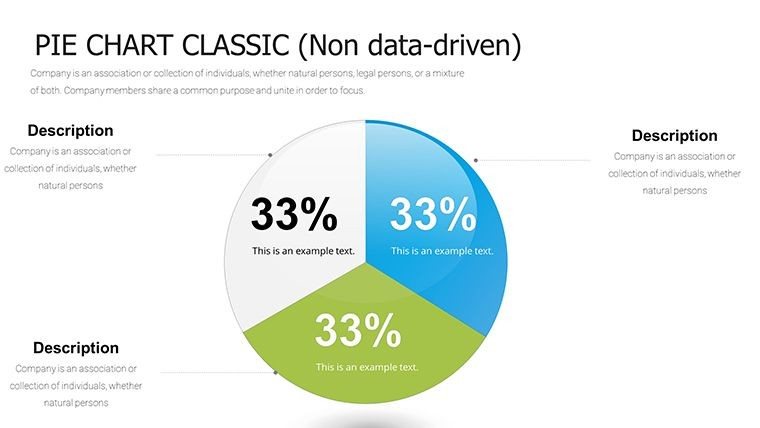
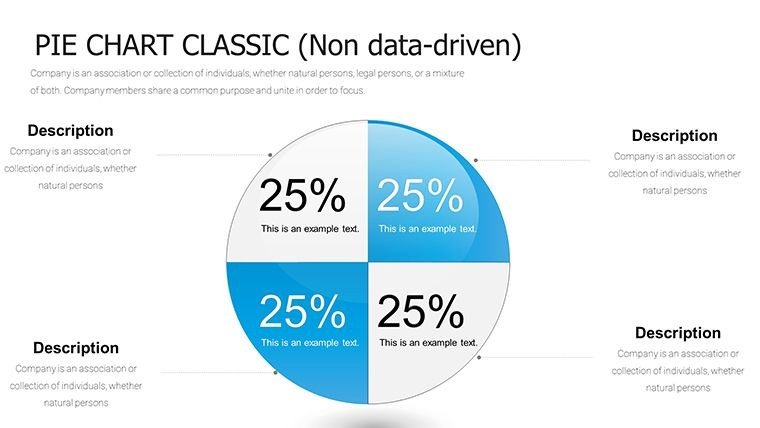
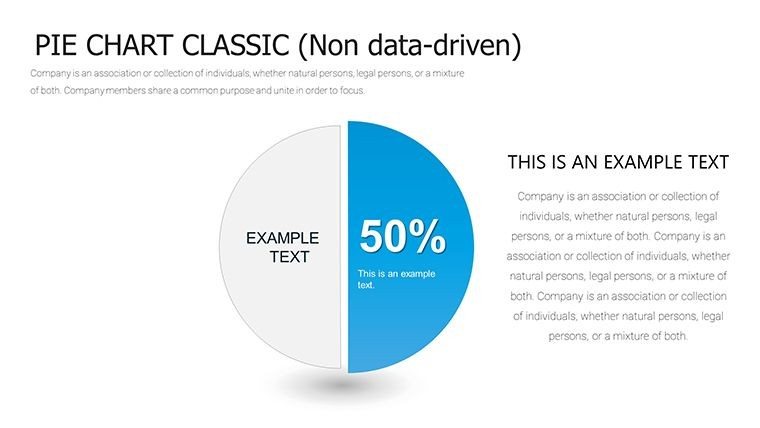
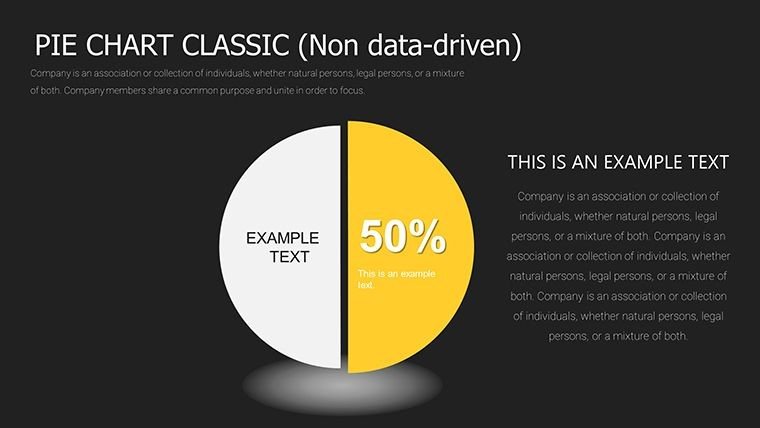
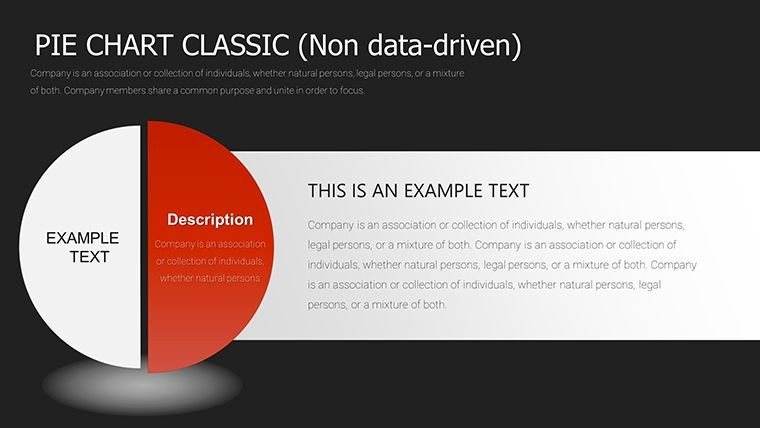
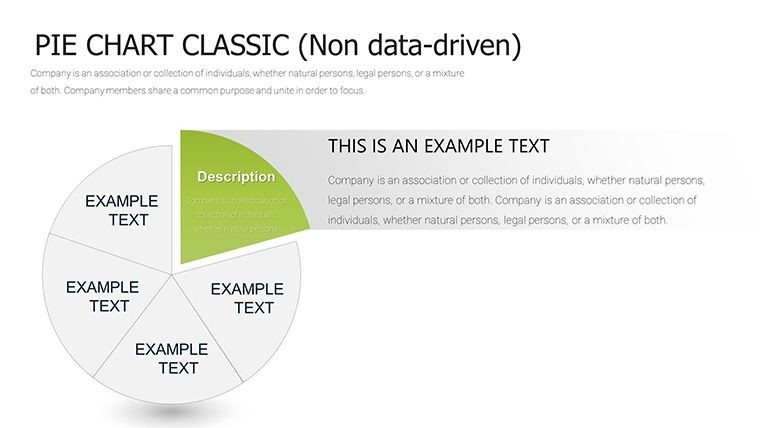
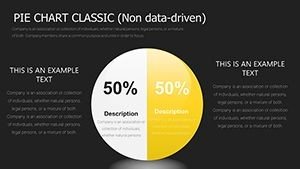
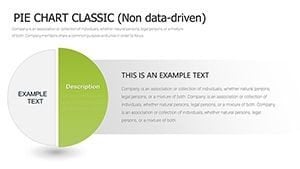
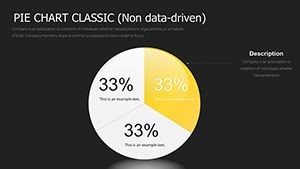
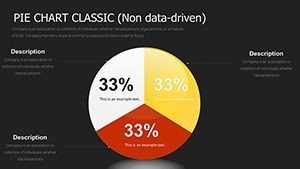
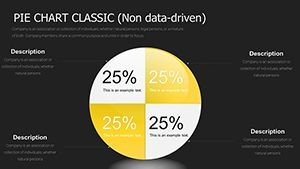
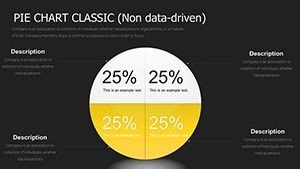
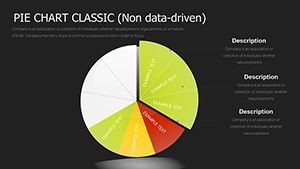
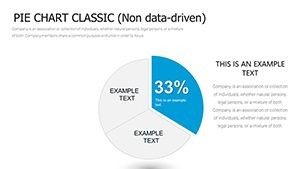
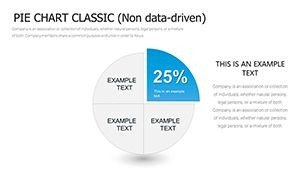
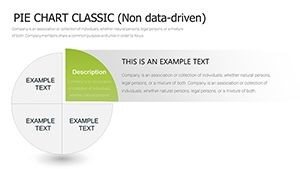
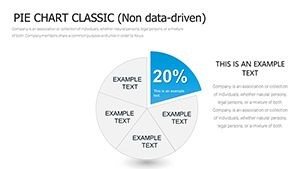
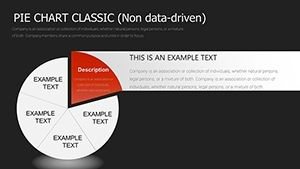
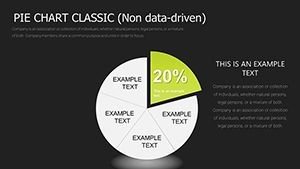
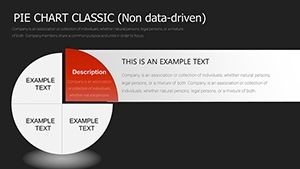
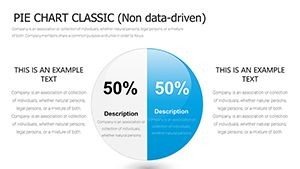
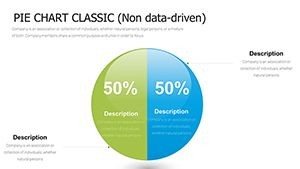
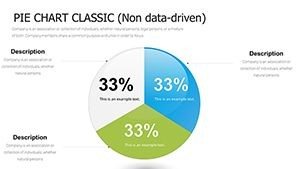
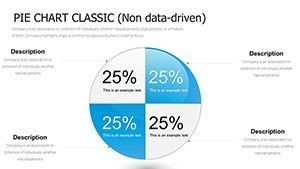
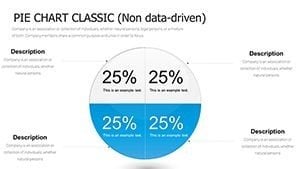
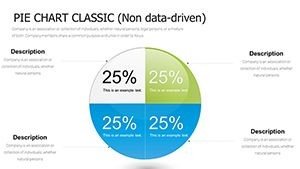
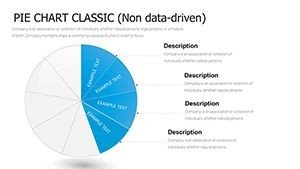
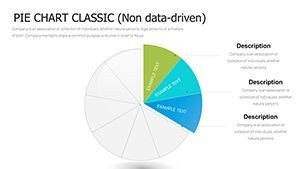
- Simple Pie Basics: Start with straightforward slices on slides 1-5, perfect for quick overviews like sales by region - edit labels in seconds to reflect your latest figures.
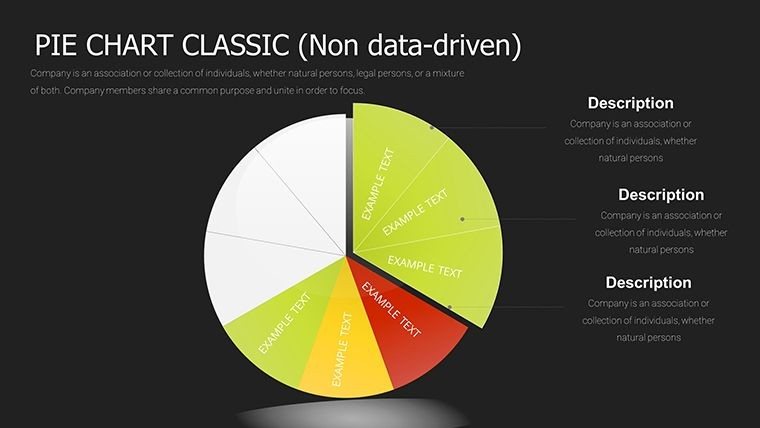
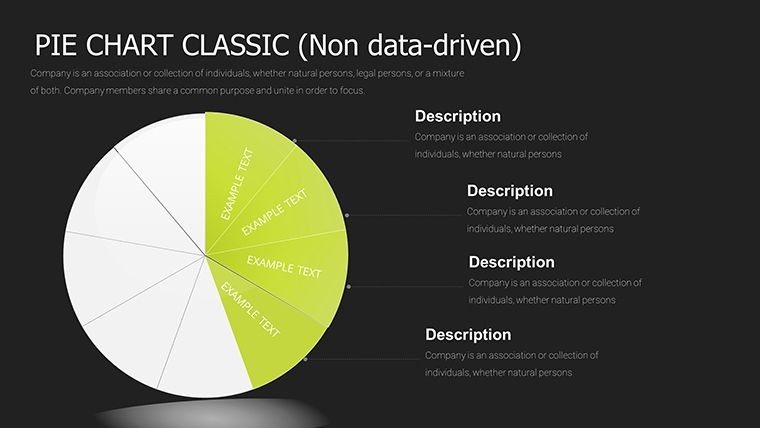
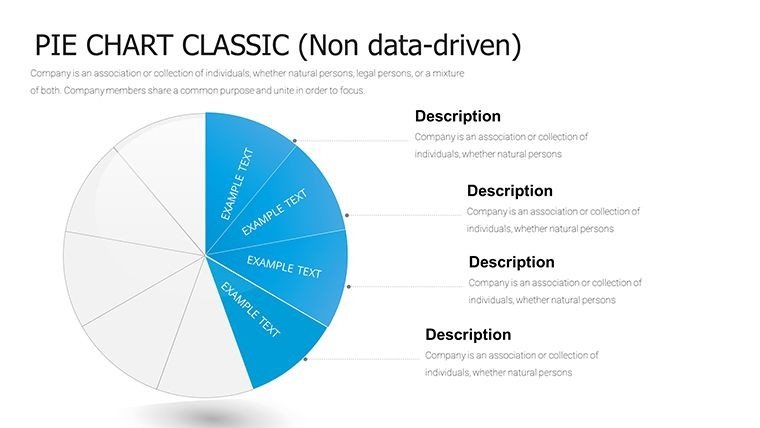
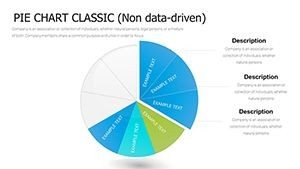
- Advanced Multi-Layered Designs: Dive into slides 20-25, where concentric pies reveal hierarchical data, such as product categories breaking into sub-variants, helping consultants map client portfolios.
- Interactive Elements: Hyperlink-enabled segments on slide 30 allow seamless navigation to detailed backups, turning your deck into an interactive dashboard.
Customization is a breeze: Swap color schemes via the master slide, tweak fonts for accessibility (we recommend sans-serif like Arial for readability), and resize without distortion. This isn't just about looks - it's about impact. A Harvard Business Review study notes that visual aids like these can boost audience retention by up to 65%, making your key metrics stick.
Real-World Applications: From Boardrooms to Classrooms
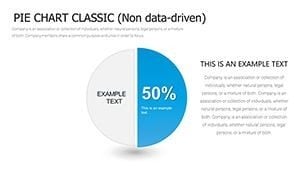
Picture this: A marketing director at a mid-sized firm uses slide 8's gradient pie to showcase campaign ROI, where each slice color-codes channels like social media versus email. The result? Stakeholders nod in agreement, greenlighting the next phase without endless Q&A. Or consider educators: A professor illustrating population demographics in a sociology class leverages slide 15's 3D pie for global migration stats, sparking lively discussions that go beyond rote memorization.
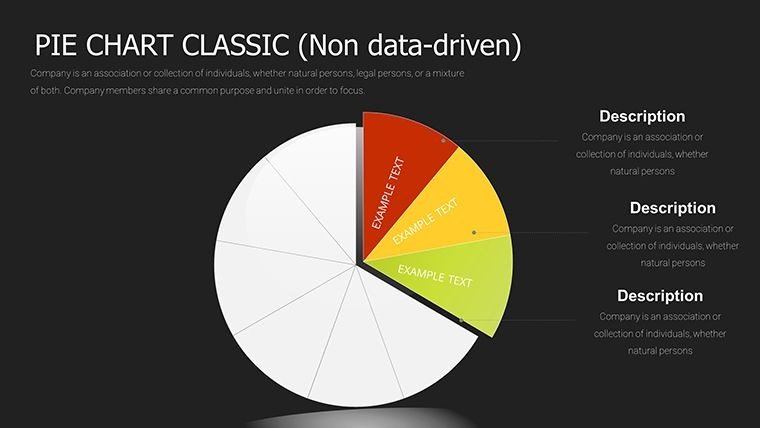
In consulting, where precision matters, this template shines for competitive analysis. Slide 22's comparative pies side-by-side your firm's market position against rivals, drawing from methodologies like SWOT but visualized for instant comprehension. We've even tailored options for non-profits, with subtle icons on slide 35 for donor allocation breakdowns - proving data viz isn't just for suits.
- Prep Your Data: Import Excel sheets directly into PowerPoint for auto-updates.
- Layer Insights: Use animations to reveal slices sequentially, building suspense in pitches.
- Export Seamlessly: Convert to PDF for handouts or embed in reports for hybrid meetings.
Why This Template Outshines Basic PowerPoint Tools
Stock PowerPoint charts often feel generic, lacking the polish that screams "expert." Our Pie Classic template counters that with pre-built animations, vector icons (over 50 included), and responsive layouts that scale across devices. Compared to free alternatives, it saves hours - no more wrestling with alignment grids or recoloring drudgery. Plus, it's optimized for high-res exports, ensuring crisp visuals even on 4K projectors.
Integrate it into your workflow effortlessly: Pair with tools like Canva for quick mocks or Zapier for automated data pulls. For teams, the .pptx format supports collaboration in real-time via OneDrive. And let's not forget accessibility - built-in alt text prompts and high-contrast modes align with WCAG standards, showing your commitment to inclusive design.
Users rave about the ROI: One Fortune 500 analyst shared how it streamlined their investor updates, cutting prep time by 40%. That's the magic - turning data dread into presentation pride.
Pro Tips for Pie Chart Mastery
To maximize value, limit slices to 5-7 for scannability, as per Nielsen Norman Group's UX research. Use contrasting colors for emphasis, and always include a legend that's legible from afar. For dynamic decks, experiment with slide 28's animated build-up, revealing contributions one by one to guide narratives like funding waterfalls.
Ready to slice through the noise? Download the Pie Classic Template today and watch your data dialogues transform. Or explore our relationship charts for complementary visuals.
Frequently Asked Questions
What makes these pie charts editable?
All 37 slides are fully vector-based, allowing drag-and-drop edits for colors, data inputs, and labels without quality loss.
Is it compatible with Google Slides?
Yes, seamless import - retains animations and formatting for cross-platform use.
Can I use this for commercial projects?
Absolutely, with unlimited rights for business, education, or personal decks.
How do I add my own data?
Simply copy-paste from Excel or edit placeholders; auto-recalculates percentages.
Are there animation options?
Pre-set fades and spins on key slides - customize timing in PowerPoint's animation pane.
What's the file size and formats?
Compact .pptx at under 5MB; also available in .potx for templates.