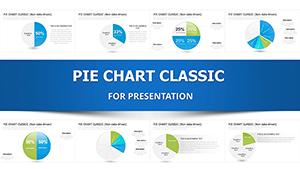
Cycle Pie PowerPoint Charts Template: Spin Cycles into Stories


Type: PowerPoint Charts template
Category: Relationship, Pie
Sources Available: .pptx
Product ID: PC00001
Template incl.: 27 editable slides
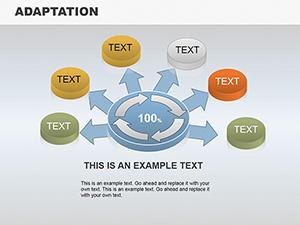
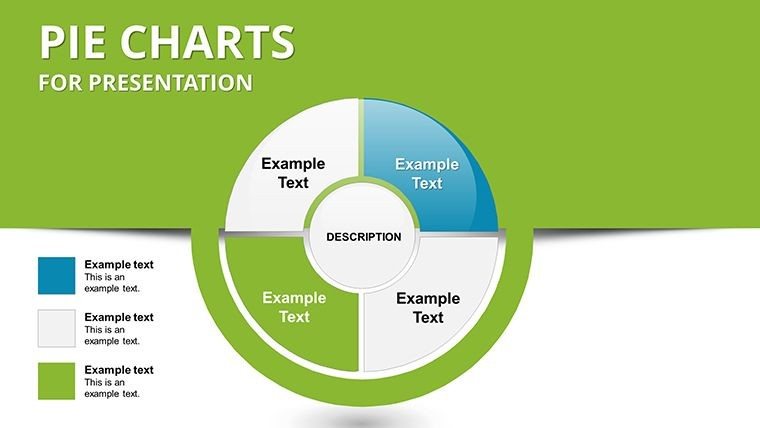
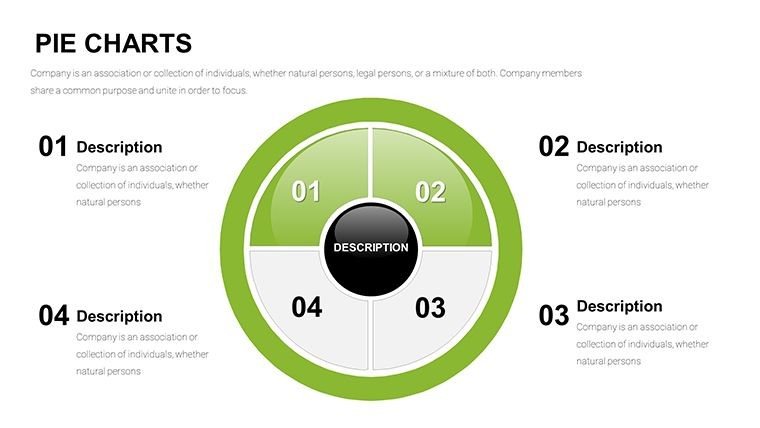
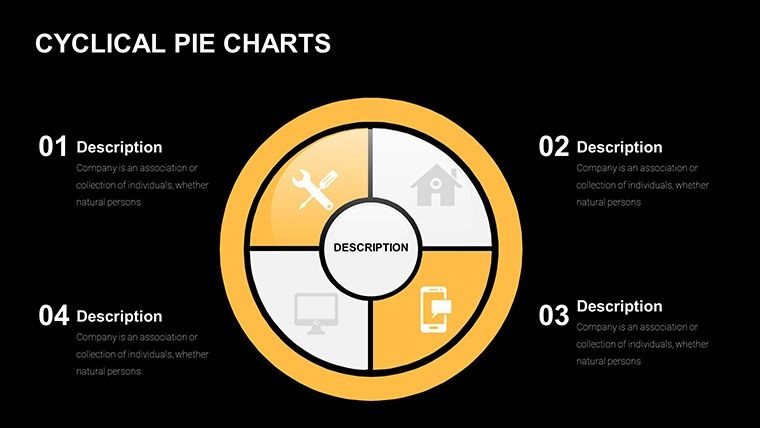
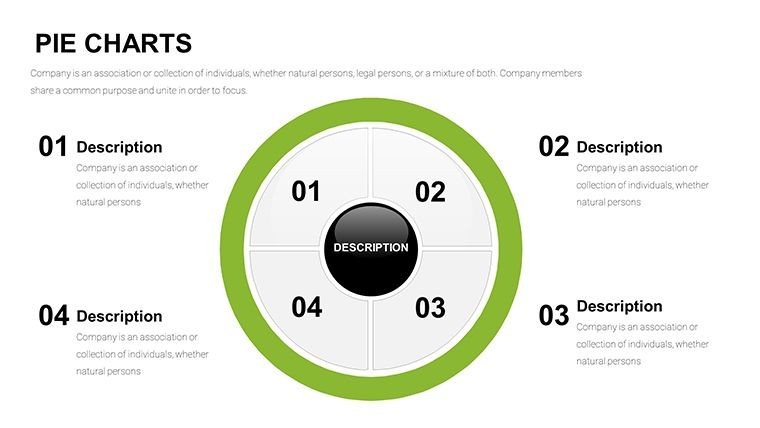
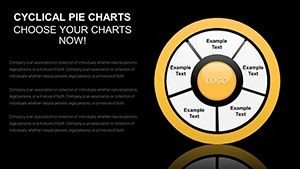
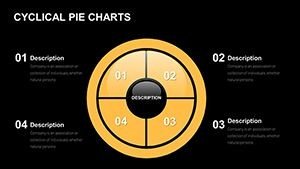
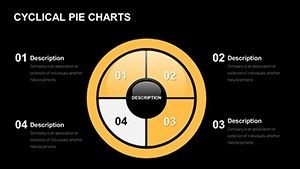
Processes don't stand still - they cycle, loop, and evolve, much like the feedback in a thriving project or the rhythm of market trends. The Cycle Pie PowerPoint Charts Template captures this motion with 27 editable slides blending pie segments into cyclical flows, empowering marketers, analysts, project managers, and instructors to depict recurring patterns with elegance. This isn't static data; it's a dynamic wheel that turns numbers into narratives, compatible across PowerPoint and Google Slides for wherever inspiration strikes.
Rooted in circular economy principles from Ellen MacArthur Foundation visuals, these charts emphasize continuity over silos. From sales cycles to learning loops, customize to fit - vibrant arcs for energy sectors or muted tones for academic reviews. It's designed to loop your audience in, making repetitive data feel fresh and forward-moving.
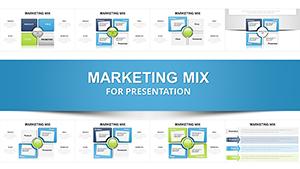
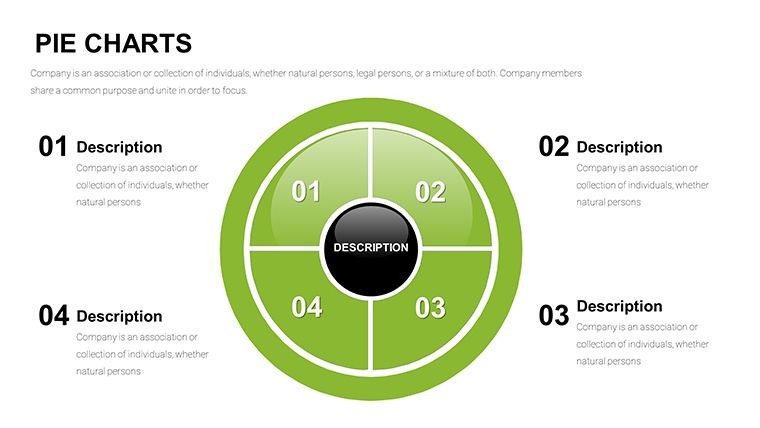
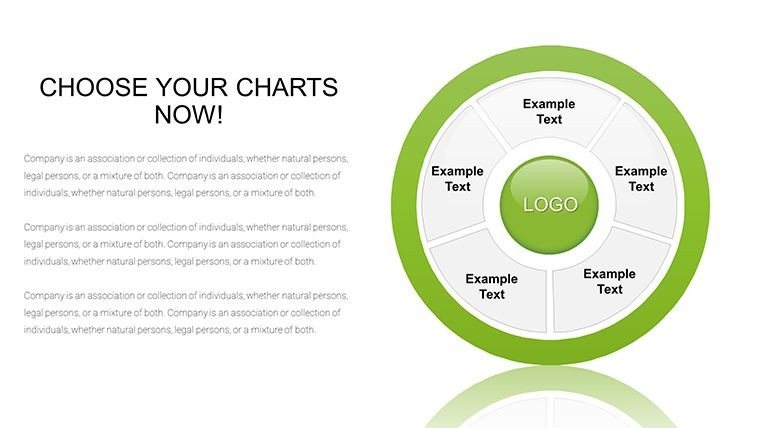
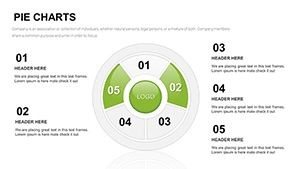
Craft Continuous Visuals: Pies That Go Round
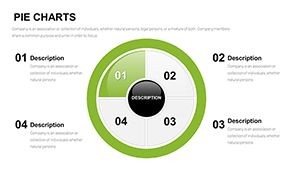
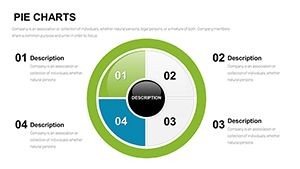
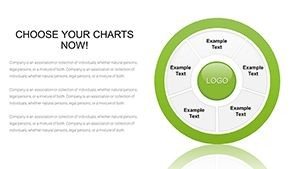
Blending pie precision with cycle fluidity, slides range from simple loops to multi-phase wheels, each editable for your tempo.
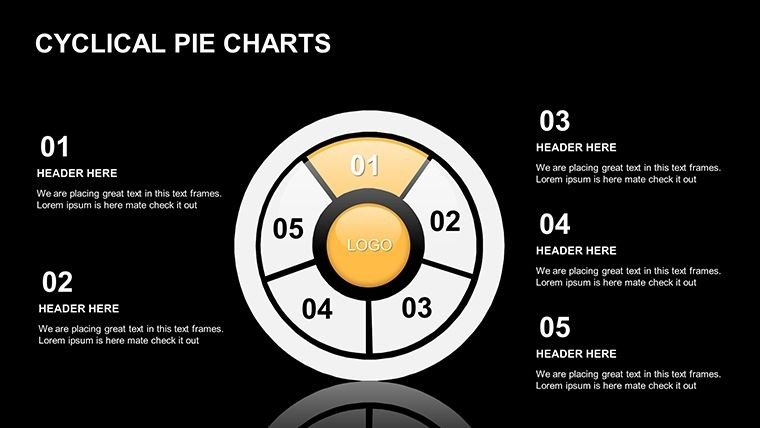
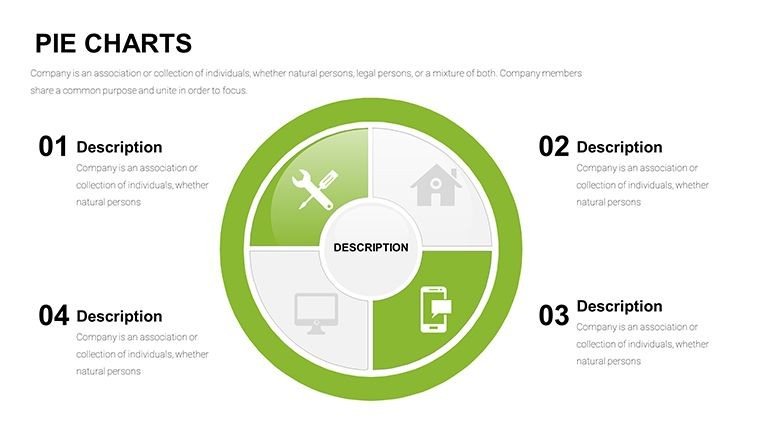
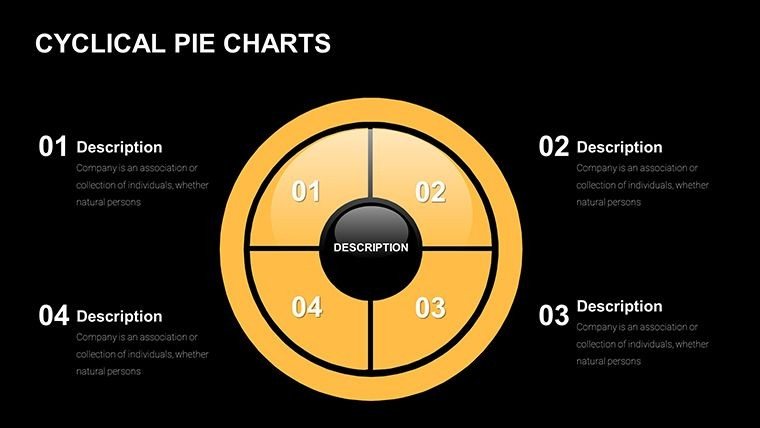
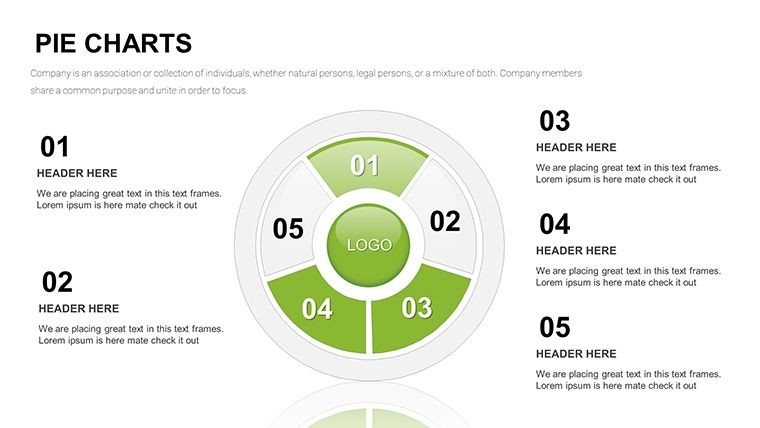
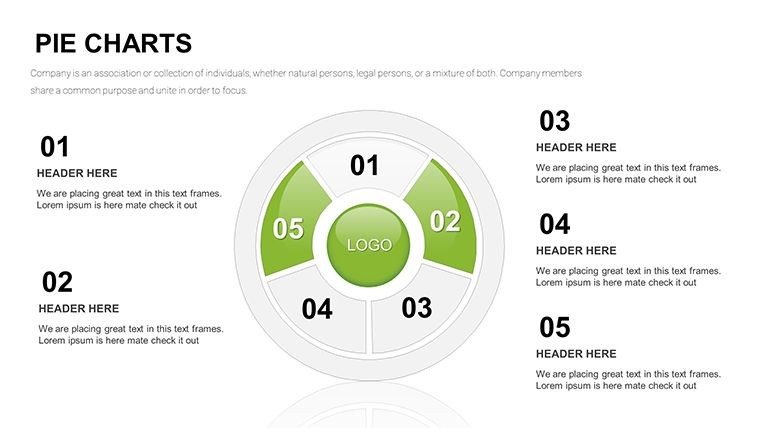
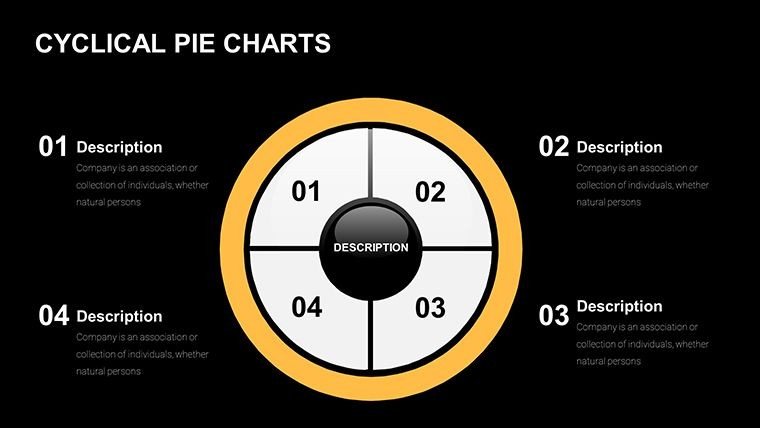
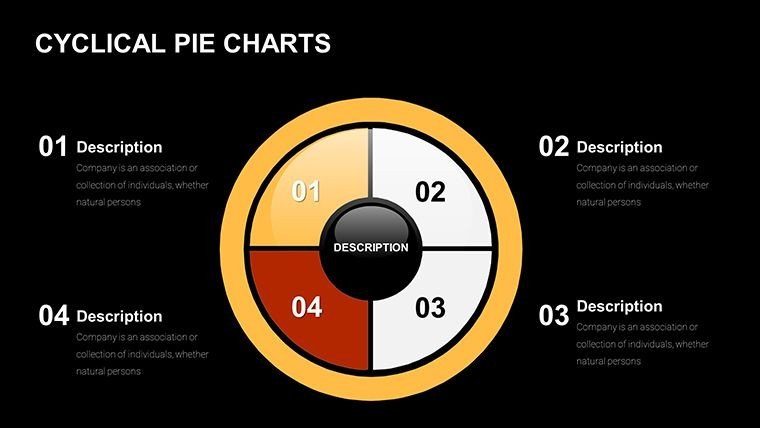
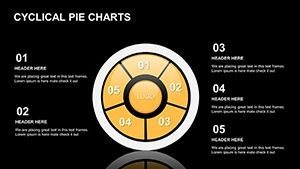
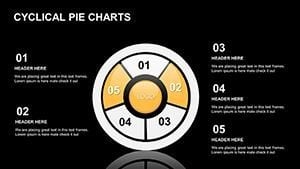
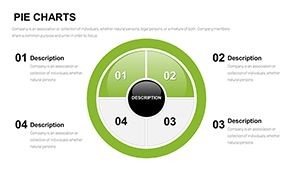
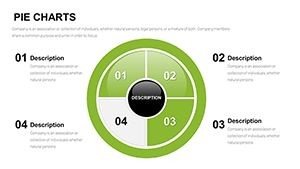
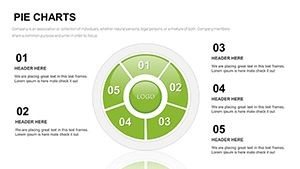
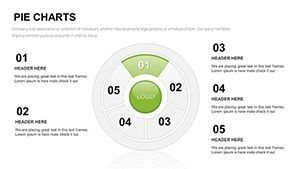
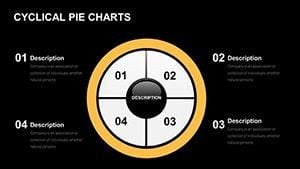
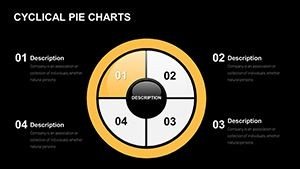
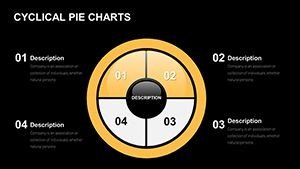
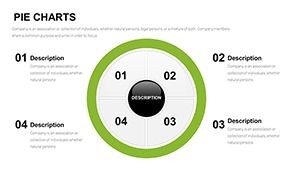
- Basic Cycle Pies: Slides 1-6 arc simple loops for quarterly cycles, like revenue streams - tweak angles for emphasis.
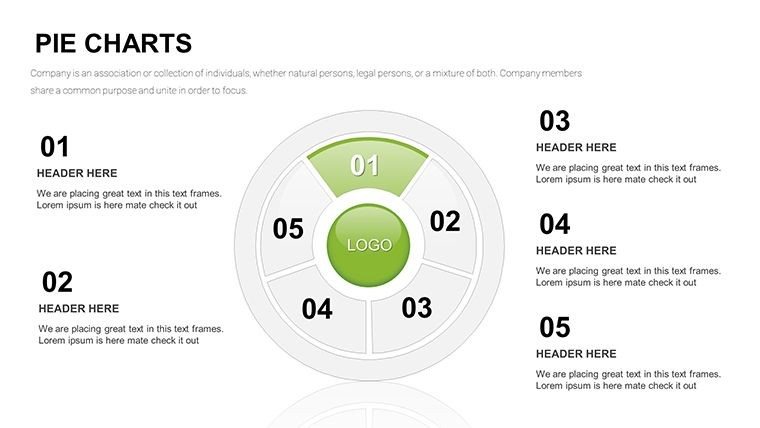
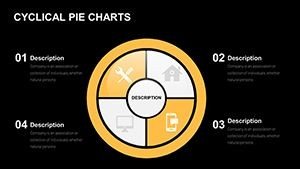
- Phased Integrations: Layered on slides 13-19, showing feedback in product dev, with arrows for directional flow.
- Multi-Cycle Overlays: Complex nests on slide 23 for ecosystem models, overlapping pies for interdependencies.
Tailor freely: Adjust arc colors in the format pane, sync fonts for cohesion (Helvetica for crispness), and add subtle rotations via animations. Gartner insights reveal cyclical visuals improve process comprehension by 55%, ideal for training modules.
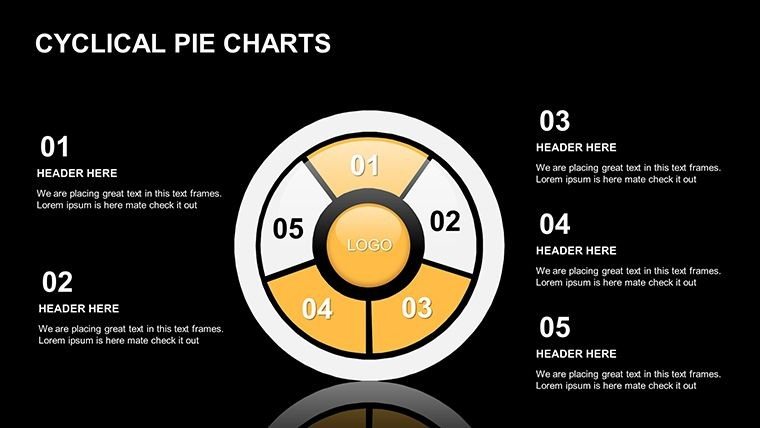
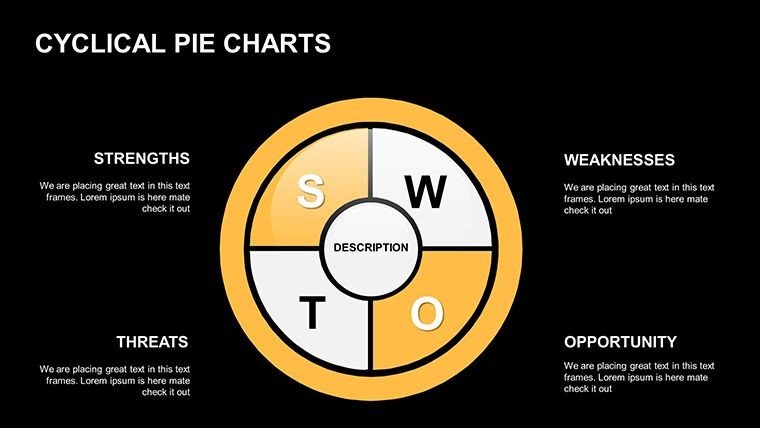
Engaging Examples: Looping Through Applications
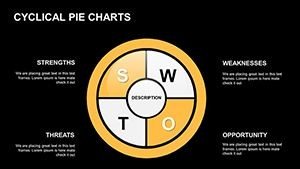
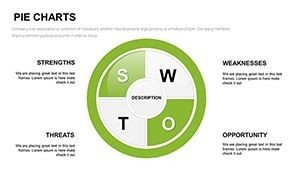
A marketing VP spins slide 9's customer journey cycle, pie-slicing touchpoints from awareness to loyalty - converting leads with looped clarity. Educators loop in biology: Slide 17's nutrient cycle pie illustrates carbon flows, animating paths for vivid lessons.
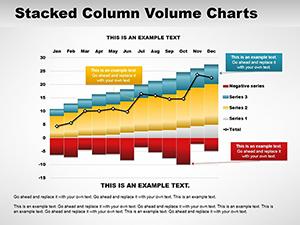
Analysts adore it for KPI dashboards: Slide 25 overlays performance cycles, tracking variances in real-time pulls from dashboards. Case in point - a renewable energy firm used akin cycles to pitch sustainability loops, landing a major contract per industry reports.
- Map Your Loop: Outline phases in placeholders, auto-arcs segments.
- Animate the Motion: Sequence reveals to mimic rotation, captivating viewers.
- Integrate and Iterate: Link to Sheets for updates; version for iterations.
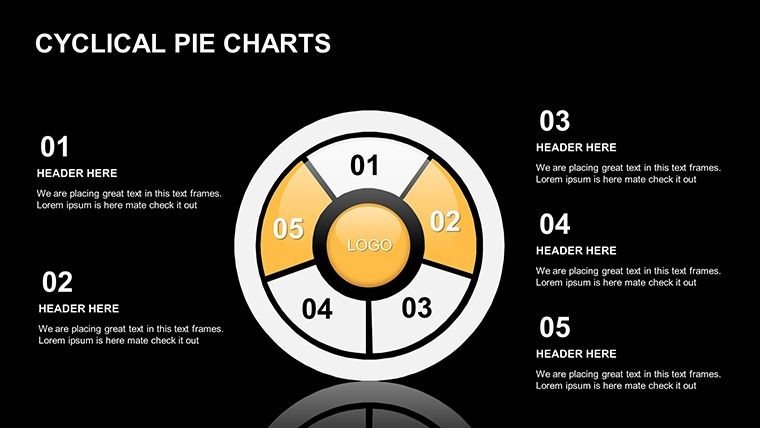
Revolve Past Linear Charts: The Cycle Edge
Line graphs linearize; our cycles circularize, with pre-curved paths and 60+ loop icons for thematic depth. Efficiency boost? Prep a full deck in under an hour. Optimized for virtual whiteboards like Miro integration.
Accessibility shines: Gradient contrasts and descriptive alts meet AA standards. Sustainability pros layer it for circular models, from waste reduction to resource renewal, aligning with ESG reporting.
Time to cycle up - Secure your template today and keep the momentum. Explore more pie innovations.
Frequently Asked Questions
What cycle styles are featured?
From simple arcs to nested multi-phases, 15+ variations for diverse loops.
Google Slides ready?
Yes - imports cleanly, maintaining curves and motions.
Best for project management?
Perfect; slides 20-24 track iterative sprints and reviews.
Customization depth?
Deep - edit arcs, add connectors, or embed charts.
Animation capabilities?
Rotational spins and path follows; fine-tune durations.