Money Supply Chart PowerPoint Template - Fully Editable Financial Data Visualization Slides

Type: PowerPoint Charts template
Category: Tables
Sources Available: .pptx
Product ID: PC00422
Template incl.: 11 editable slides
Unlock Financial Insights with Editable Money Supply Charts
This Money Supply Chart PowerPoint Template delivers a professional suite of pre-designed, fully editable slides that help you communicate complex economic concepts and monetary data with clarity and impact. Whether you're presenting to executives, students, researchers, or policymakers, these slides provide visual structures to make data-driven stories understandable and engaging.
When and Why to Use This Template
Use this template when you need to present financial data about money supply components such as M1, M2, or other monetary aggregates in a clear, engaging format. It's ideal for economic briefings, business strategy meetings, financial analysis reports, classroom lectures, and investor presentations. Instead of building charts from scratch, this ready-made PPTX helps you focus on insights rather than slide design.
Key Features You'll Benefit From
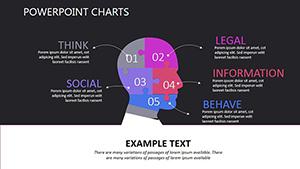
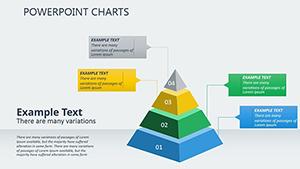
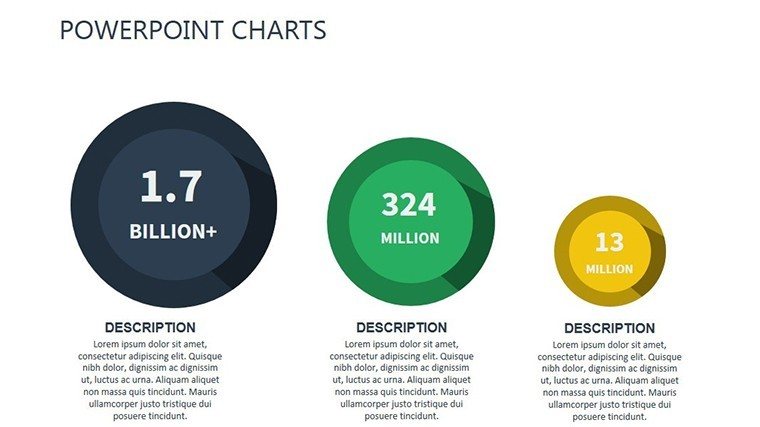
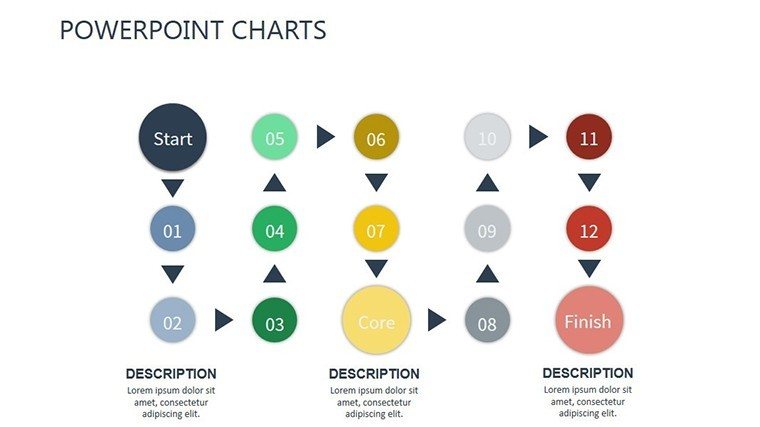
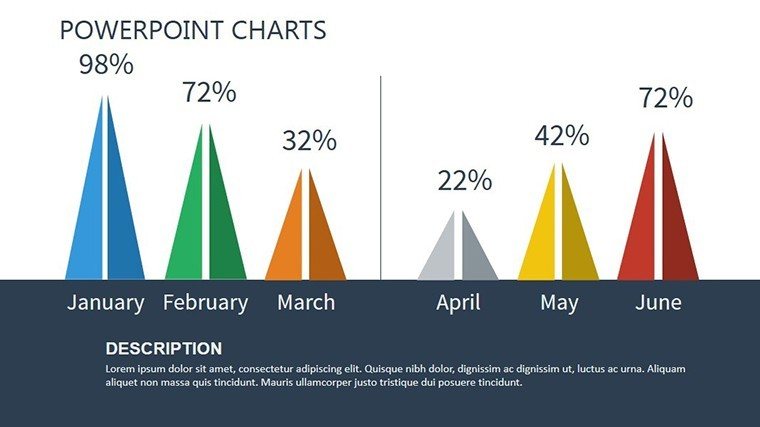
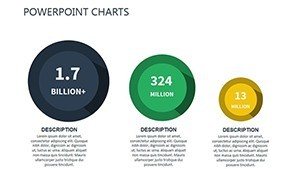
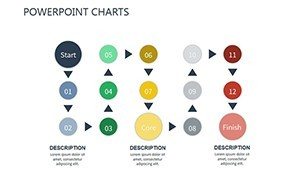
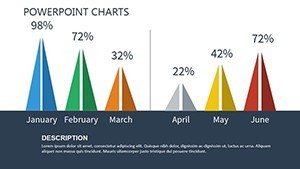
Editable Charts and Graphs
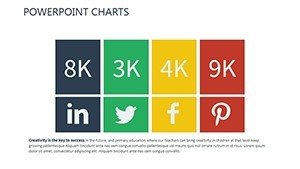
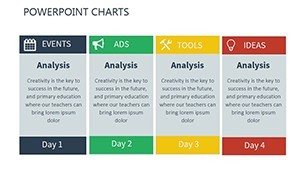
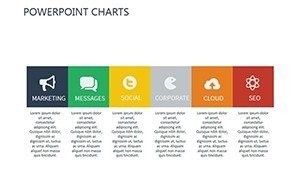
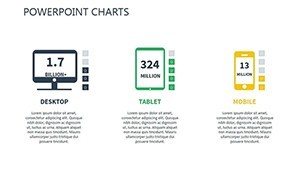
Each slide includes editable chart elements - from line graphs tracking trends to bar charts comparing components - so you can replace sample data with your own figures and maintain consistent branding throughout your deck.
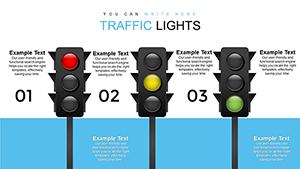
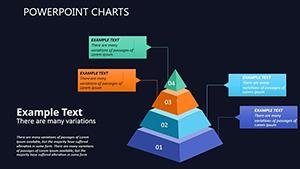
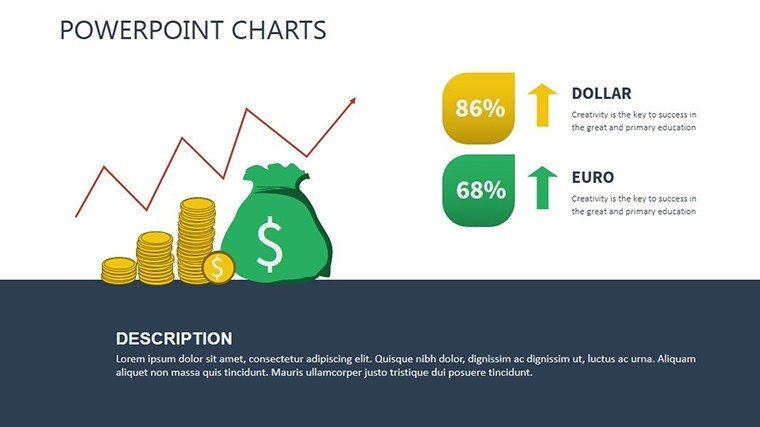
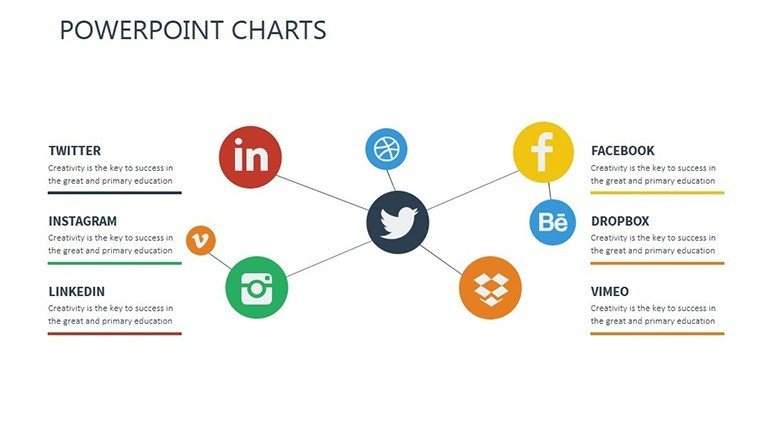
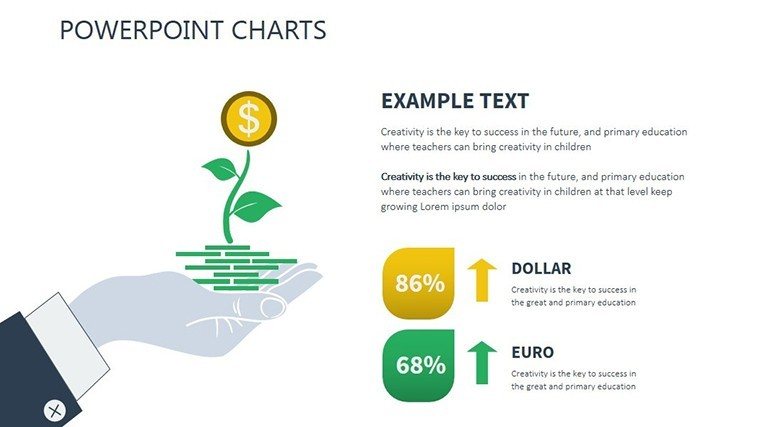
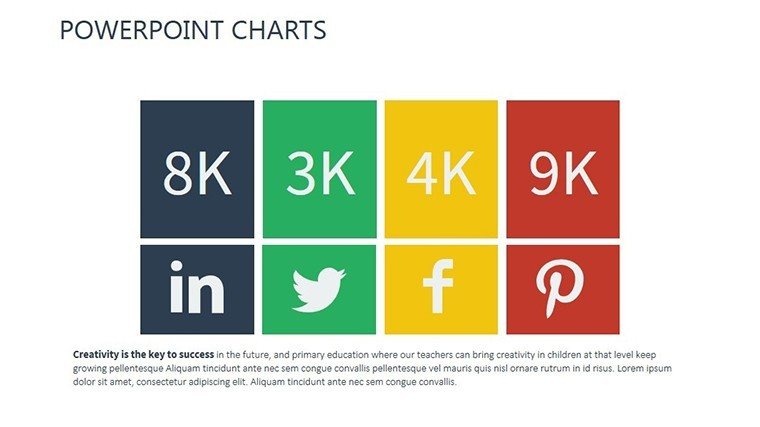
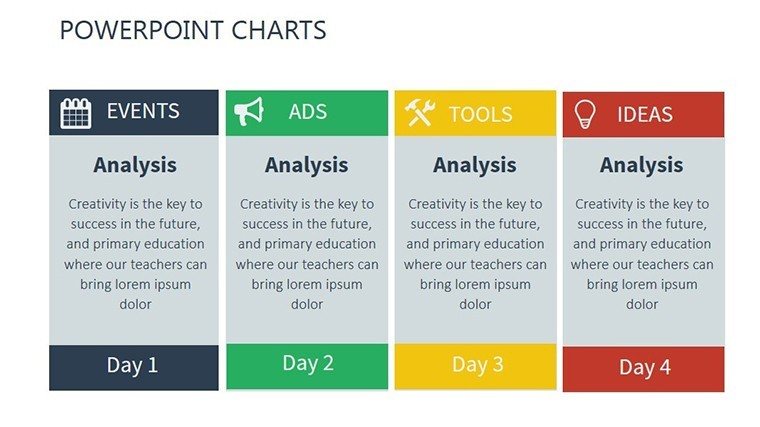
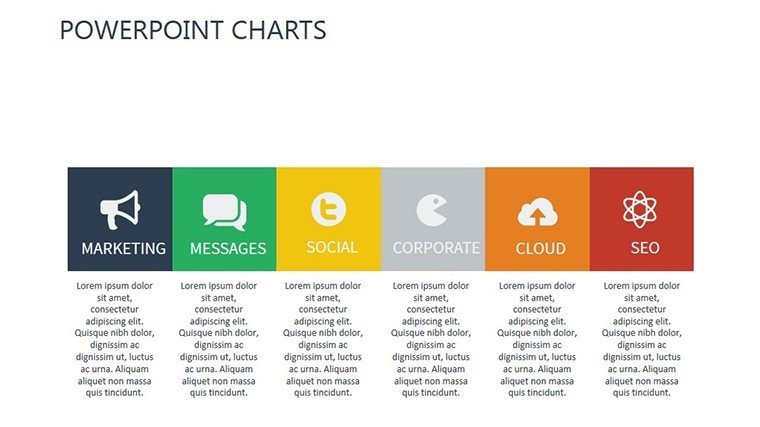
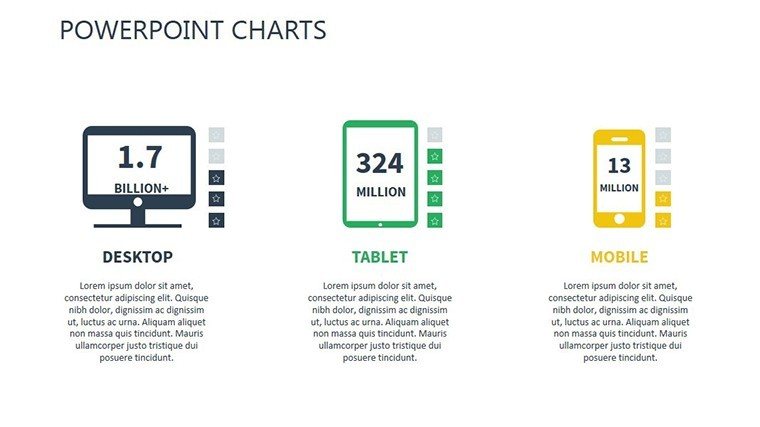
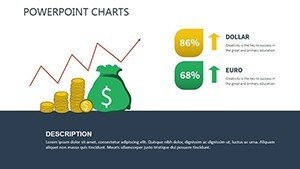
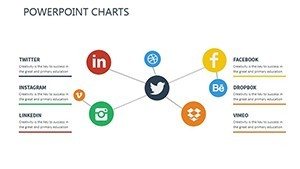
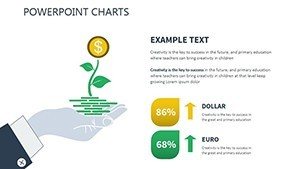
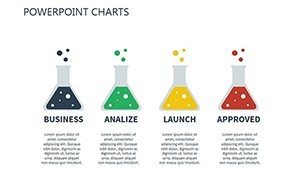
Professional Visual Design
Designed for readability and impact, this template uses high-quality vector graphics, thematic icons, and layouts optimized for financial storytelling. These visuals support your narrative and keep your audience focused on the key takeaways.
Broad Compatibility
The template is delivered in .pptx format, ensuring seamless use in Microsoft PowerPoint and compatibility with Google Slides and other presentation platforms that support PPTX files. You can easily edit data points, colors, fonts, and layout elements without technical expertise.
Real-World Use Scenarios
Economists can use these slides to illustrate the relationships between money supply and inflation in academic seminars. Finance teams can embed updated charts into quarterly business reviews to visualize monetary trends for stakeholders. Educators can leverage these visuals to teach macroeconomic concepts in classroom settings. Consultants can also customize the template to support client-facing presentations that require clarity and visual sophistication.
Start saving time and elevating your financial presentations today with this fully editable Money Supply Chart PowerPoint Template.
Frequently Asked Questions
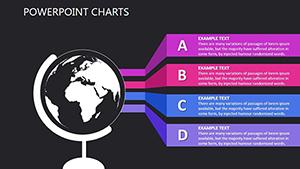
What chart types are included in the template?
This template includes editable line graphs and bar charts designed to visualize trends and comparisons in money supply data effectively. You can update each chart with your own dataset.
Can I change the color scheme and branding?
Yes. All design elements including colors, fonts, icons, and backgrounds are fully customizable, so you can match your brand or presentation theme effortlessly.
Is this template compatible with Google Slides?
Yes. Because the file is in .pptx format, you can upload and edit it within Google Slides with most design elements preserved.
Who benefits most from this template?
This template is great for economists, business analysts, educators, consultants, and finance professionals who need to present economic data with clarity and professionalism.