Algorithmic Trading PowerPoint Charts Template: Unlock Market Strategies


Type: PowerPoint Charts template
Category: Relationship, Illustrations
Sources Available: .pptx
Product ID: PC00419
Template incl.: 11 editable slides
In the high-stakes world of finance, where milliseconds matter, the Algorithmic Trading PowerPoint Charts Template serves as your secret weapon for articulating sophisticated strategies. With 11 editable slides, this tool distills complex algorithms into digestible visuals, drawing on principles from the Chartered Financial Analyst (CFA) Institute for accuracy. Tailored for traders, analysts, and educators, it helps visualize backtested results, risk models, and execution paths. Envision pitching a momentum-based algo to investors: candlestick charts reveal entry/exit points, while line graphs track performance - turning data deluge into persuasive stories. This template's interactive elements, like dynamic updates, enhance engagement, often leading to quicker funding approvals in venture settings. Compatible across PowerPoint and Google Slides, it fits seamlessly into trading desks or classrooms, empowering you to focus on insights over design drudgery.
Standout Features for Trading Pros
Core to this template are advanced visualization tools: candlesticks for price actions, pies for portfolio allocations, and lines for trend analyses. Slides allow for real-time data feeds, with customizable scales to zoom into volatility spikes. The design echoes modern trading platforms - clean lines, dark modes for eye comfort - outpacing outdated Excel exports. Personalize with algo-specific icons, like bots for automation, ensuring brand alignment. A hedge fund analyst recounted using akin templates to clarify high-frequency strategies, securing a major client by simplifying latency impacts.
Comprehensive Slide Analysis
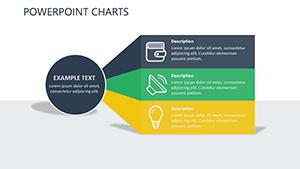
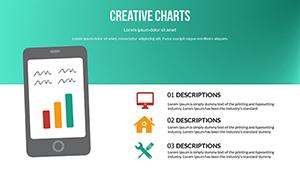
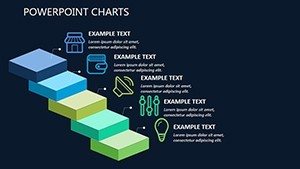
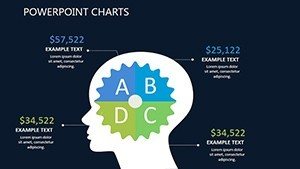
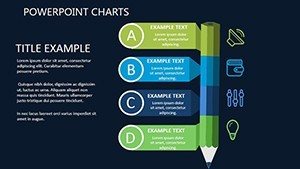
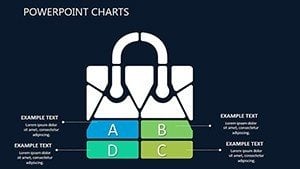
- Slide 1: Strategy Overview - Dashboard with key metrics, integrating multiple chart types for at-a-glance insights.
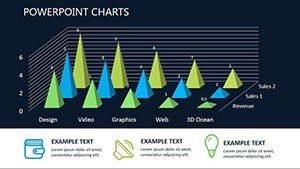
- Slide 2-4: Price Action Candlesticks - Detailed views of market movements, editable for custom timeframes.
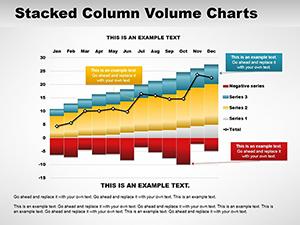
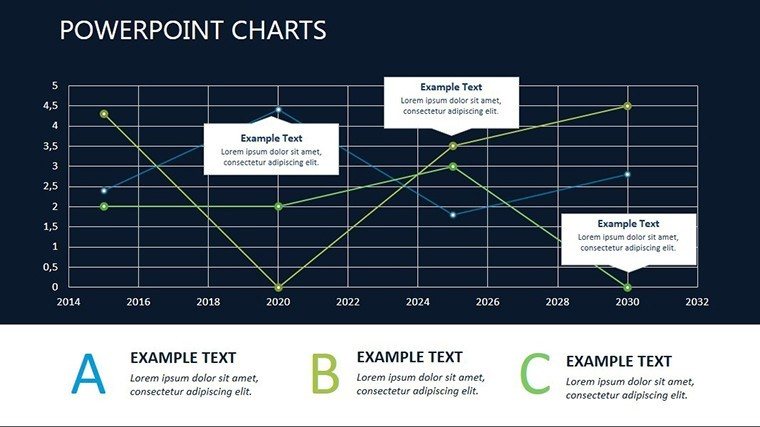
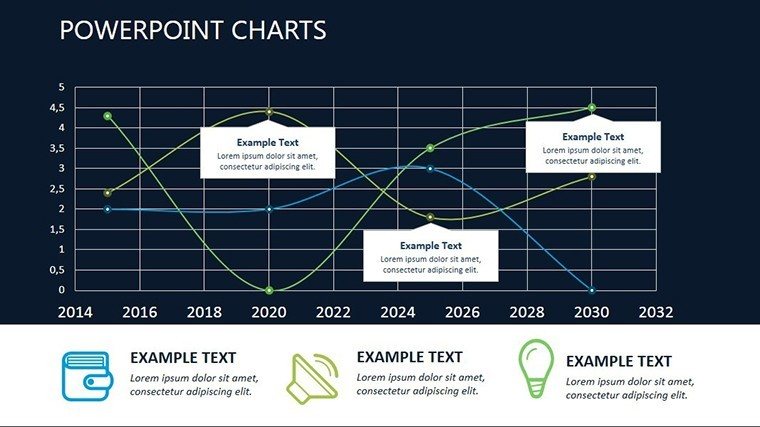
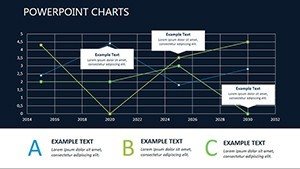
- Slide 5: Performance Line Graphs - Tracks returns over periods, with benchmarks for comparison.
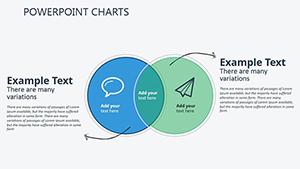
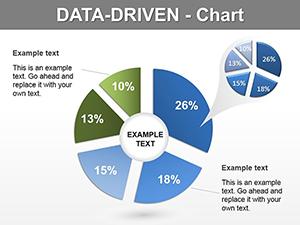
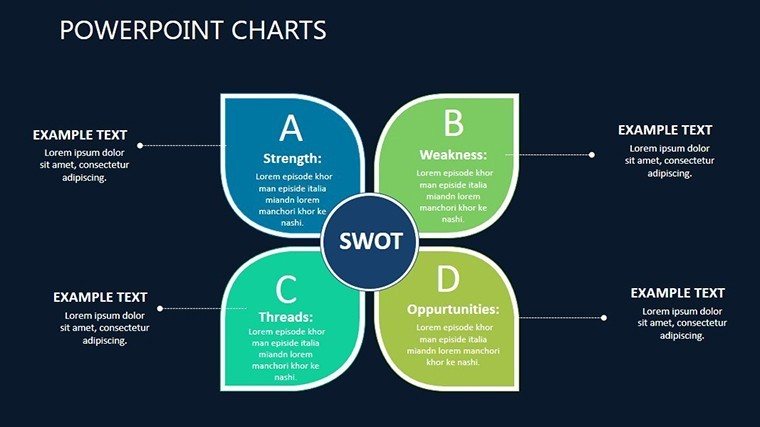
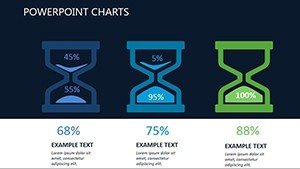
- Slide 6-7: Risk Pie Charts - Breaks down exposures, aiding in diversification discussions.
- Slide 8: Execution Flow Diagrams - Illustrates order routing, crucial for compliance reviews.
- Slide 9-10: Backtest Simulations - Scatter plots showing outcomes, with filters for scenarios.
- Slide 11: Investor Summary - Consolidated visuals with CTAs for next steps.
This structure supports iterative refinements, ideal for agile trading environments.
Diverse Applications in Finance
Deploy it for investor pitches, where pies highlight alpha generation, or team huddles dissecting market anomalies. In education, simulate algos for students, aligning with CFA curriculum on quantitative methods. A fintech startup leveraged similar charts to demo arbitrage strategies, attracting seed funding. Benefits: sharpened clarity reduces misinterpretations; time efficiency accelerates strategy iterations; credibility soars with pro visuals. Tip: Link to live APIs for demos, but test offline backups. Add a dash of wit - call it your 'algo ally' against market mayhem.
Strategic Usage Tips
- Define objectives: Match charts to algo types, like volatility for options trading.
- Incorporate benchmarks: Use lines to compare against indices like S&P 500.
- Enhance narratives: Annotate peaks/troughs with explanatory notes.
- Ensure compliance: Reference SEC guidelines in risk slides.
- Iterate based on feedback: Adjust visuals post-presentation for better resonance.
These, from trading veterans, optimize outcomes.
Edge Over Competitors
Surpassing basic charts, it offers interactive depth without coding, at $17.00 - a fraction of bespoke solutions. Its illustration focus adds flair, making technical topics approachable.
Elevate your trading talks - grab the Algorithmic Trading PowerPoint Charts Template and trade confusion for conviction.
Frequently Asked Questions
- Are the charts interactive?
- Yes, with dynamic data updates and clickable elements for deeper dives.
- Suitable for beginners?
- Absolutely, user-friendly for novices while robust for experts.
- Can I customize for specific algos?
- Fully editable to fit mean-reversion, trend-following, or custom strategies.
- Compatible with trading software?
- Exports well, though direct integration varies.
- How to handle large datasets?
- Slides support aggregation for clarity without overload.
- Any animation options?
- Built-in for emphasizing key transitions.