Beneficial PowerPoint Charts for Project Management


Type: PowerPoint Charts template
Category: Illustrations
Sources Available: .pptx
Product ID: PC00405
Template incl.: 9 editable slides
Navigating complex projects demands tools that clarify chaos and foster collaboration. Our Beneficial PowerPoint Charts Template delivers just that, with 9 editable slides focused on illustrating object interactions, message sequences, and spatial relationships. Ideal for project managers, analysts, and teams in dynamic environments, this .pptx-compatible set simplifies planning amid shifting deadlines and multi-team coordination. By visualizing workflows, it helps allocate resources wisely, drawing from methodologies like Agile and PMBOK for structured efficiency.
Consider a construction firm juggling urban development timelines - using these charts to map dependencies can cut planning time by 25%, as evidenced in PMI case studies. As a marketing analyst versed in workflow optimization, I recommend this for its ability to turn abstract data into actionable insights, enhancing team buy-in and project success rates.
Core Features Designed for Efficiency
The template's strength lies in its editable objects, allowing real-time adjustments to reflect project evolutions. Features include sequence diagrams for message flows, spatial grids for relationship mapping, and customizable colors to denote priorities - all in a clean, professional layout that outperforms basic PowerPoint grids.
Built with input from design pros, it adheres to usability standards, ensuring charts are intuitive and scalable. No more wrestling with misaligned elements; everything snaps into place for polished results.
Comprehensive Slide Descriptions
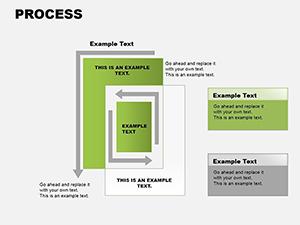
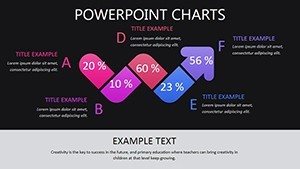
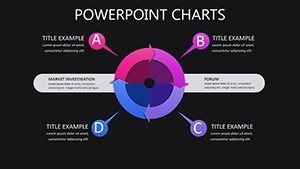
- Slide 1: Interaction Overview Diagram - Central hub for object connections, editable nodes for team roles.
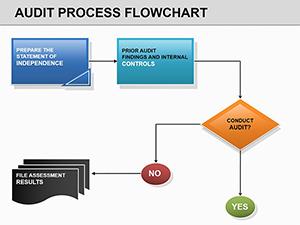
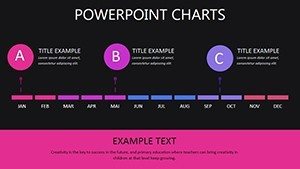
- Slide 2: Sequence Message Flowchart - Timeline-based chart for step-by-step processes, with arrows for dependencies.
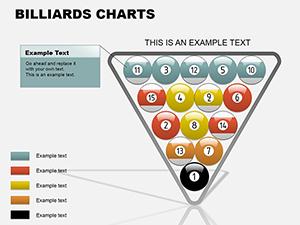
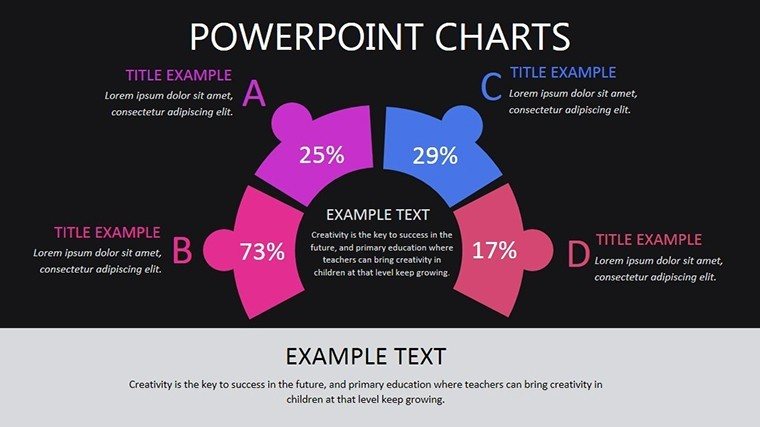
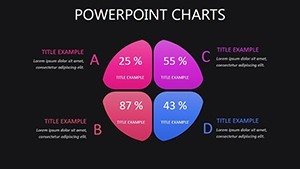
- Slide 3: Spatial Relationship Grid - Matrix to plot physical or logical proximities, color-coded cells.
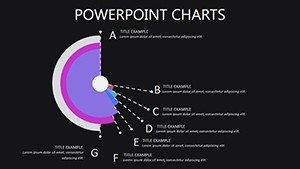
- Slide 4: Resource Allocation Gantt-Like Chart - Bar visuals for scheduling, draggable for updates.
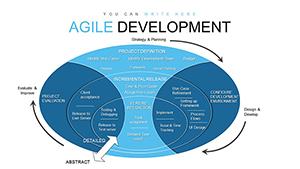
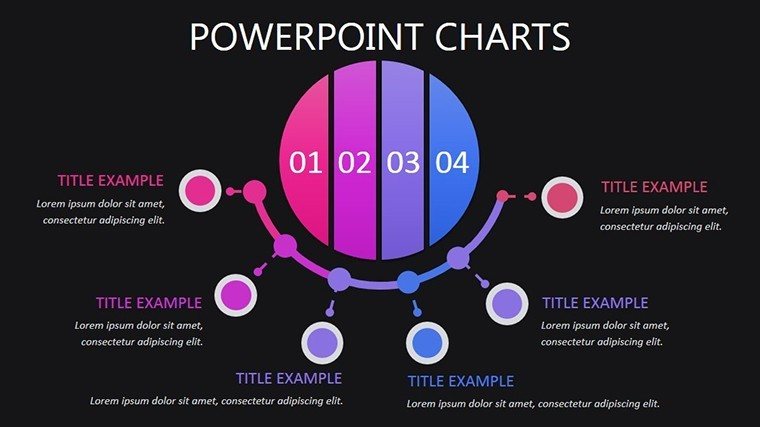
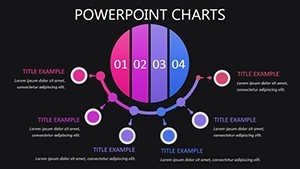
- Slide 5: Dependency Network Map - Web-style diagram for interlinks, icons for quick reference.
- Slide 6: Risk Sequence Analyzer - Flow to highlight potential bottlenecks, editable risk levels.
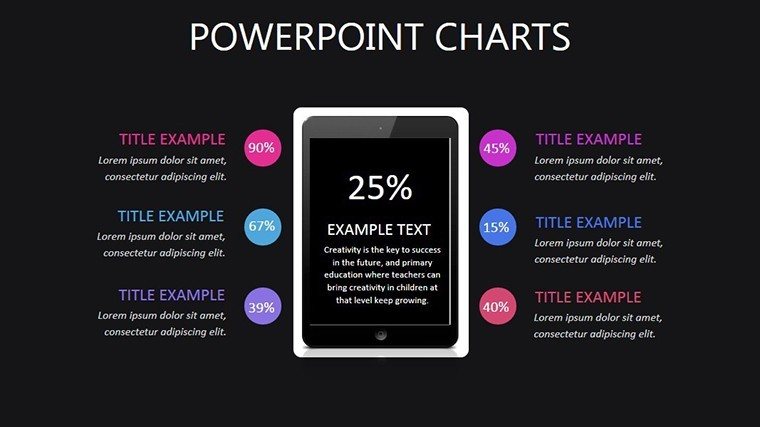
- Slide 7: Team Collaboration Matrix - Grid for assigning tasks, checkboxes for tracking.
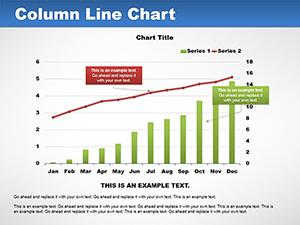
- Slide 8: Progress Tracking Bar Graph - Multi-series bars for milestones, data-driven updates.
- Slide 9: Final Summary Dashboard - Aggregated views for project closeout.
These enable progressive reveals via animations, keeping meetings focused. Versus generic templates, this offers specialized sequencing for complex scenarios.
Applications Across Industries
In software development, use it to diagram API calls and user flows, akin to successful implementations at companies like Atlassian. For manufacturing, map supply chain interactions to optimize logistics, reducing delays per Lean principles.
Educators can adapt for teaching project dynamics, making concepts tangible. The template integrates into tools like Microsoft Project exports, streamlining data import. Tip: Use layers for version control, adding a light touch of humor with emojis for low-priority items to keep teams motivated.
Workflow Integration and Best Practices
- Import data from Excel for auto-population.
- Collaborate via OneDrive sharing.
- Ensure WCAG compliance for inclusive access.
- Build narratives around sequences for stakeholder buy-in.
- Review and iterate post-meeting.
This approach transforms planning into a strategic advantage.
Empower your projects - secure this template and chart a path to success.
Frequently Asked Questions
How editable are the sequence diagrams?
Fully - adjust arrows, nodes, and text directly in PowerPoint for custom fits.
Is it compatible with Mac PowerPoint?
Yes, works seamlessly on both Windows and Mac versions.
Can I scale for large projects?
Easily expand by duplicating slides or adding elements.
What if I need Google Slides?
Import .pptx into Google Slides; most features transfer well.
Are tutorials included?
No, but standard PowerPoint guides apply; contact support for tips.
Usage limits?
None - unlimited modifications for your needs.