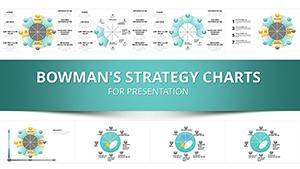
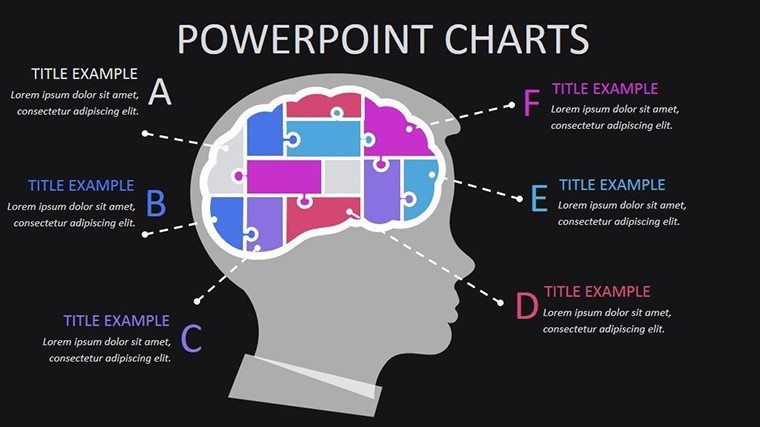
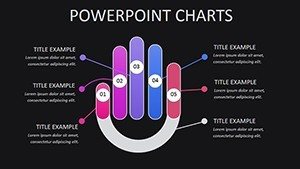
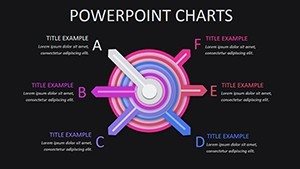
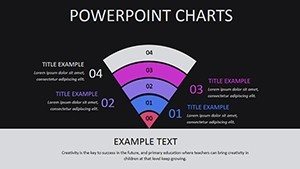
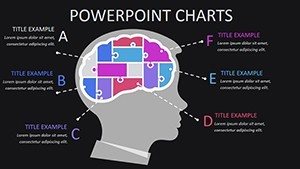
World Development Indicators PowerPoint Charts Template


Type: PowerPoint Charts template
Category: Spheres
Sources Available: .pptx
Product ID: PC00403
Template incl.: 9 editable slides
Imagine transforming complex global data into compelling stories that resonate with your audience. Our World Development Indicators PowerPoint charts template is designed precisely for that purpose. Whether you're a business analyst presenting economic trends to stakeholders, an educator illustrating development metrics in a classroom, or a researcher sharing insights at a conference, this template equips you with professional tools to make your data shine. With 9 fully editable slides, it offers high-quality visualizations that align with World Bank standards, ensuring accuracy and visual appeal. Say goodbye to bland spreadsheets and hello to engaging narratives that drive decisions and inspire action. This template not only saves time but also enhances clarity, making intricate indicators like GDP growth, poverty rates, and health metrics accessible and impactful.
Unlocking the Power of Data Visualization
In today's data-saturated world, the ability to present information clearly is a game-changer. Our template draws from real-world applications, such as the World Bank's use of similar indicators in reform case studies. For instance, in Estonia's business registration reform, as detailed in World Bank publications, visualizing registration times and economic impacts through charts helped policymakers identify bottlenecks and celebrate successes. This template allows you to replicate such professionalism, turning raw data into persuasive visuals that support strategic planning.
Key Features That Set This Template Apart
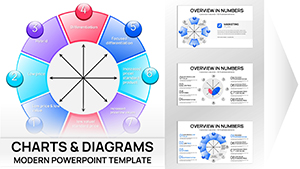
- Precision-Engineered Charts: From bar graphs depicting population dynamics to line charts tracking environmental sustainability, each element is crafted for clarity and precision, adhering to data visualization best practices like those from Edward Tufte's principles.
- Full Customization Flexibility: Adjust colors to match your brand palette, tweak fonts for readability, and resize layouts without losing quality - ensuring your presentation feels uniquely yours.
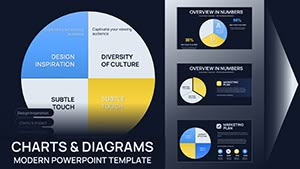
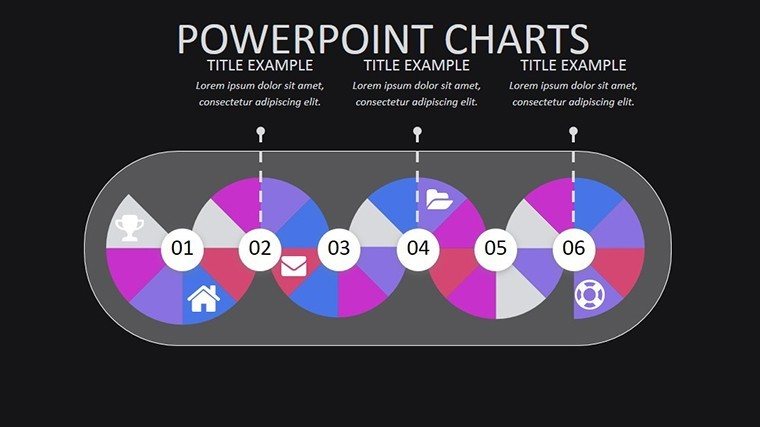
- Diverse Slide Layouts: Choose from comparative dashboards, trend trackers, and regional maps, all optimized for widescreen displays.
- Seamless Compatibility: Works flawlessly in Microsoft PowerPoint and Google Slides, with print-ready options for handouts or reports.
- Integrated Icons and Elements: Themed icons for sectors like education and infrastructure add a professional touch without extra design work.
These features aren't just add-ons; they're built to solve common pain points, like spending hours on alignment or data import, freeing you to focus on analysis.
Real-World Use Cases: From Boardrooms to Classrooms
Picture this: A business professional at a global firm uses our template to showcase how World Development Indicators reveal market opportunities in emerging economies. Drawing from the World Bank's case study on economically successful cities, they highlight urban growth metrics, leading to informed investment decisions. Educators, meanwhile, leverage these charts to teach sustainable development, making abstract concepts tangible - much like in academic seminars where indicators illustrate inequality trends.
For researchers, integrate data from sources like the World Bank's Open Knowledge Repository to create compelling narratives. A case in point: Analyzing mining indicators for global development, as explored in ACM studies, where charts model reform strategies effectively.
Detailed Slide Breakdown for Maximum Impact
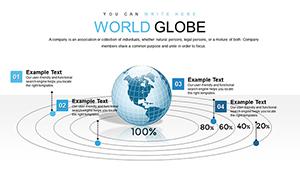
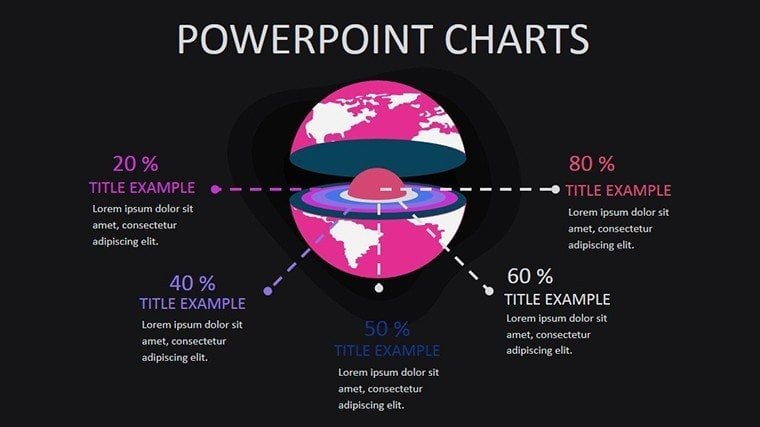
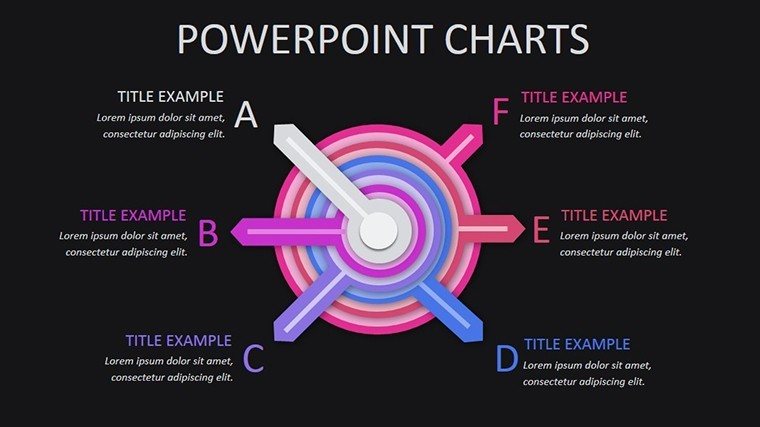
- Slide 1: Overview Dashboard: Summarize key indicators like human development index with interactive gauges.
- Slide 2-4: Economic Trends: Line and area charts for GDP, trade balances, and inflation rates, with tooltips for deeper insights.
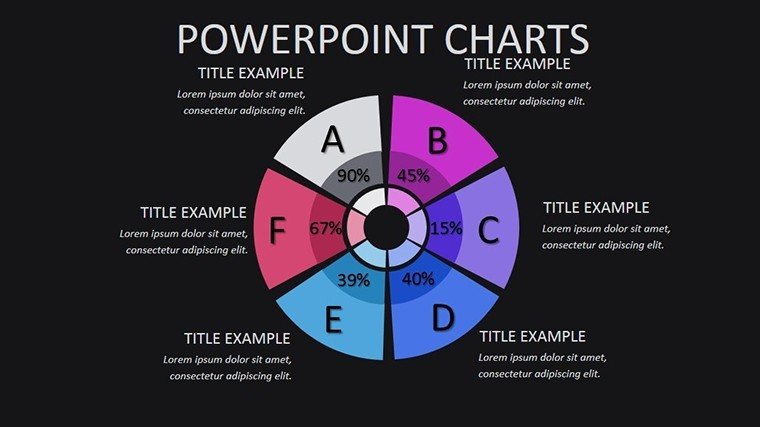
- Slide 5: Social Metrics: Pie charts on education access and health outcomes, customizable for regional comparisons.
- Slide 6: Environmental Indicators: Bar graphs tracking carbon emissions and renewable energy adoption.
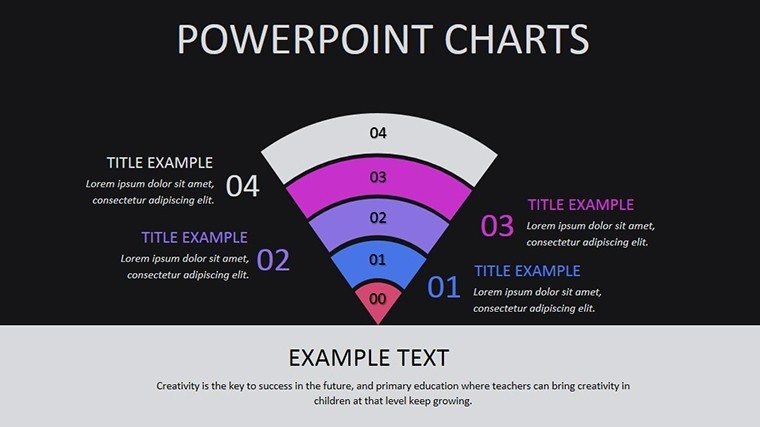
- Slide 7-8: Comparative Analysis: Multi-series charts for cross-country benchmarks.
- Slide 9: Call to Action: Summarize findings with a motivational layout.
Each slide is designed with accessibility in mind, using high-contrast colors and alt text for images, ensuring compliance with standards like WCAG.
Tips for Integrating This Template into Your Workflow
Start by importing your data from Excel or CSV files directly into the charts - PowerPoint's data linking feature makes updates seamless. Experiment with animations to reveal data points progressively, keeping your audience engaged. For educators, pair with real-time data from World Bank APIs for dynamic lessons. In business settings, align with AIA-like standards for authoritative presentations, boosting your credibility.
Compared to basic PowerPoint tools, our template offers pre-built logic for complex calculations, like percentage changes, saving you from manual formulas.
Elevate Your Data Storytelling Today
Don't let valuable insights get lost in translation. With our World Development Indicators PowerPoint charts template, you're not just presenting data - you're crafting stories that influence and educate. Ready to transform your next pitch or lecture? Secure your download and start visualizing success.
Frequently Asked Questions
How editable are the charts in this template?
Every chart is fully editable, allowing you to change data, colors, and layouts directly in PowerPoint or Google Slides without needing additional software.
Is this template compatible with older versions of PowerPoint?
Yes, it's designed for broad compatibility, working with PowerPoint 2010 and later, as well as Google Slides for cloud-based editing.
Can I use real World Bank data with these charts?
Absolutely - import data from official sources to ensure accuracy, and the template handles complex datasets with ease.
What if I need more slides?
You can duplicate and modify existing slides to expand your presentation as needed.
Are there any usage restrictions?
No, once downloaded, you can use it for personal, educational, or commercial purposes without limitations.