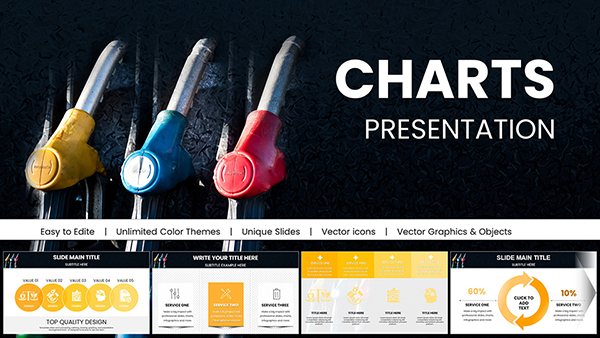
Renewable Energy Sources PowerPoint Charts Template


Type: PowerPoint Charts template
Category: Illustrations
Sources Available: .pptx
Slide size: widescreen (16:9)
Product ID: PC00399
Template incl.: 13 editable slides
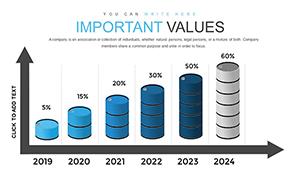
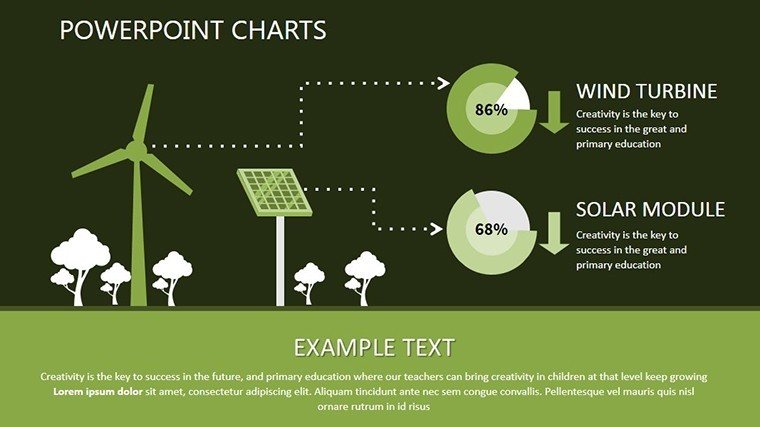
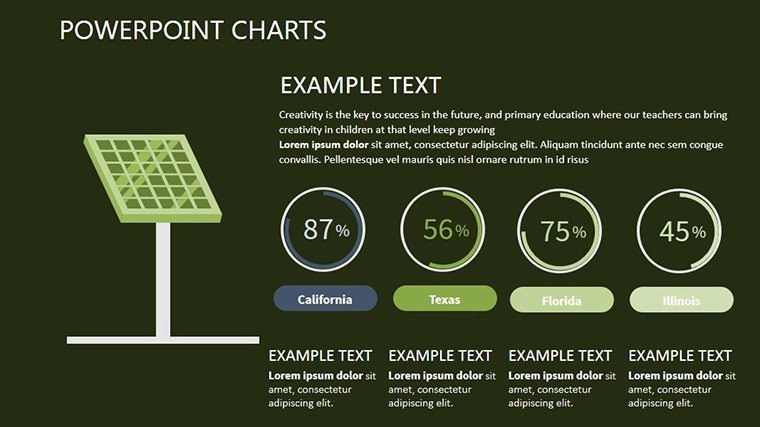
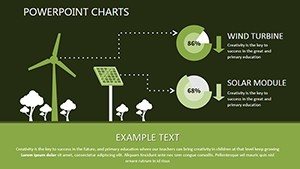
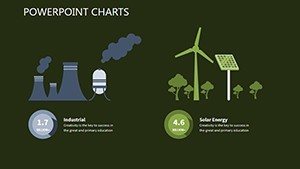
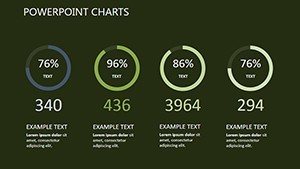
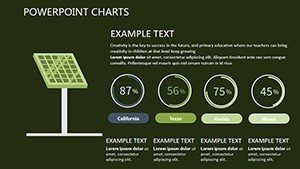
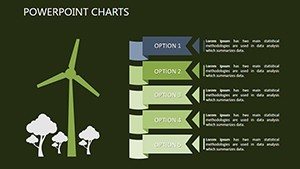
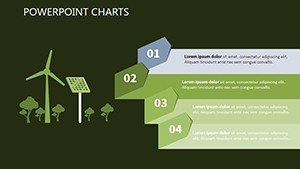
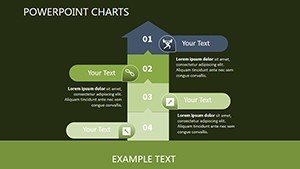
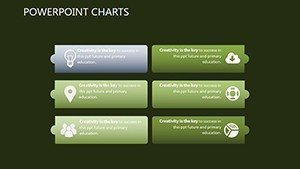
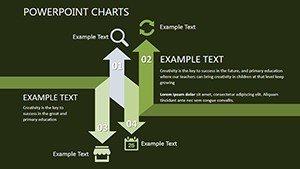
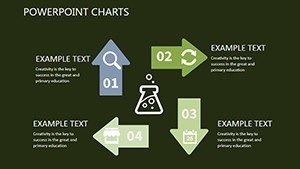
Embrace the future of sustainability with our Renewable Energy Sources PowerPoint charts template, a visual feast for advocates, educators, and professionals in the green sector. Featuring 13 editable widescreen slides, it covers solar, wind, hydro, biomass, geothermal, and tidal energies with illustrative charts. Inspired by Slideshare's renewable resources presentations, this template lets you illustrate global shifts toward clean energy, fostering awareness and action. Revel in the power of visuals that make environmental data accessible, sparking conversations on climate solutions.
Illustrative Features for Eco-Impact
Draw from SlideTeam's top case studies, where renewable investments are visualized for clarity. Our template supports similar narratives, highlighting energy transitions.
Key Advantages in Green Storytelling
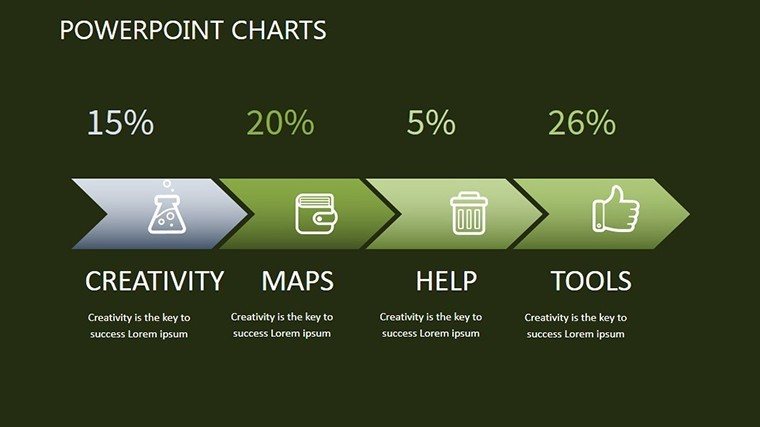
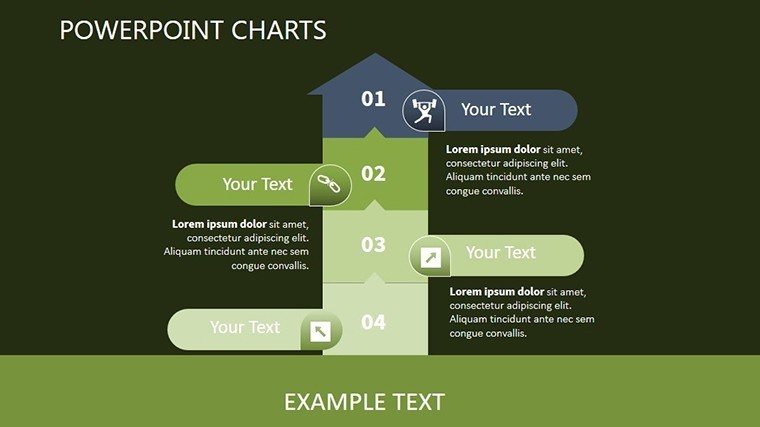
- Vivid Illustrations: Detailed diagrams for each source, as in SlideModel's investment plans.
- Editable Flexibility: Customize to fit your eco-message.
- Widescreen Optimization: Ideal for conferences.
- Source-Specific Charts: Tailored visuals for biomass, wind, etc.
Address education gaps with engaging designs.
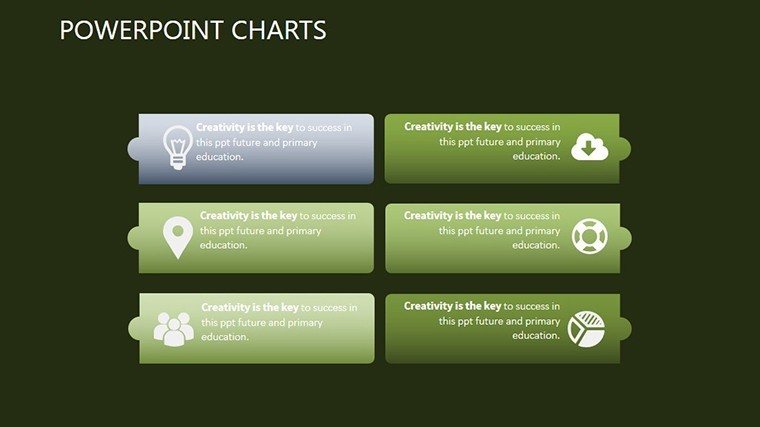
Practical Scenarios for Sustainability
Use for policy pitches, echoing Slideshare's scenarios. Educators can teach sources dynamically.
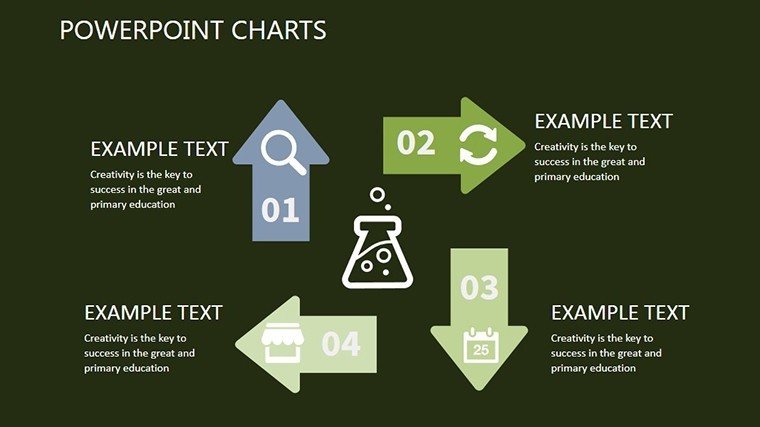
Slide-by-Slide Guide
- Slides 1-2: Overview: Intro to renewables.
- Slides 3-8: Source Details: Charts for solar to tidal.
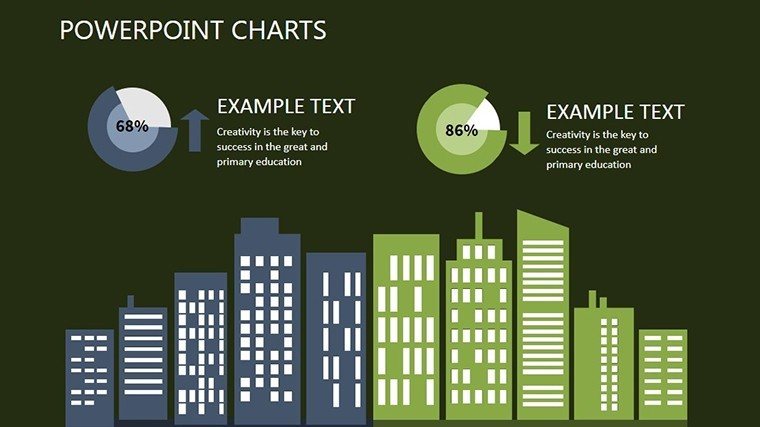
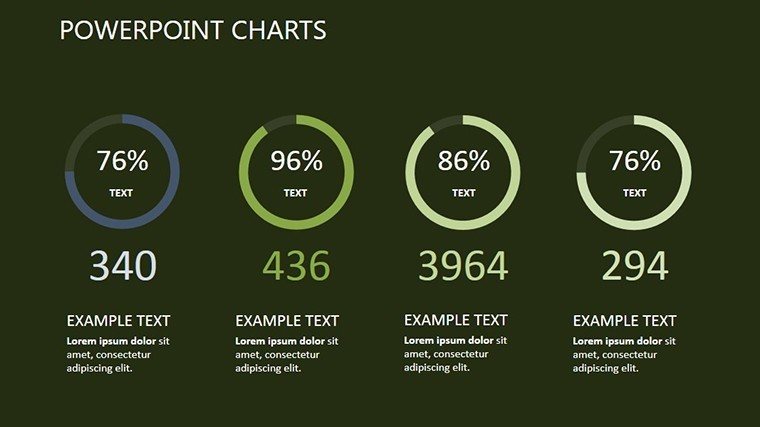
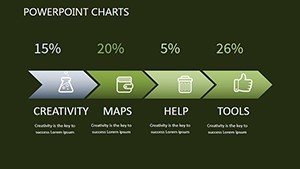
- Slides 9-12: Comparisons: Efficiency graphs.
- Slide 13: Future Outlook: Projection visuals.
Thumbnails aid navigation.
Tips for Eco-Presentations
Pair with real data from SlideEgg for authenticity. Stands out with illustrations over text-heavy slides.
Power Your Green Vision Now
Download and energize your message.
Frequently Asked Questions
What sources are covered?
Solar, wind, hydro, biomass, geothermal, tidal/wave.
How editable?
Fully, for colors and data.
Suitable for beginners?
Yes, intuitive design.
Can I add animations?
Easily in PowerPoint.
Any eco-icons?
Included for enhancement.
Format details?
PPTX, widescreen.