Gadget PowerPoint Charts Template: Present Tech with Precision


Type: PowerPoint Charts template
Category: Illustrations
Sources Available: .pptx
Product ID: PC00392
Template incl.: 12 editable slides
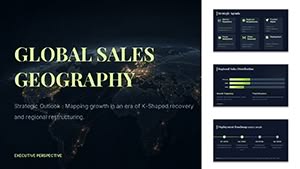
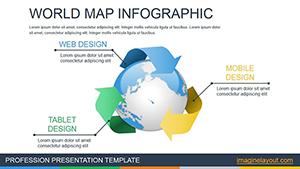
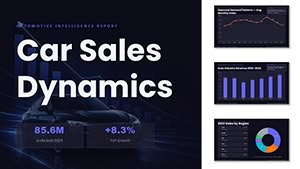
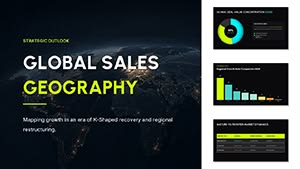
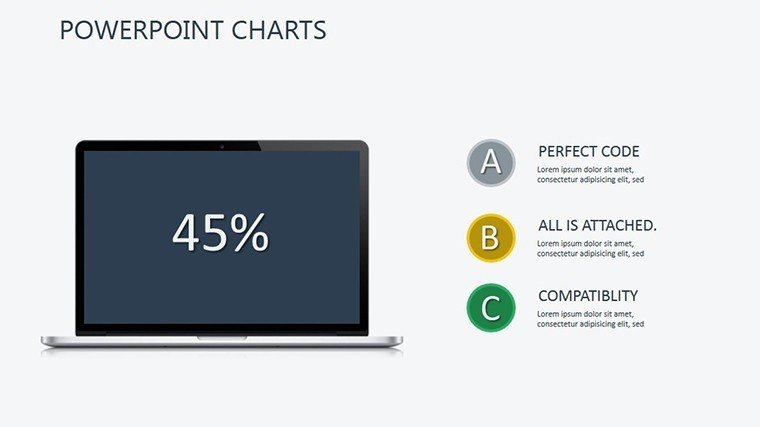
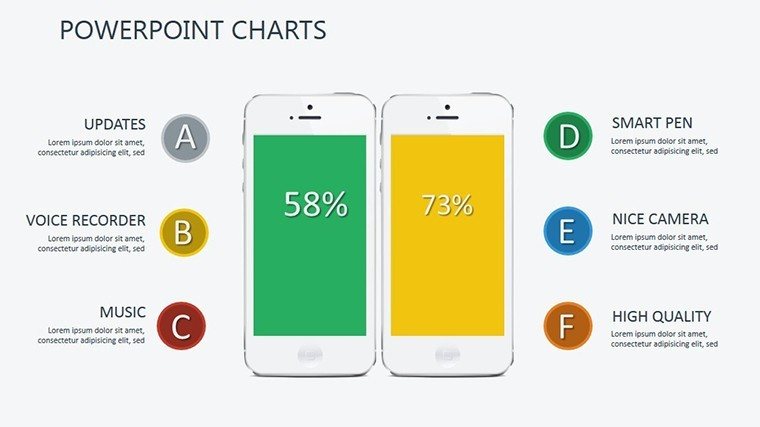
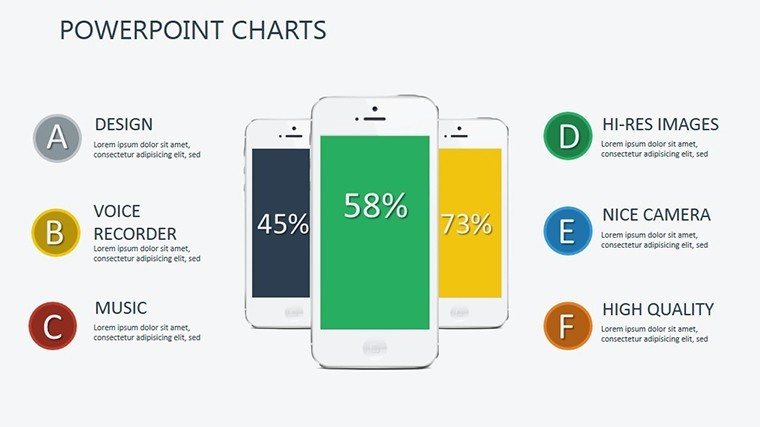
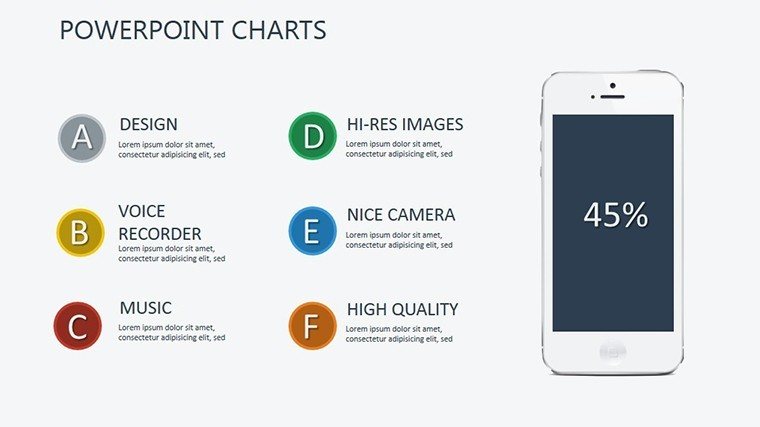
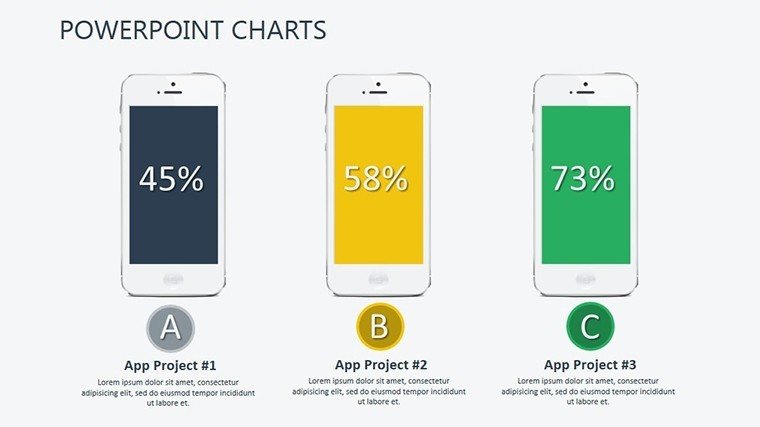
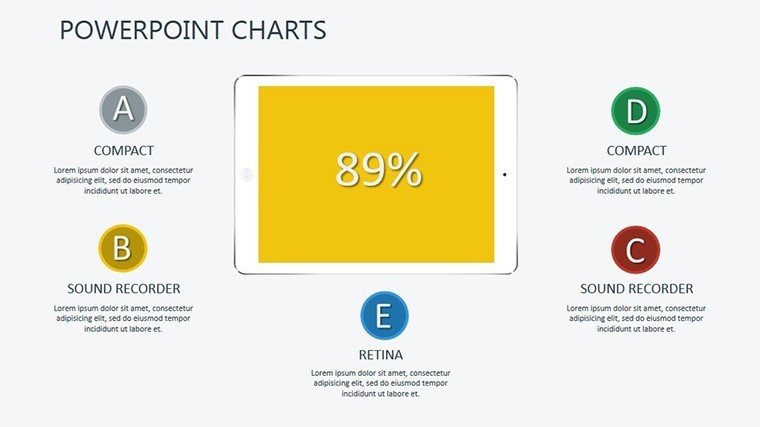
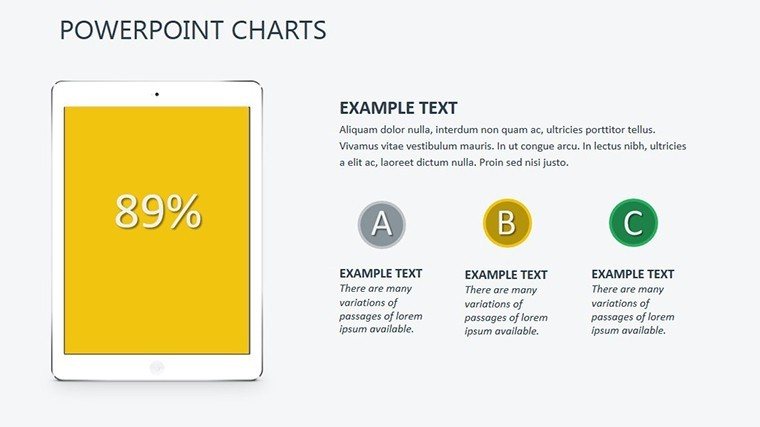
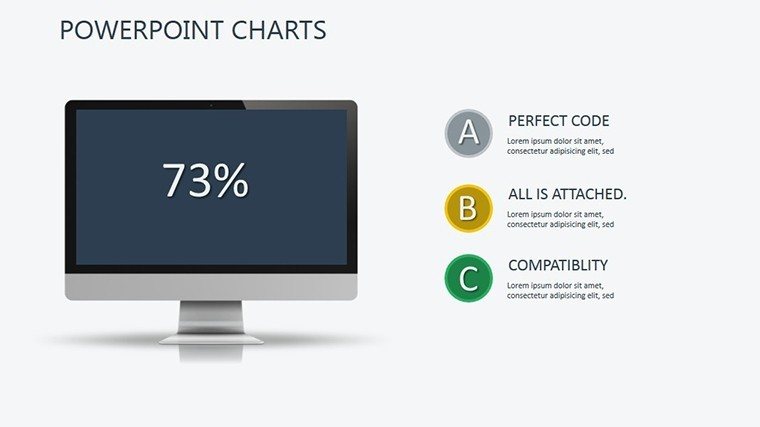
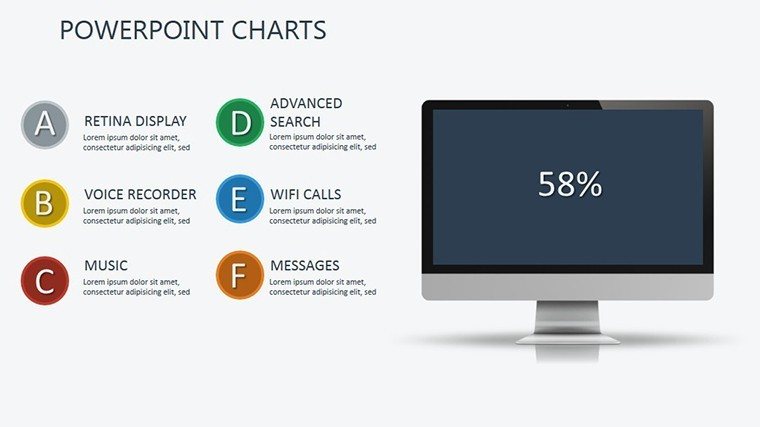
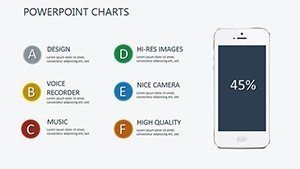
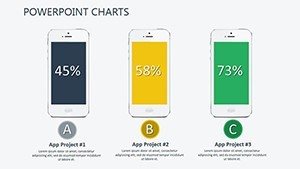
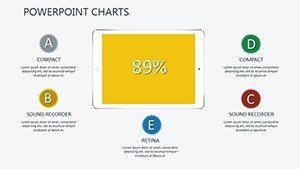
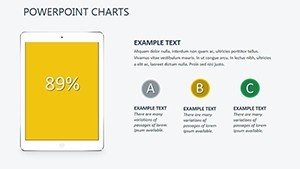
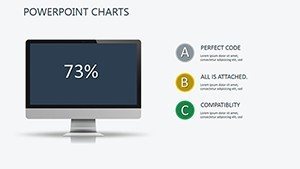
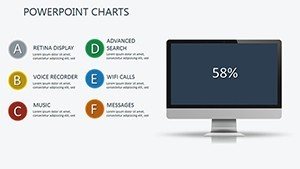
In the ever-evolving tech landscape, where gadgets redefine daily life, presenting innovations requires visuals that match their sophistication. Our Gadget PowerPoint Charts Template is your gateway to professional, eye-catching presentations that highlight device specs, market trends, and performance metrics. With 12 editable slides, it's perfect for product managers, marketers, and consultants showcasing everything from smartphone launches to IoT integrations. Featuring bar graphs for sales comparisons, pie charts for market share, line graphs for adoption curves, and more, this template offers modern designs compatible with PowerPoint and Google Slides. Customize effortlessly to incorporate your branding, turning data into dynamic stories. Think of how Apple uses sleek visuals in keynotes - this template brings that polish to your pitches, helping secure deals or educate teams. It's designed to save time, boost engagement, and position you as a tech-savvy expert in a competitive field.
Standout Features for Tech-Focused Presentations
Engineered for the gadget industry, the template's features ensure your data shines in high-tech contexts.
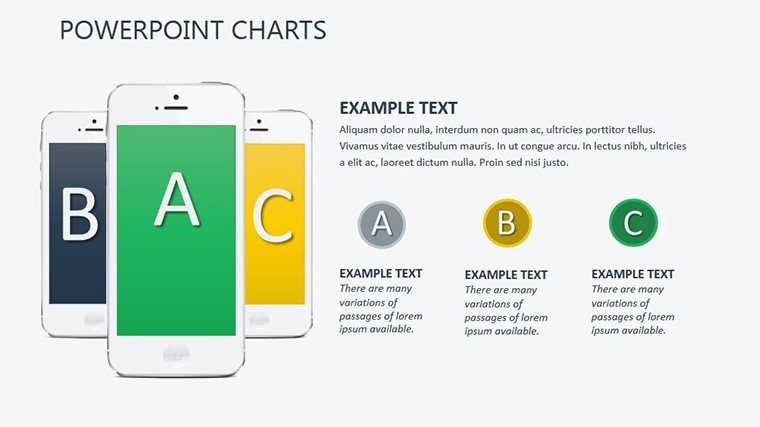
- Versatile Graph Options: Adaptable for diverse data like battery life benchmarks or user feedback ratings.
- Customization Tools: Alter colors, fonts, and elements to reflect gadget aesthetics, like metallic gradients for a premium feel.
- Modern Layouts: Clean, intuitive designs that facilitate quick comprehension in fast-paced meetings.
- Support Resources: Included documentation for maximizing use, from basic edits to advanced animations.
Inspired by design principles from firms like Gartner, these ensure your presentations meet industry standards for clarity and impact.
Key Benefits Driving Tech Success
Beyond features, the benefits transform how you communicate gadget insights. For sales teams, it streamlines pitches, as evidenced by startups using similar tools to attract venture capital. Marketers can analyze campaigns with precision, identifying trends that optimize strategies. Consultants benefit from professional visuals that build client trust. This template cuts design time significantly, allowing focus on innovation. Unlike basic charts, its gadget-themed icons - think circuit patterns - add relevance, making presentations more immersive and persuasive.
Implementation in Gadget-Related Scenarios
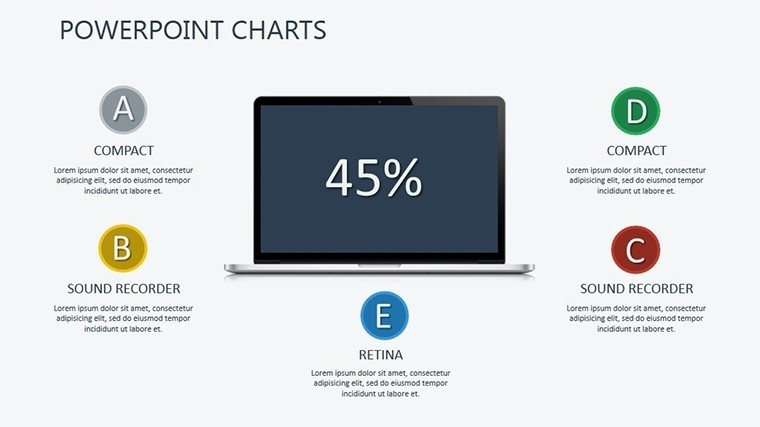
Apply it seamlessly across use cases. In product launches, use line graphs to show evolution from prototypes to market-ready devices.
- Data Prep: Aggregate specs and metrics from sources like CES reports.
- Visual Creation: Input into charts, tweaking for emphasis on unique selling points.
- Delivery: Present with confidence, using transitions to reveal insights progressively.
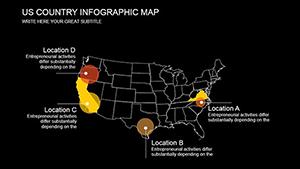
For market analysis, pie charts break down competitor shares, as in Samsung's strategy sessions. A real example: A wearable tech company boosted sales by 30% with data-driven pitches using analogous templates. Educators can use it to teach tech trends, fostering interactive learning.
Tips to Amplify Your Tech Narratives
Enhance with storytelling: Frame charts around user journeys, from discovery to adoption. Ensure mobile compatibility for on-the-go reviews. Incorporate humor, like quirky icons for gadget fails, to lighten tech-heavy content. Align with standards from the Consumer Technology Association for credibility. This template empowers you to not just present data, but to inspire tech enthusiasm.
Innovate your gadget presentations - download now and captivate your audience.
Frequently Asked Questions
How many chart types are included?
Several, including bar, pie, and line graphs, all fully customizable.
Is it compatible with older PowerPoint versions?
Yes, works with recent versions and Google Slides.
Can I use it for non-tech topics?
Sure, its versatile designs adapt to various industries.
Are animations built-in?
Yes, with options to add or modify for dynamic effects.
What support is provided?
Comprehensive docs and team assistance upon purchase.