Human Factors Psychology PowerPoint Charts Template - Fully Editable | Instant Download


Download the Human Factors Psychology PowerPoint Charts Template with 13 editable slides, matrix charts, puzzle diagrams and cognitive animations. Ideal for UX, ergonomics and psychology presentations. Compatible with PowerPoint and Google Slides. Instant download.
What's Included
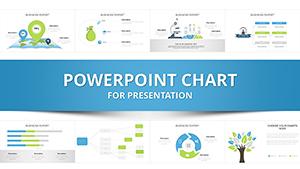
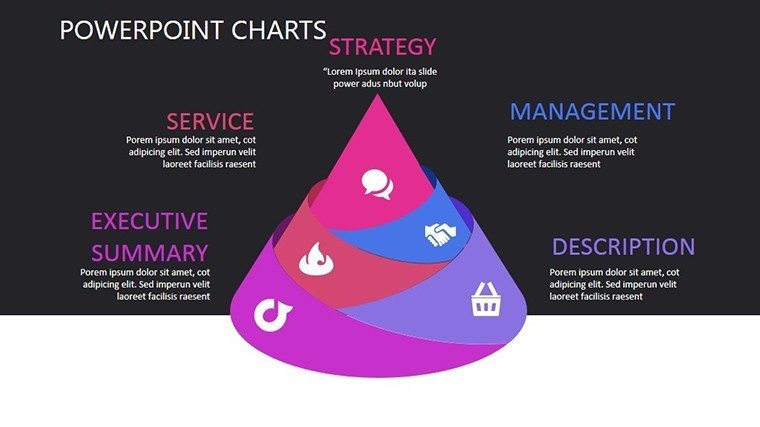
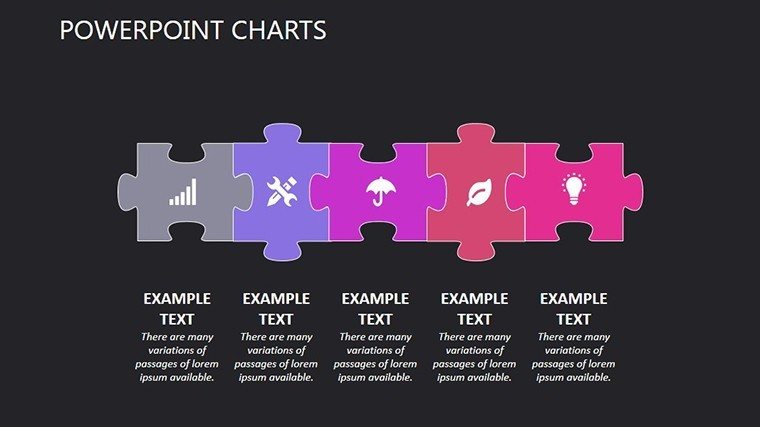
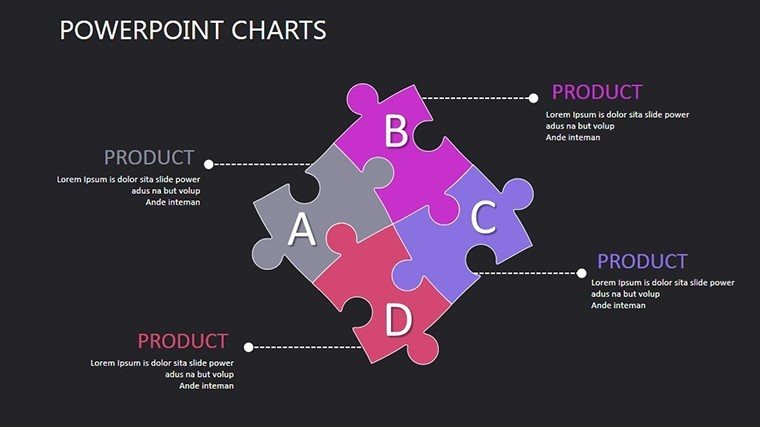
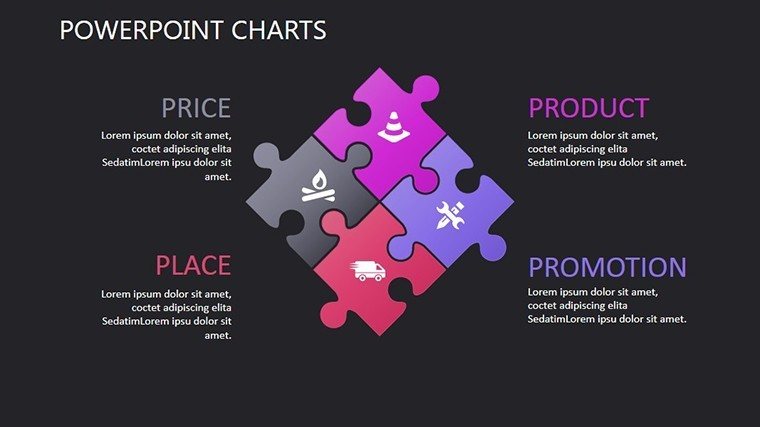
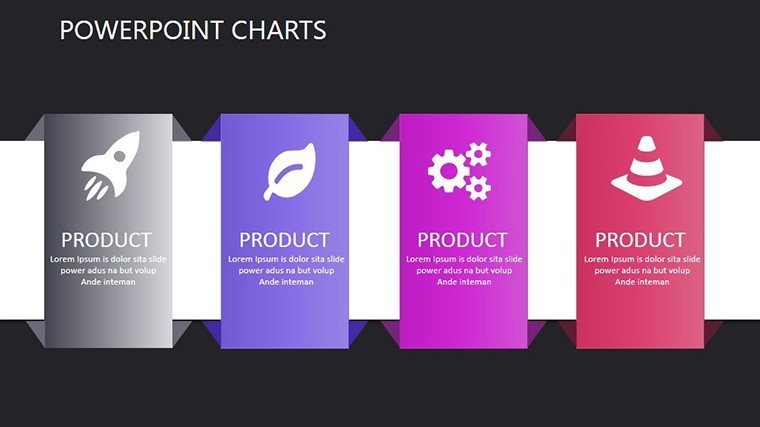
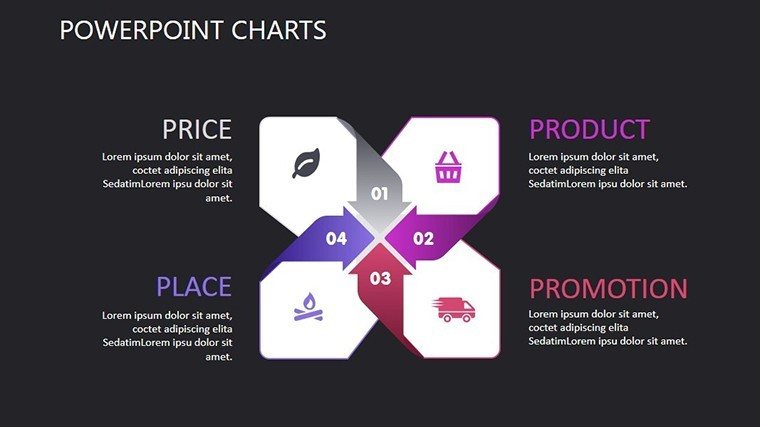
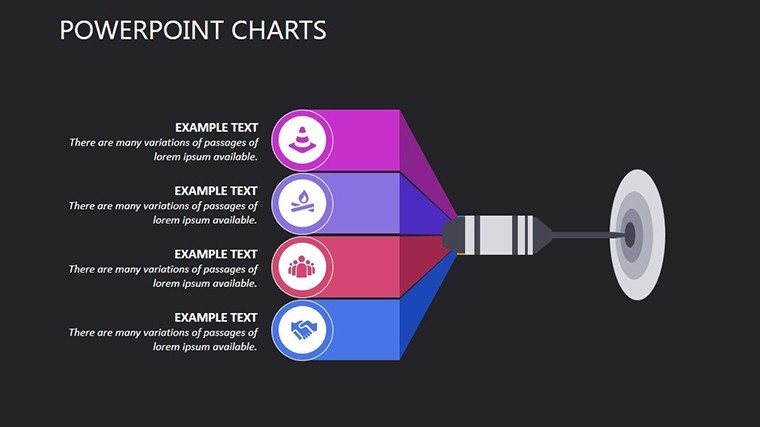
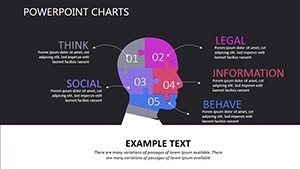
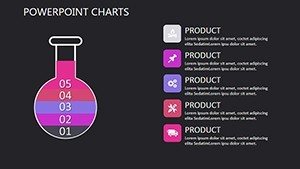
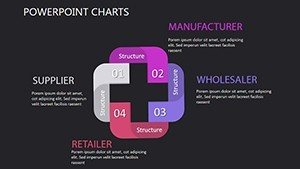
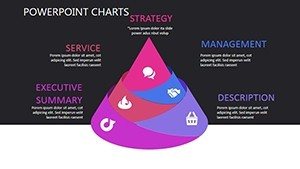
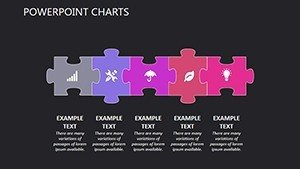
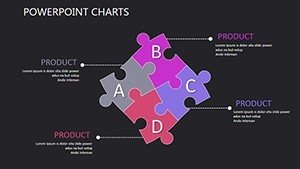
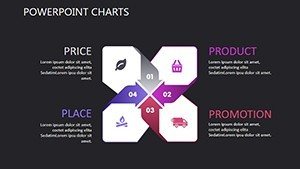
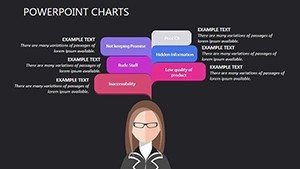
The Human Factors Psychology PowerPoint Charts Template includes exactly 13 slides in .pptx format with product reference PC00389. The set features matrix-style charts for multidimensional data, puzzle-like diagrams for interconnected concepts, and dedicated animations such as the error types slide that reveals elements sequentially from slips to mistakes to mirror cognitive processing. Color gradients use reds for high cognitive demand and blues for optimal flow states. The first visible content block above the fold describes this as a gateway to making complex psychological concepts accessible and engaging. The template is fully compatible with PowerPoint and Google Slides with customizable layouts, animations and data placeholders. All elements are ready for immediate use after instant download at the listed price of $16.00 in the PowerPoint Charts category.
Core Visual Assets
You receive the complete 13-slide package with every chart and diagram pre-built for human factors topics. This covers the matrix and puzzle styles plus the animated error classification slide. No additional files are needed as everything is contained in the single .pptx download.
Key Features
This template stands out with its psychology-specific design elements not found in general chart packs. Every slide is fully editable with data placeholders, animation builds and color fills that follow the cognitive demand gradient system.
| Feature | Details |
|---|---|
| 13 Editable Slides | Matrix charts, puzzle diagrams and error animation slide |
| Color Gradients | Reds for high demand, blues for optimal flow |
| Built-in Animations | Sequential reveals mimicking cognitive processing |
| Data Placeholders | Easy text and number replacement |
| PowerPoint + Google Slides | Full compatibility across platforms |
| Customizable Layout | Resize, recolor and rearrange freely |
Professional Use Cases
For UX Researchers in Tech
A UX researcher at a software company preparing a usability study report used the error types animation slide to demonstrate slips versus mistakes to the product team. The sequential reveal helped the audience follow the cognitive flow, resulting in clearer feedback and prioritized design fixes during the meeting.
For Human Factors Engineers in Manufacturing
A human factors engineer at an automotive plant presented workstation ergonomics findings to safety managers. The matrix-style charts with red-blue gradients clearly highlighted high-demand areas versus optimal flow states, enabling the team to approve targeted improvements without confusion.
For Psychology Educators
A university lecturer delivering a module on cognitive psychology employed the puzzle-like diagrams to explain interconnected human factors. Students reported better retention of the material thanks to the visual structure that matched the lecture content precisely.
How to Customize
Download the .pptx file and open in PowerPoint or Google Slides. Select any chart or diagram, update the data placeholders with your own numbers and text, then adjust the color fills using the built-in gradients for cognitive states. Animation builds can be modified in the animation pane to speed up or change the sequence. The layout is fully customizable so you can move elements, resize matrices or add your logo. The entire process follows a simple workflow: open, replace placeholders, tweak colors and animations, then export as PDF or present directly.
Switching Between Views
Because the template supports both PowerPoint and Google Slides you can edit on desktop and present on any device without compatibility issues. This flexibility is ideal when collaborating with remote teams on human factors projects.
Why Choose This Template
Compared to building charts from scratch this template saves significant time because the matrix and puzzle designs plus the error animation slide are already psychology-specific and ready. The color gradients were intentionally chosen to visually represent high cognitive demand in reds and optimal flow in blues, helping audiences grasp concepts instantly without extra explanation. A typical workflow of downloading, opening and replacing placeholders takes minutes versus hours of manual design work while delivering consistent professional quality across all 13 slides. The related chart templates on the page focus on personality or pyramids, making this the only one dedicated to human factors psychology with its unique animation and gradient system.
Ready to present human factors concepts with clarity and impact?
How do I edit the charts in this template?
Open the .pptx file in PowerPoint or upload to Google Slides. Click on any matrix chart or puzzle diagram to select elements and replace the placeholder text or data directly. Change colors using the gradient presets for cognitive demand or flow states. Adjust animation timing in the animation pane for the error types slide to control the sequential reveal. All shapes and layers remain fully editable without quality loss so you can resize, recolor or rearrange freely to match your exact human factors dataset or audience needs. The process is straightforward and usually completed in under 20 minutes even for complex updates.
Is this template compatible with Google Slides?
Yes, the Human Factors Psychology PowerPoint Charts Template is explicitly compatible with both PowerPoint and Google Slides as stated on the product page. You can open the .pptx file directly in Google Slides where all matrix charts, puzzle diagrams, data placeholders and animations transfer without issues. This cross-platform support lets you edit on any device and collaborate in real time with team members who may not have desktop PowerPoint installed. The editable elements and color gradients behave identically in both environments.
How many slides are included and what file format?
The template contains exactly 13 slides delivered as a single .pptx file. This count includes the full set of matrix-style charts, puzzle-like diagrams and the specialized error types animation slide. The .pptx format ensures maximum compatibility and preserves all animations and gradients. Upon purchase you receive the complete file instantly with no additional components required.
Can I customize the animations and colors?
Yes, every animation build and color gradient is fully customizable. In PowerPoint or Google Slides you can modify the sequential reveal timing on the error types slide or switch between red-high-demand and blue-optimal-flow schemes on any matrix chart. Data placeholders let you insert your own values while keeping the visual structure intact. This depth of customization ensures the template fits any human factors presentation topic or brand palette without starting from scratch.
What is the download and licensing process?
After purchase you receive an instant download link for the .pptx file. The template is licensed for personal and commercial use in presentations including client work and internal meetings. You may not resell the file itself. This standard approach lets you focus on delivering your human factors content professionally while the visuals handle the heavy lifting of complex concepts.
How long does it take to prepare a presentation?
Most users complete customization in 15-30 minutes by replacing placeholders and selecting color schemes. The pre-built 13 slides with animations and diagrams eliminate the need to design charts from zero. This rapid workflow lets professionals such as UX researchers or engineers concentrate on their message rather than graphic creation, delivering a polished result every time.