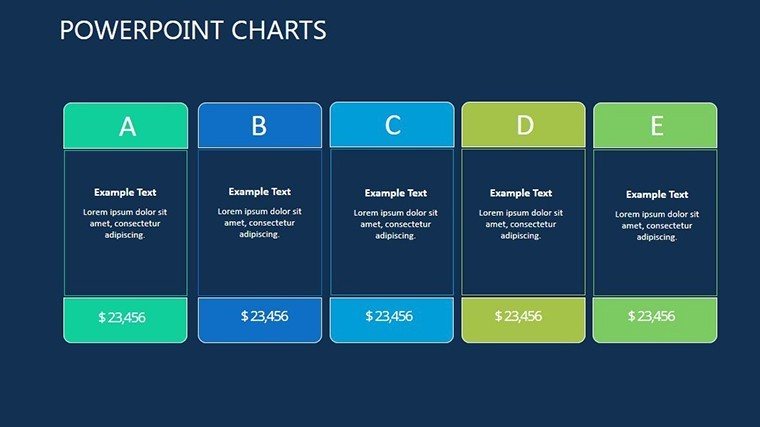
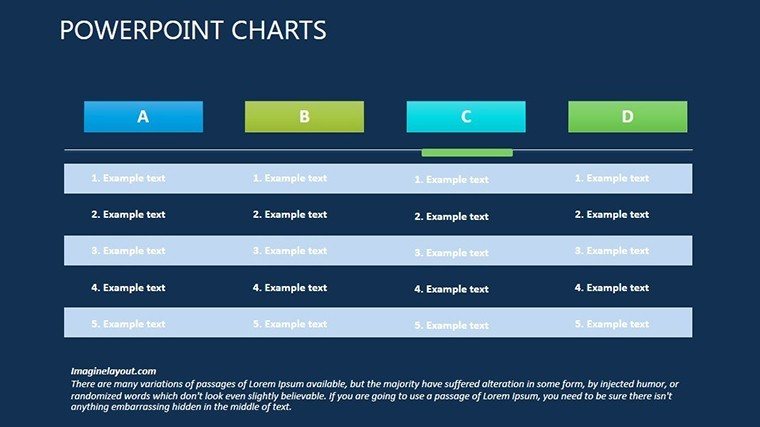
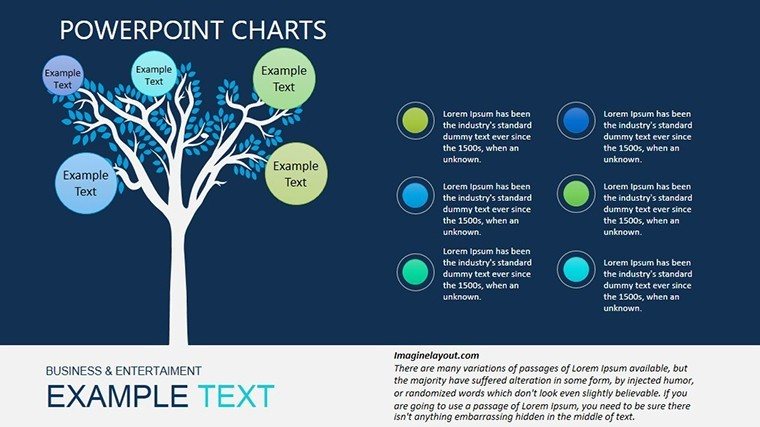
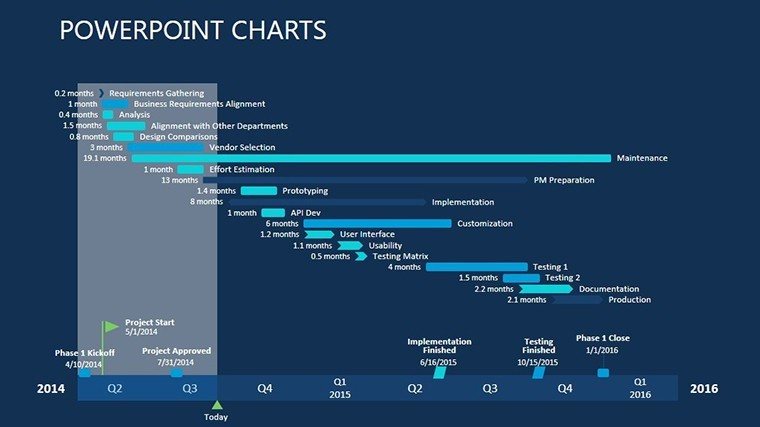
Dark Theme Analytical Charts PowerPoint Template


Type: PowerPoint Charts template
Category: Illustrations
Sources Available: .pptx
Product ID: PC00350
Template incl.: 18 editable slides
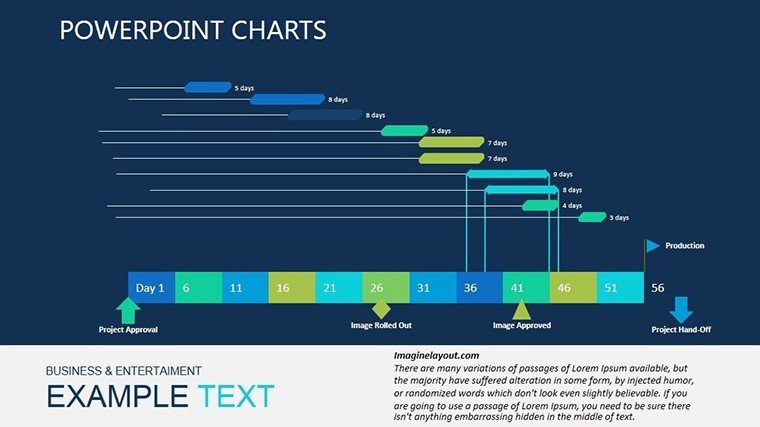
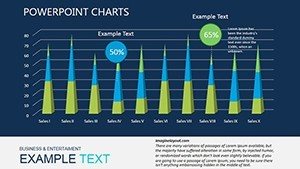
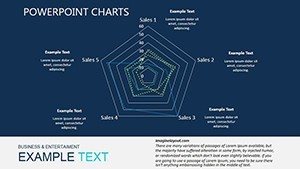
In the dim glow of conference rooms or the soft light of late-night strategy sessions, your data deserves a stage that matches the mood - sophisticated, shadowy, and strikingly clear. Enter our Dark Theme Analytical Reviews PowerPoint Charts Template: 18 editable slides crafted for those moments when insights need to cut through the noise without blinding your audience. Geared toward analysts, marketers, business leaders, and educators, this template turns quarterly drudgery into dramatic revelations, all while keeping eyes comfortable and minds focused.
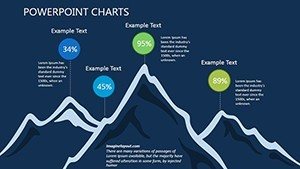
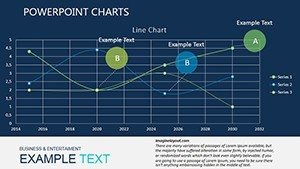
The dark canvas amplifies contrast, making line trends pop against midnight blues and subtle grays, while customizable graphs - from sleek sparklines to immersive sunbursts - handle everything from sales funnels to sentiment analysis. PowerPoint-native with Google Slides harmony, it's your shortcut to visuals that feel premium, not pieced-together. Say goodbye to washed-out defaults and hello to designs that echo the gravitas of reports from McKinsey or Gartner.
Envision a marketing director at a consumer goods giant unveiling campaign ROI in a dimly lit war room. Our dark-themed bubble chart clusters ad spend against engagement metrics, shadows adding depth to clusters that reveal high-performers. The team not only grasped the data instantly but brainstormed reallocations on the fly, optimizing budgets mid-quarter. Such edge-of-your-seat analytics become routine with this template's moody elegance.
Crafting Shadows into Strategic Light
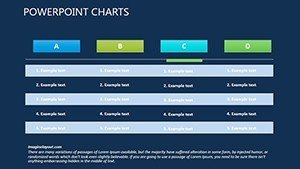
Editability defines this dark darling: Every node, line, and label is tweakable, with high-res vectors preventing blur on 4K displays. Inspired by nocturnal data viz trends in tools like Tableau Public, it prioritizes legibility - bold sans-serifs, ample whitespace, and glow effects for emphasis - while dodging eye strain in low-light environments.
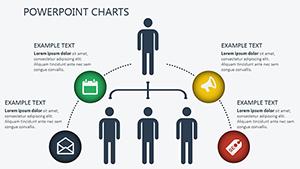
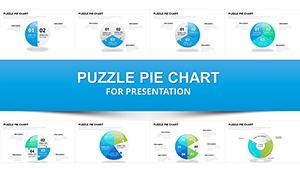
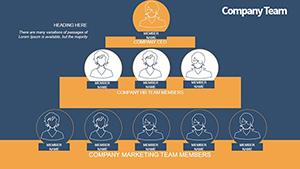
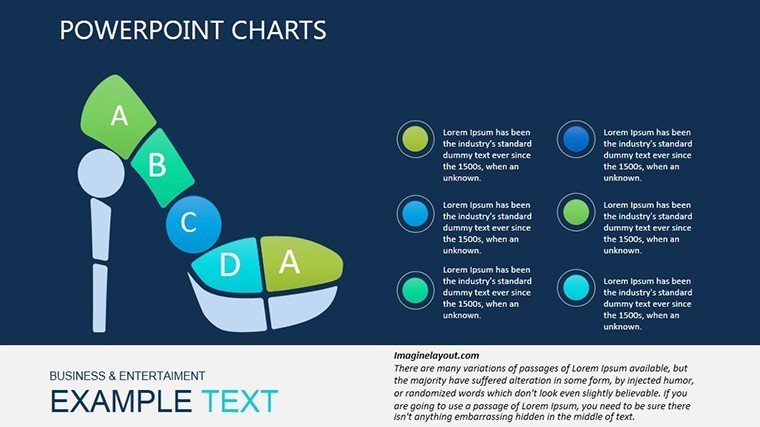
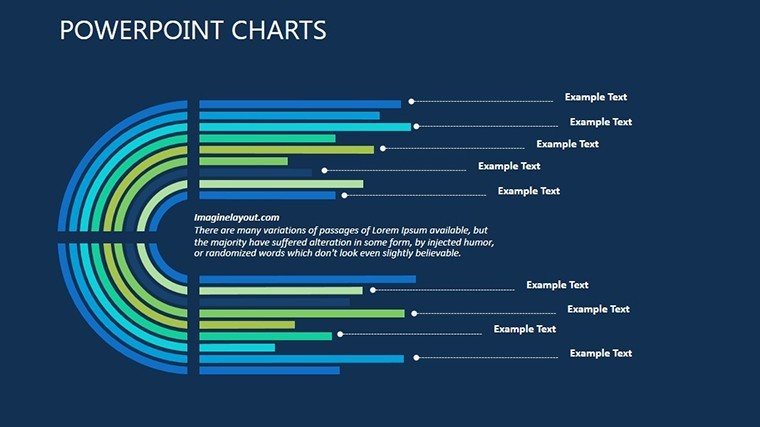
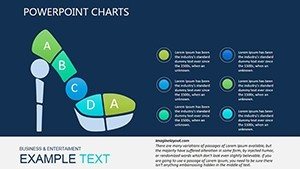
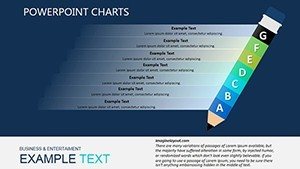
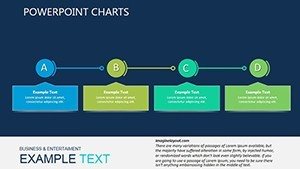
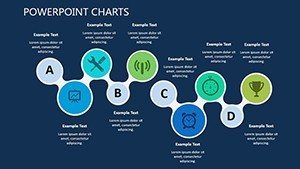
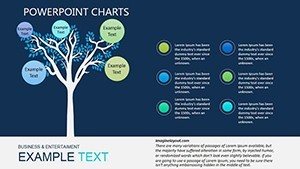
- Sunburst Hierarchies: Radial breakdowns for org structures or market shares, with dark rings that layer depth intuitively.
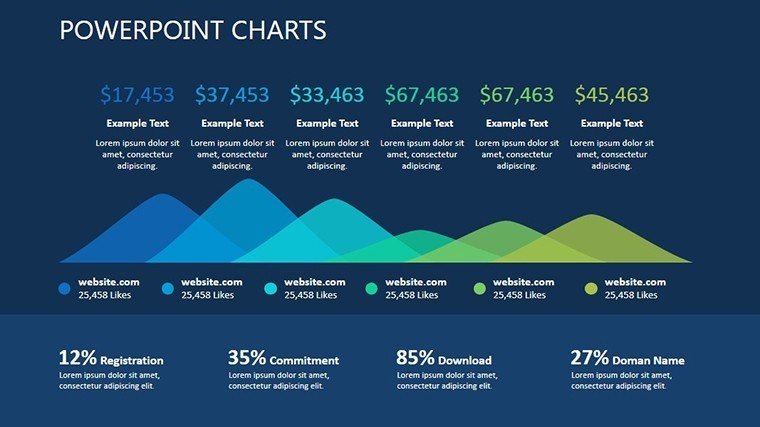
- Sparkline Sequences: Mini-trends tracking over time, ideal for executive dashboards without overwhelming the slide.
- Contour Plots: Heat-like maps for risk landscapes, where shadows delineate hot zones seamlessly.
Theme consistency is baked in: Switch accents from steel gray to crimson for urgency, or embed your logo without clashing. Animations? Smooth fades that unveil data layers like a thriller plot, keeping viewers hooked.
Versatile Venues for Data Drama
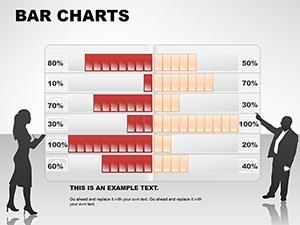
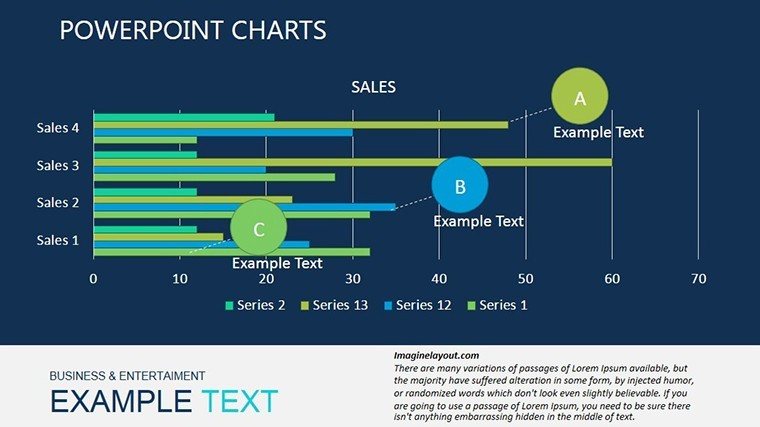
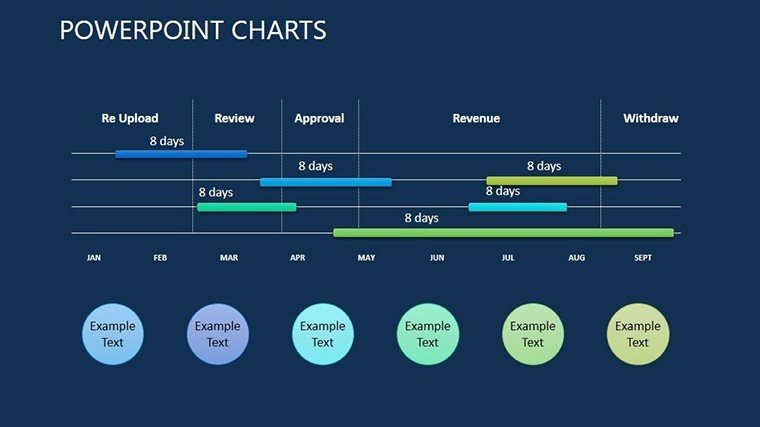
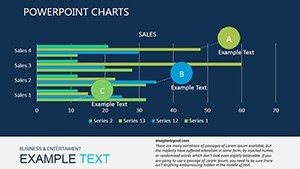
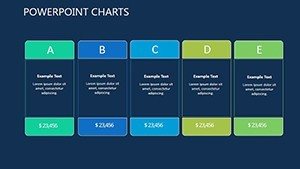
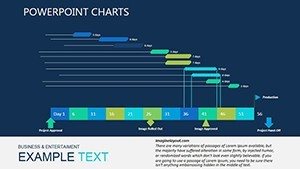
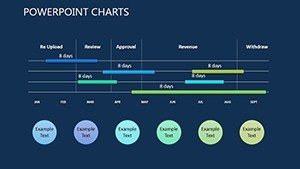
Deploy it for quarterly deep-dives, where dark bar stacks compare YoY metrics, helping finance teams spot variances in twilight-toned clarity. Marketers thrive on the funnel slides for conversion paths, a e-commerce brand in Berlin used them to trace user journeys, identifying drop-offs that informed A/B tests yielding 25% uplift.
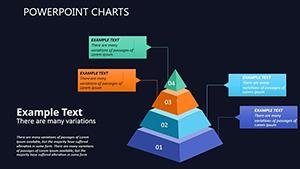
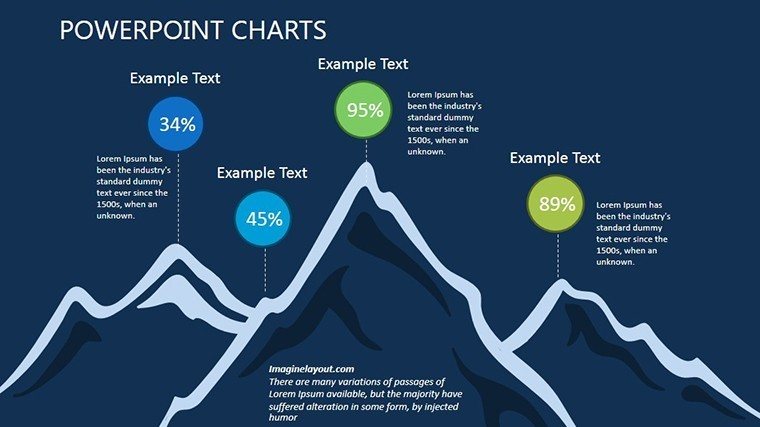
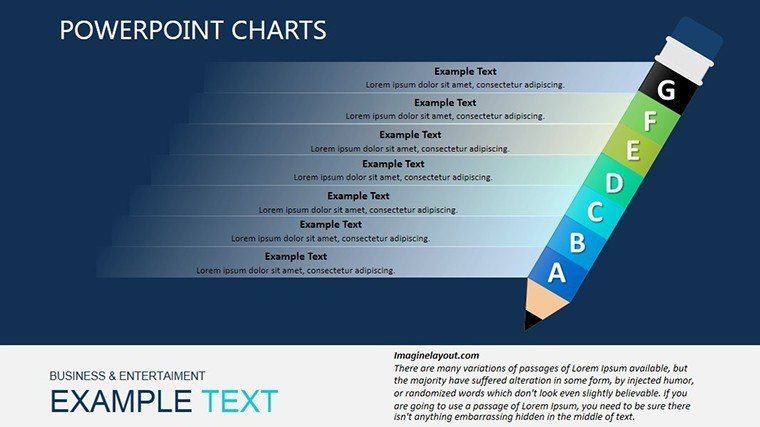
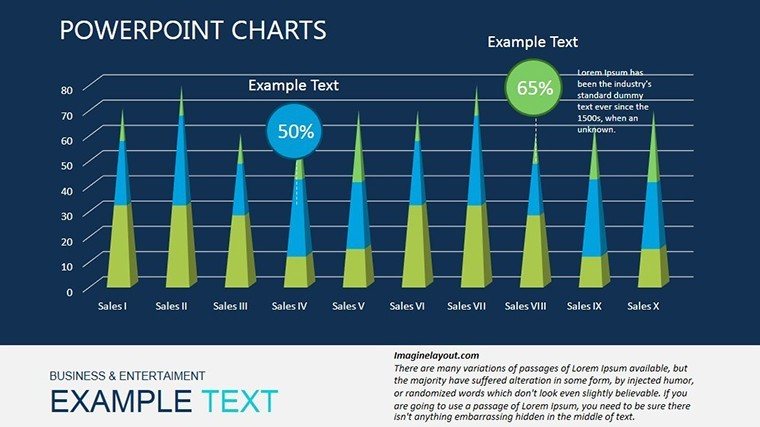
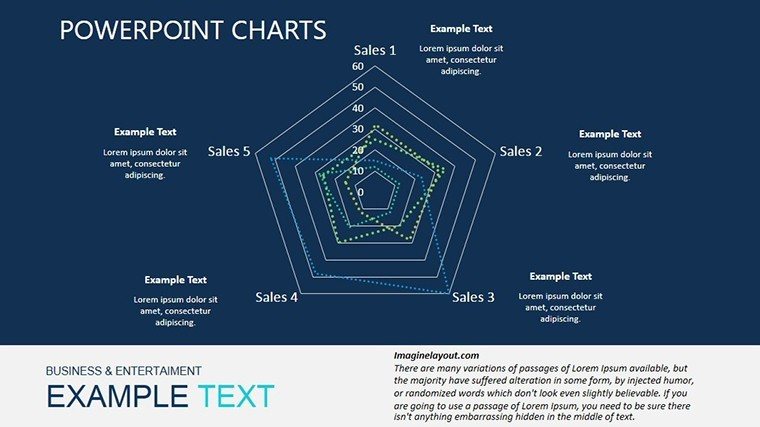
Educators can dim the lights for lecture halls, using scatter plots to plot research correlations - think sociology profs mapping social media impacts. Business leaders? Perfect for offsite retreats, where pyramid charts in shadow build from tactics to vision, inspiring alignment under starlit skies (or LED projectors).
Eclipsing Everyday Analytical Aids
Outshines basic themes with its atmospheric immersion: Where light modes fatigue in long sessions, dark enhances focus, backed by studies from Nielsen Norman Group on reduced cognitive load. No clunky workarounds - pre-set grids and smart art ensure pixel-perfect alignment every time.
- Export Excellence: PDF or video outputs retain the moody vibe for email blasts.
- Accessibility Built-In: ARIA labels for screen readers, plus color contrast checks passed.
- Hybrid Ready: Optimized for Zoom shares, with thumbnail previews that intrigue.
Streamline your process: Import CSVs for auto-population, then refine with conditional formatting for dynamic highlights. Notes sections cue narrative bridges, like "This contour's shadow hides a growth opportunity - let's explore."
Insider Secrets for Shadow Play
Maximize with hybrid elements: Overlay icons like shadowy gears for process analytics. Test in actual venues to calibrate glows. For global teams, include multilingual placeholders. In academia, cite sources via hyperlinked footnotes, bolstering credibility.
From boardrooms to basements, this template casts your analytics in a light that's equal parts mystery and mastery, turning viewers into advocates.
Illuminate Your Analytics in the Dark
Why blend into the background when you can command the shadows? Snag the Dark Theme Analytical Charts PowerPoint Template and infuse your reviews with enigmatic allure. Download instantly, customize effortlessly, and captivate completely. Your data's dark side awaits - unlock it now and own the night.
Frequently Asked Questions
Why choose a dark theme for analytics?
It boosts contrast for better readability in low-light, reducing eye strain during extended reviews.
Are the charts fully vector-based?
Yes, ensuring sharp scalability for prints, projections, or digital shares.
Can I lighten it for daytime use?
Absolutely, with a one-click theme inverter to flip to light mode.
How does it handle interactive elements?
Supports hyperlinks and triggers for drill-downs, enhancing engagement.
Is it suitable for non-business fields?
Definitely - adapts to academic or creative analytics with ease.
What file formats are included?
Primary .pptx, plus editable source files for full flexibility.