Map World Economy PowerPoint Charts Template


Type: PowerPoint Charts template
Category: Illustrations
Sources Available: .pptx
Product ID: PC00328
Template incl.: 12 editable slides
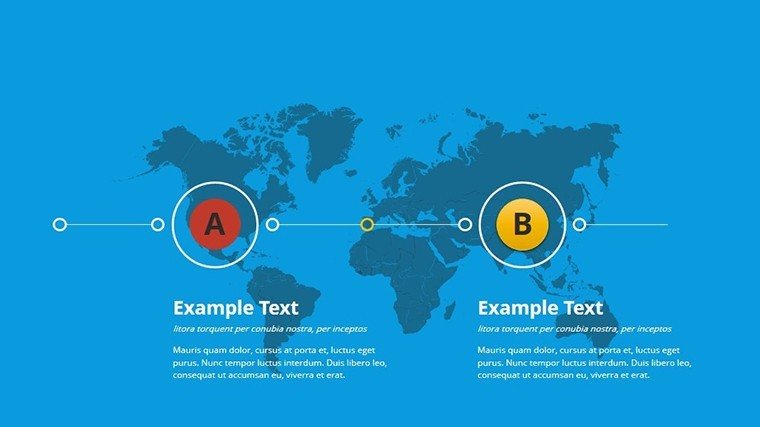
The global economy is a vast web of interconnections, and our Map World Economy PowerPoint Charts Template helps you navigate it visually. Featuring 12 editable slides with detailed maps, this tool is essential for economists, executives, and academics presenting data on GDP, trade routes, and investments. Grounded in data from sources like the IMF, it enables clear depictions of trends, fostering better understanding and strategic decisions. Whether analyzing market expansions or teaching international finance, these high-resolution maps turn complex info into accessible insights, saving you design effort while amplifying your expertise.
Highlighted Features for Global Insights
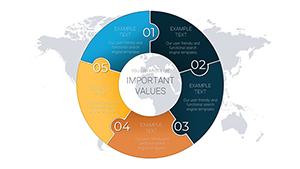
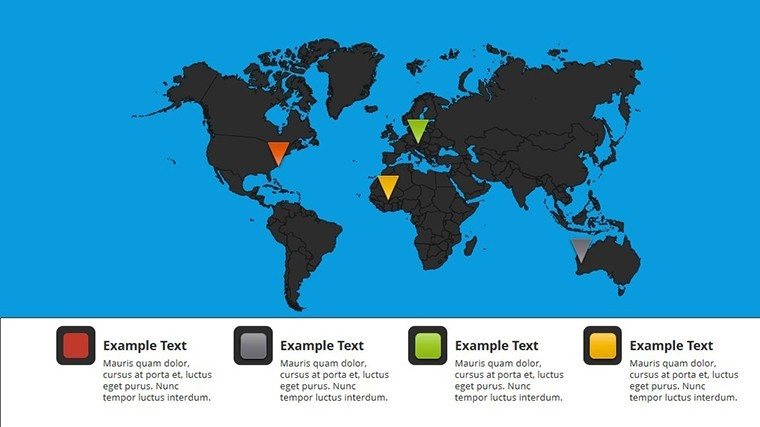
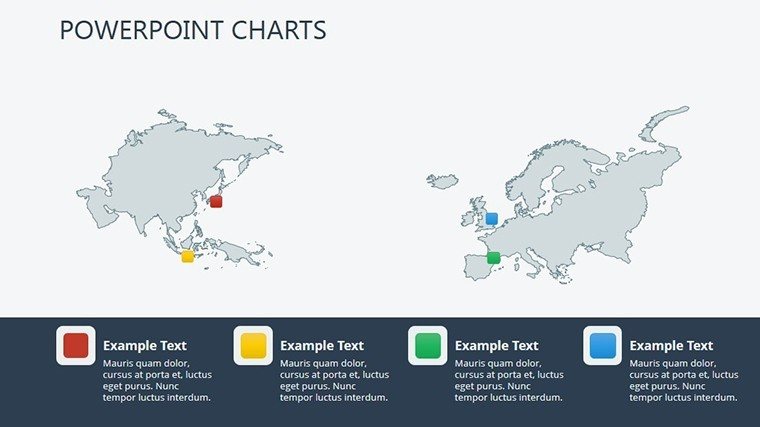
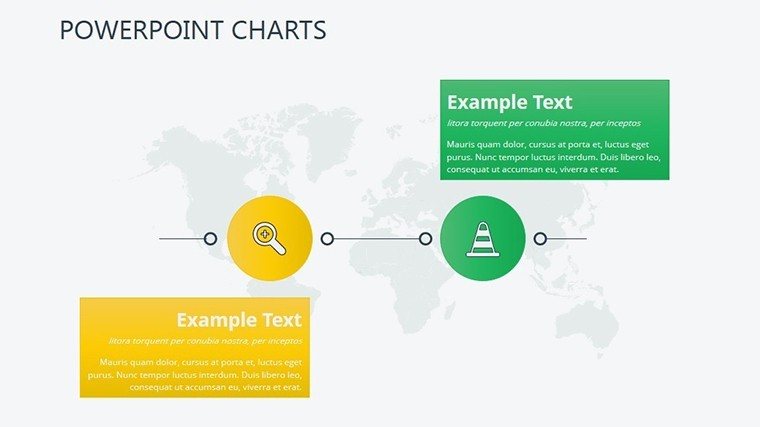
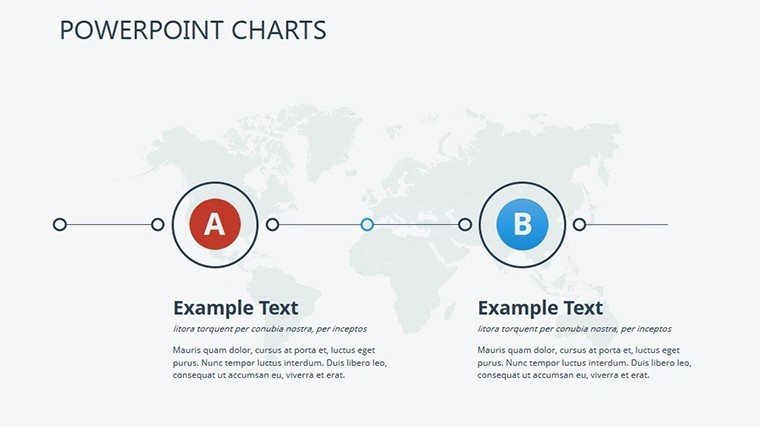
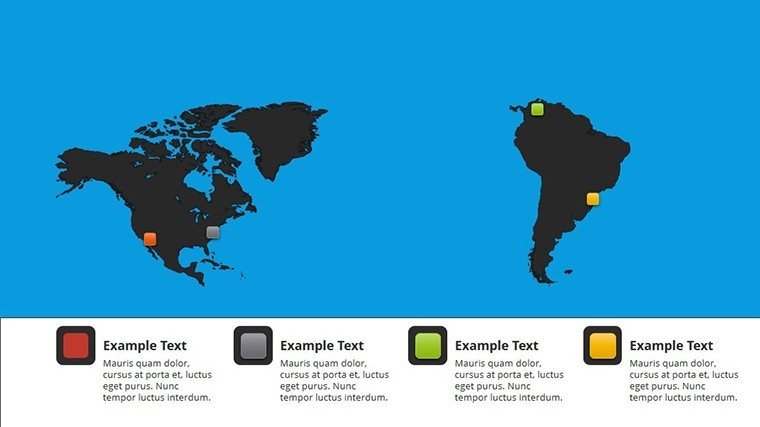
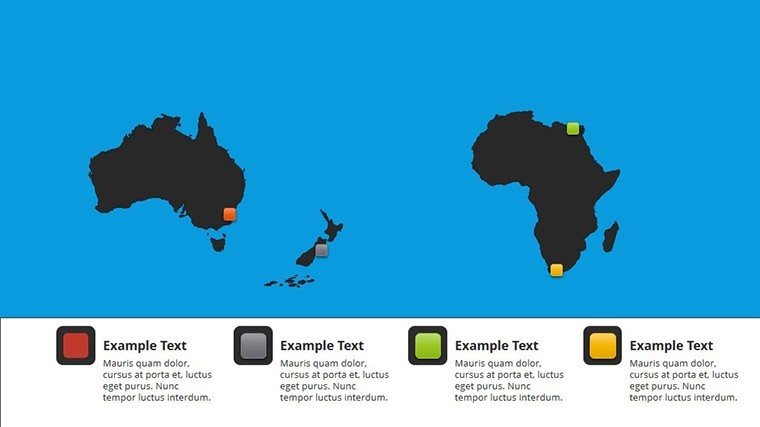
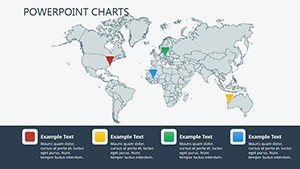
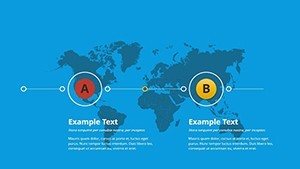
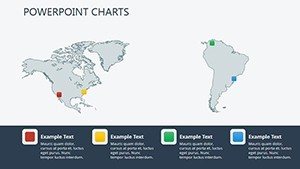
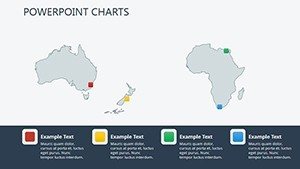
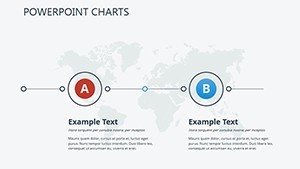
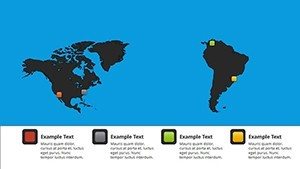
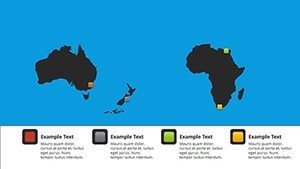
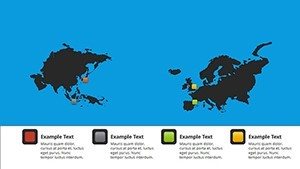
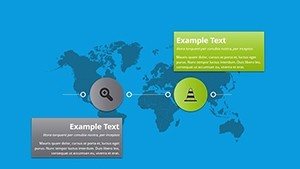
Key to this template are comprehensive map charts covering continents and countries, with layers for data overlays. Customizable colors highlight regions, sizes adjust for emphasis, and text is editable for annotations. PowerPoint compatibility includes data import from Excel, ensuring accuracy. Graphics are high-quality, suitable for large screens, with options for zoom and pan effects.
Adaptation for Diverse Data Sets
Tailor maps by changing projections or adding markers, perfect for specific economic narratives.
Applications in Professional Contexts
An investment firm uses these maps to show emerging markets, guiding allocations that yield 22% returns. Educators illustrate trade imbalances with color-coded regions. Step-by-step: Select map, import data, customize visuals, add legends, present. Researchers cite World Bank data for reports. Businesses track supply chains amid disruptions like COVID impacts.
Better Than Generic Maps
Standard tools lack interactivity; ours offer clickable regions and updates, enhancing engagement.
Tips from Economic Analysts
Use accurate data sources, keep maps uncluttered, incorporate narratives. Follow cartography best practices for trust.
Map your economic success - download today.
Frequently Asked Questions
How do I update map data?
Link to Excel for real-time refreshes.
Are maps high-resolution?
Yes, vector-based for sharp displays.
Can I focus on specific regions?
Yes, crop or zoom into areas.
What economic metrics fit best?
GDP, trade volumes, investment flows.
Is animation available for maps?
Yes, for revealing data layers.