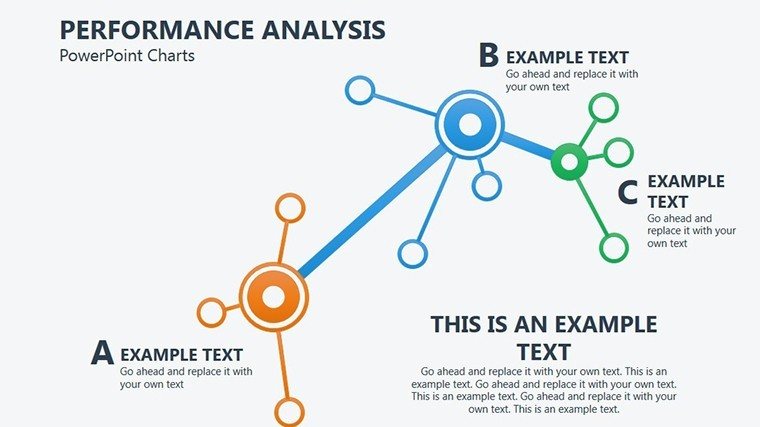
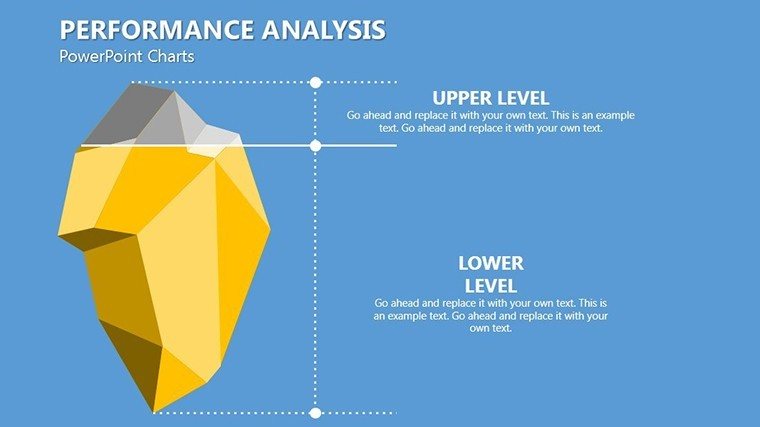
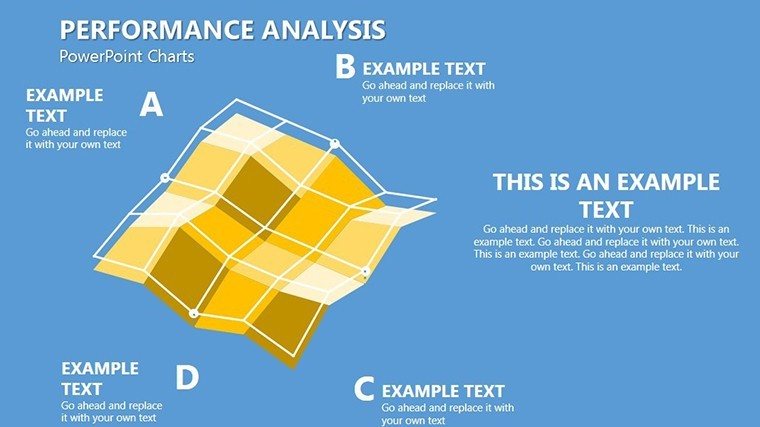
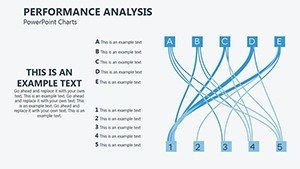
Performance Analysis PowerPoint Charts Template: Decode Data for Success
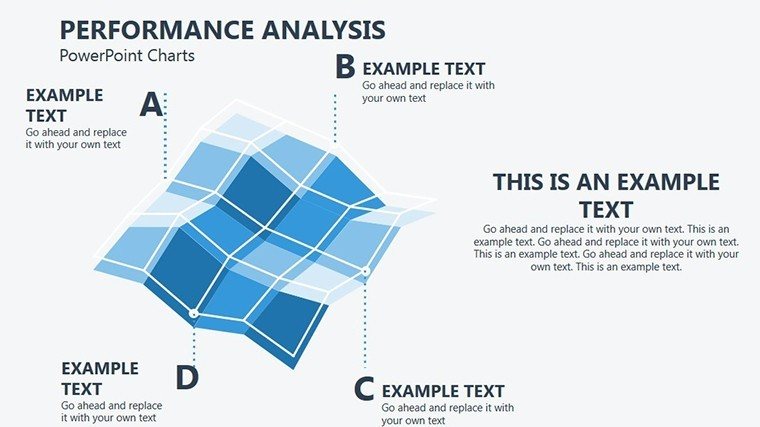


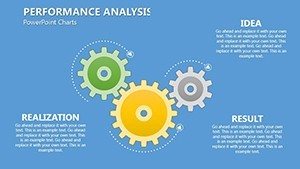


Performance metrics drive progress, and our template with 17 editable slides makes analyzing them straightforward. Focused on matrix and flow themes, this PPTX is for pros turning data into actionable strategies, from financial reviews to team evaluations. It's your key to presentations that not only inform but empower decisions.
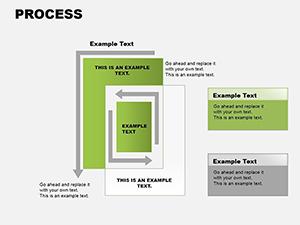
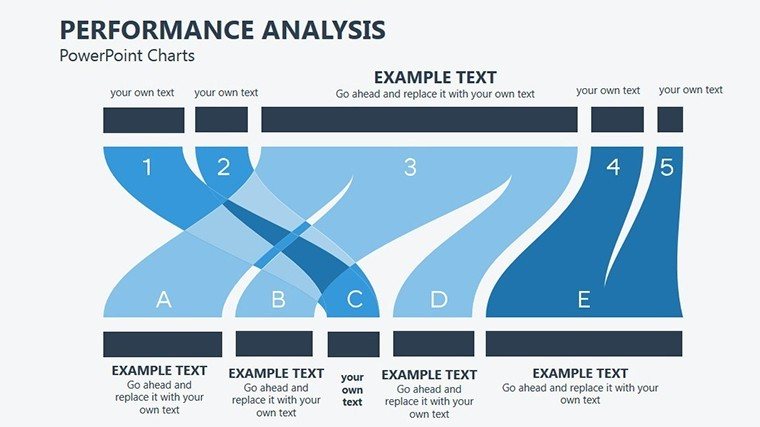
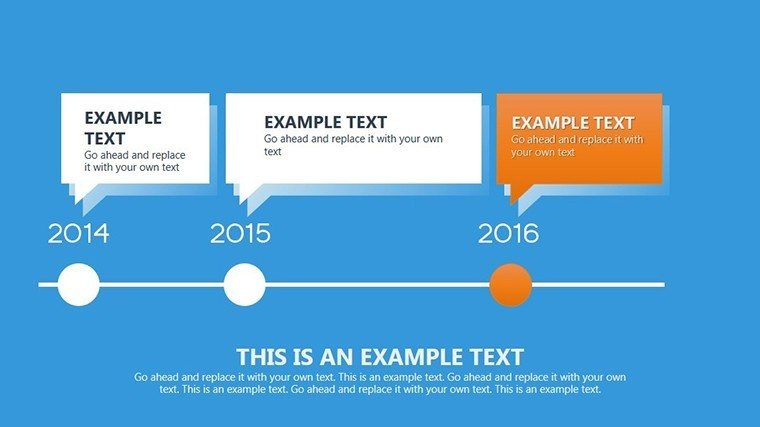
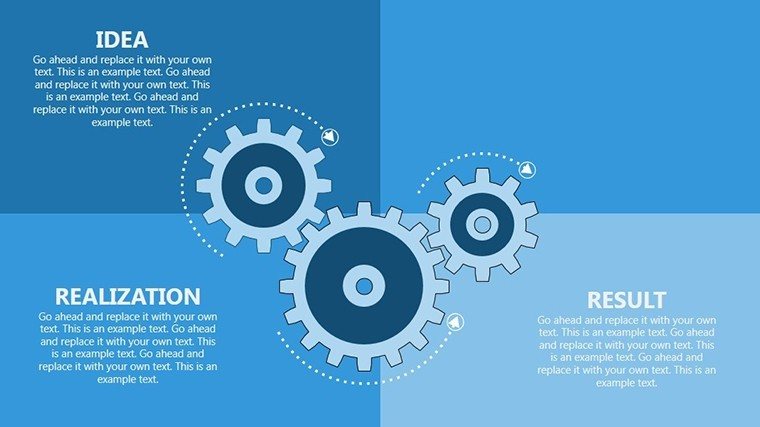
Mastering Performance with Matrix and Flow
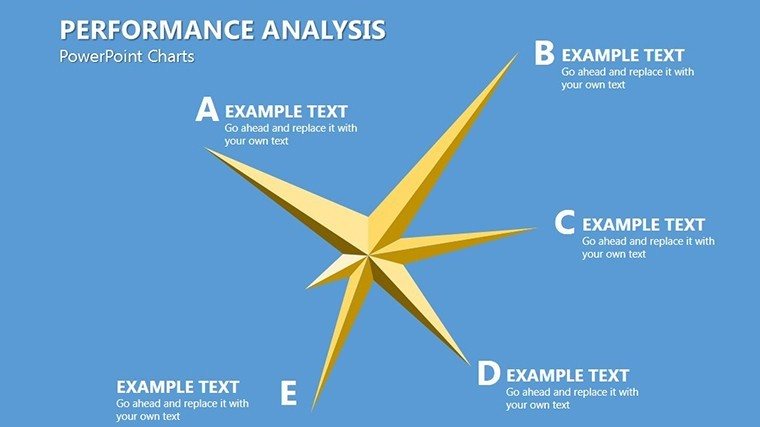
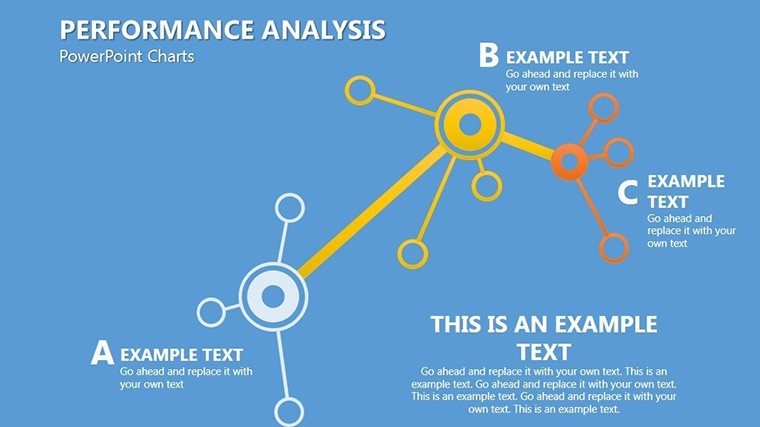
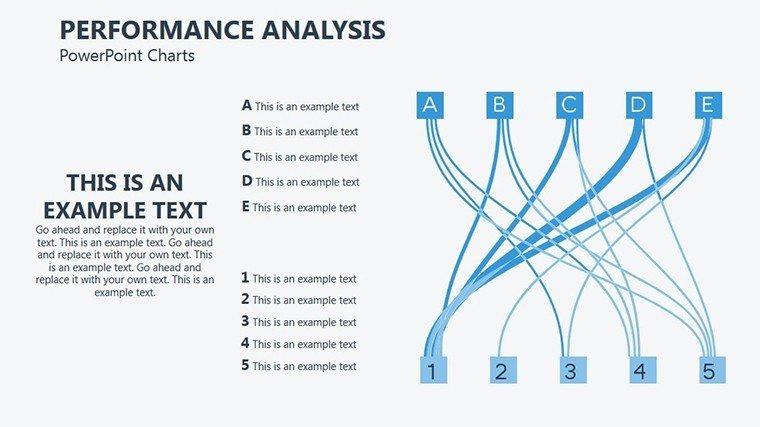
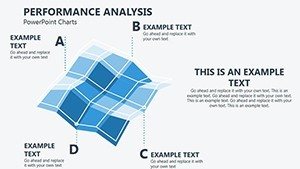
Matrix charts for comparisons, flows for processes - colors balanced for focus, fonts sharp for impact.
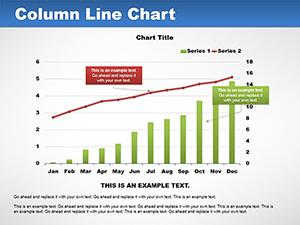
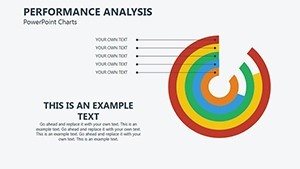
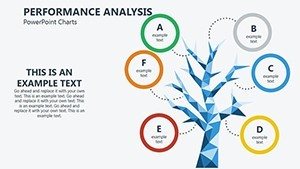
Save time, gain clarity - customize a bar graph for KPIs, inspired by Balanced Scorecard methods.
Core Features
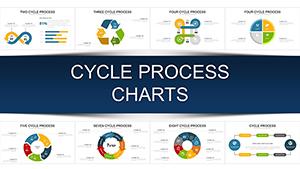
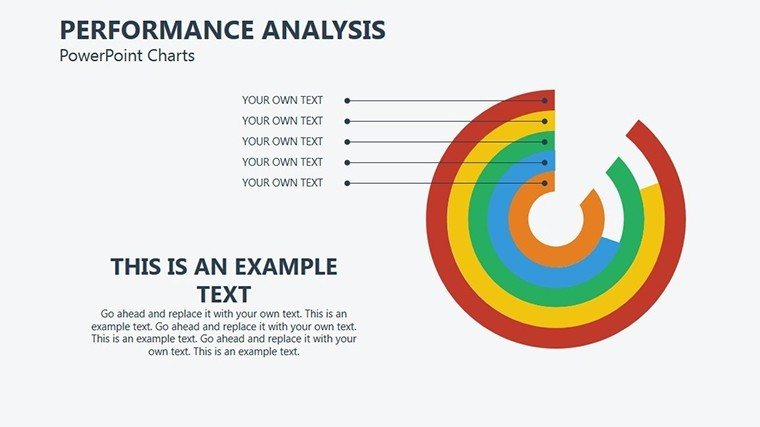
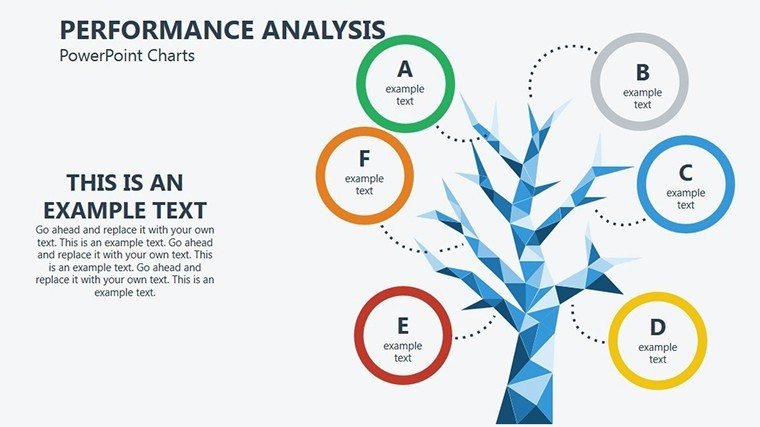
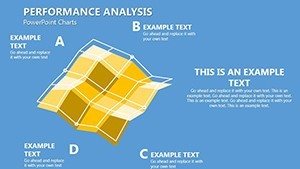
- 17 Diverse Slides: Matrices, flows, pies.
- Edit Ease: Brand alignment quick.
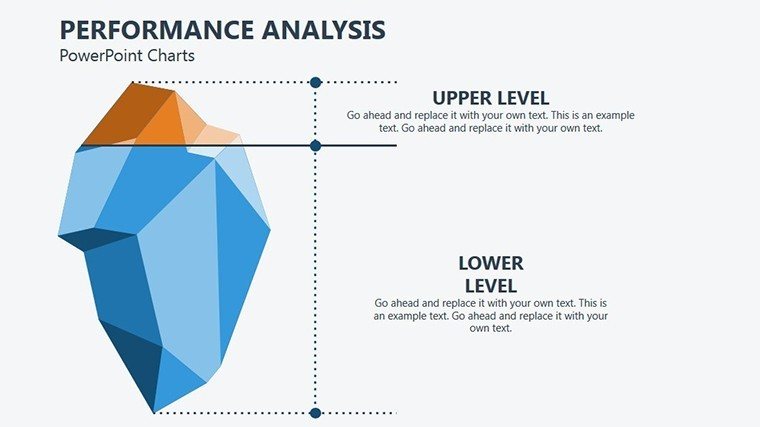
- Insightful Designs: Visual depth.
- Compatibility: Broad support.
- Dynamic Data: Update friendly.
Animations for emphasis.
Case Studies in Action
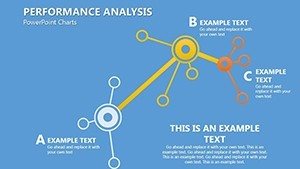
Business: Flow for sales cycles, per McKinsey models.
Educators: Matrix for student progress.
Researchers: Line plots for findings.
Step-by-Step Usage
- Map Metrics: Select format.
- Input Data: Customize.
- Enhance: Add notes.
- Rehearse: Refine.
- Execute: Engage.
Tips: Alt text essential.
Finalize: Unlock insights - download.
Frequently Asked Questions
Editable level?
Fully, all elements.
Google Slides ok?
Yes.
Business only?
No, versatile.
Format?
PPTX.
Animations?
Included, adjustable.