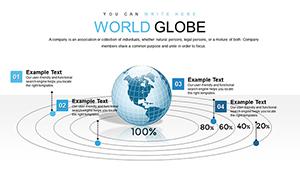
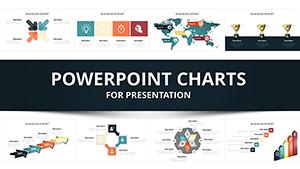
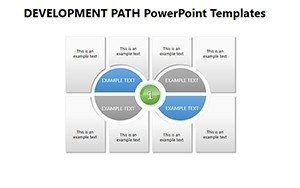
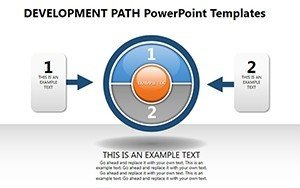
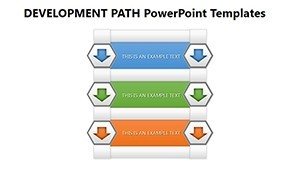
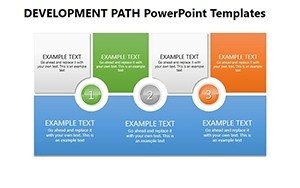
Business Development Organizational PowerPoint Charts Template


Type: PowerPoint Charts template
Category: Tables
Sources Available: .pptx
Product ID: PC00260
Template incl.: 22 editable slides
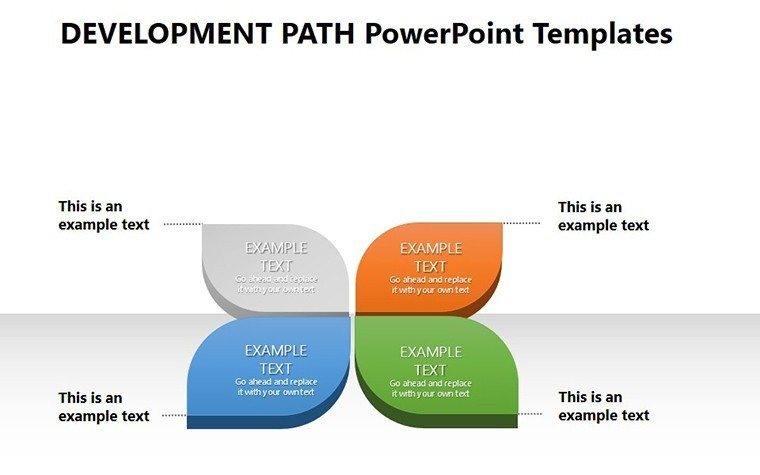
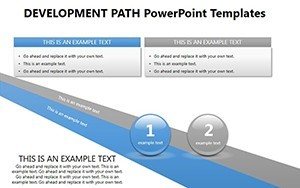
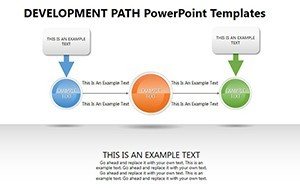
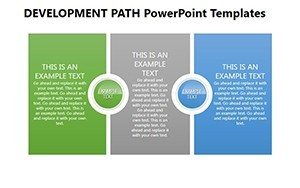
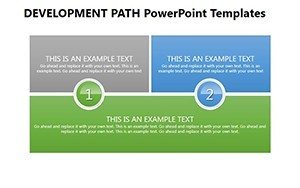
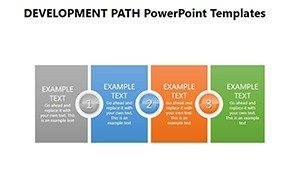
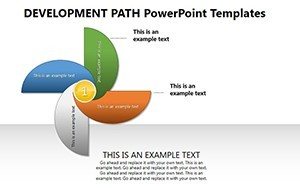
Building a thriving architecture firm involves more than blueprints; it requires a solid organizational foundation. Our Business Development Organizational PowerPoint Charts Template delivers just that, with 22 editable slides focused on mapping teams, hierarchies, and growth strategies. Ideal for firm leaders, project managers, and consultants, this tool helps you illustrate reporting lines, resource allocations, and expansion plans in a clear, professional manner. Drawing from principles like those in the AIA's firm management resources, it enables you to present complex structures - such as matrix teams for multidisciplinary projects - with ease. Fully compatible with PowerPoint and Google Slides, it integrates into your daily operations, allowing swift updates as your firm evolves. Whether scaling up for international ventures or optimizing internal workflows, this template turns organizational data into inspiring visuals that align teams and attract investors.
Crafting Robust Structures for Architectural Success
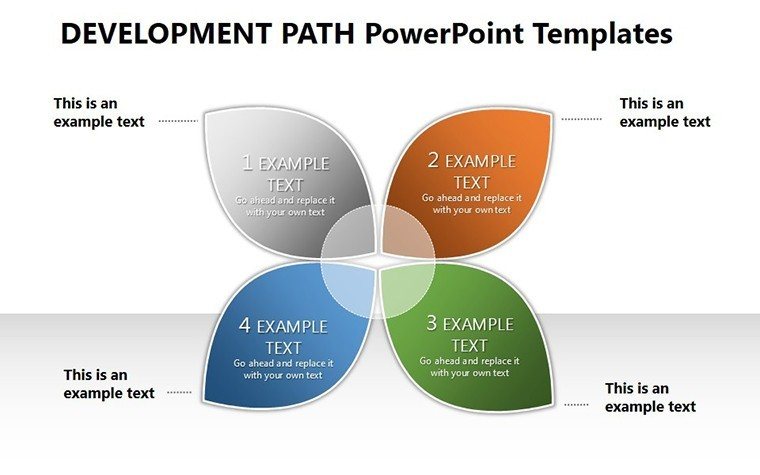
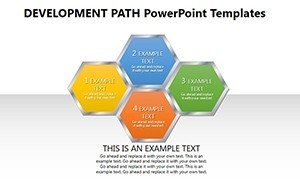
Architecture thrives on collaboration, and this template excels at visualizing it. Use hierarchical charts to depict firm leadership down to junior designers, or matrix layouts for cross-functional teams handling sustainable projects. Inspired by real successes, like how Zaha Hadid Architects structures its global operations, these slides provide actionable insights. The design emphasizes clarity with intuitive elements, ensuring compliance with professional standards and enhancing your firm's in presentations to clients or boards.
Essential Features for Seamless Organization
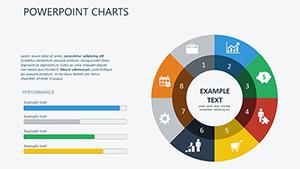
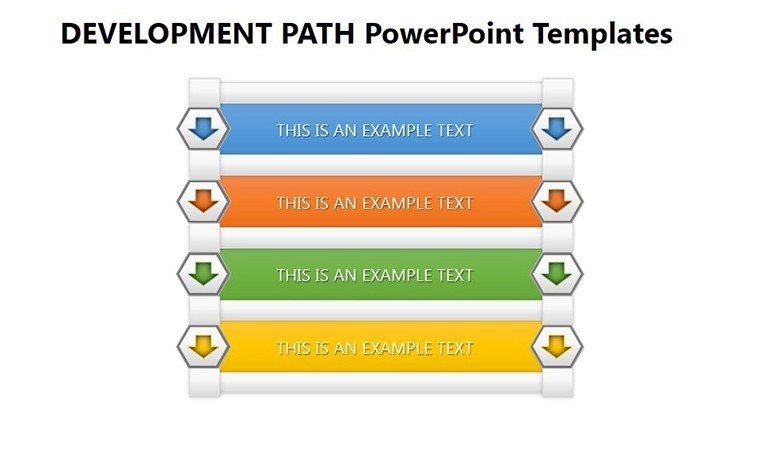
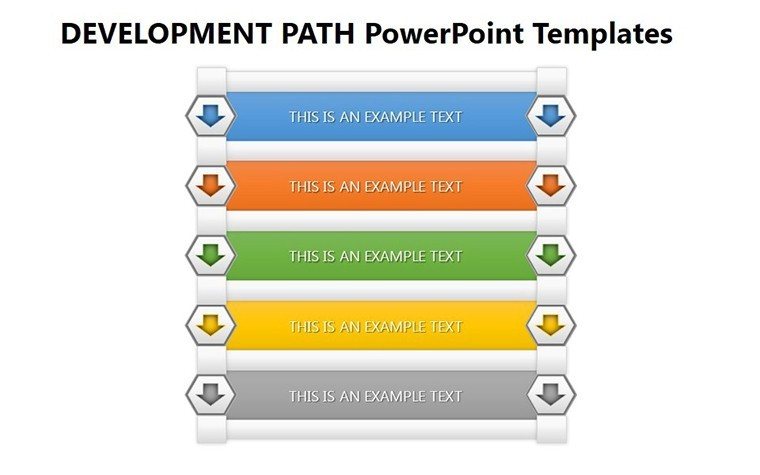
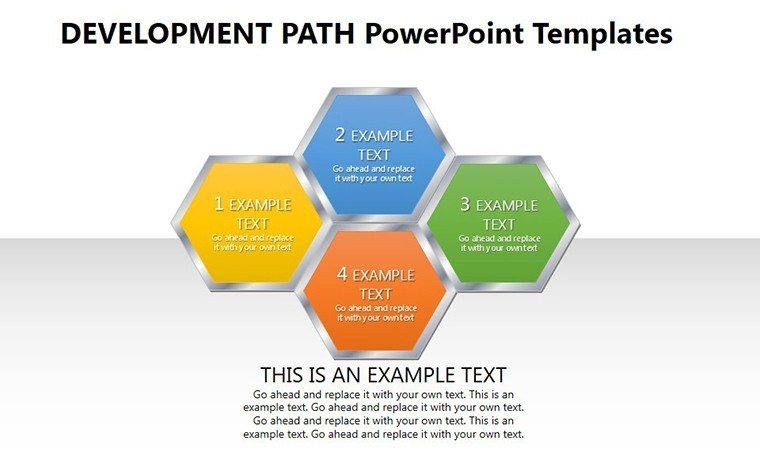
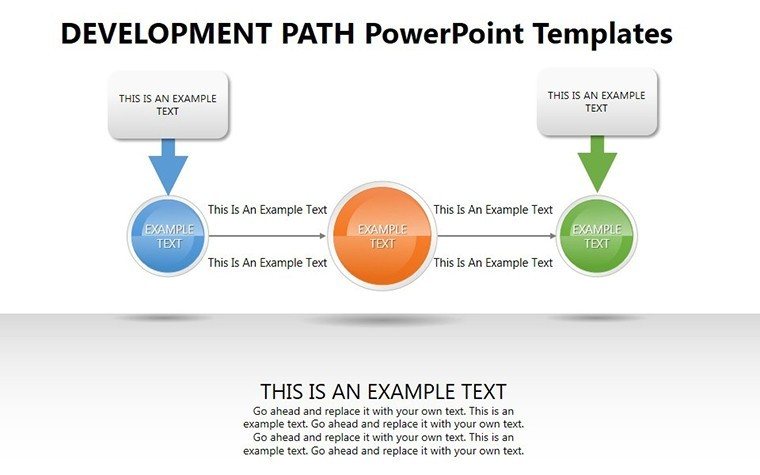
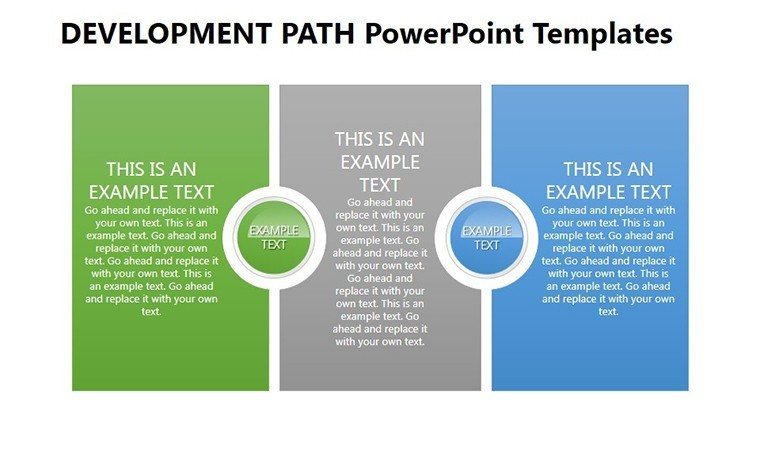
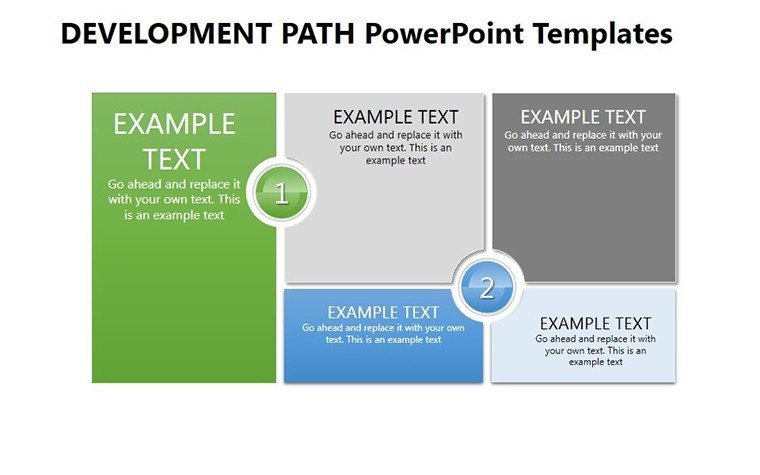
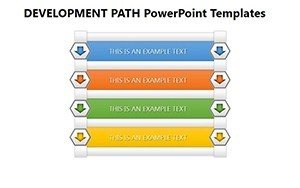
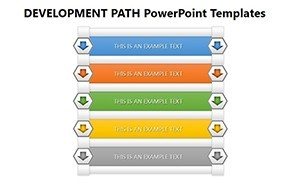
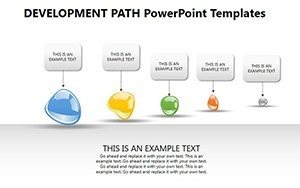
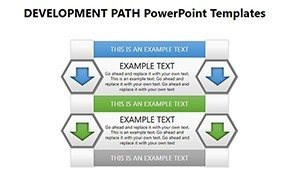
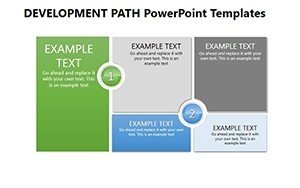
- Versatile Chart Options: Hierarchies, matrices, and tables for diverse firm needs.
- Intuitive Customization: Drag-and-drop adjustments for quick role mappings.
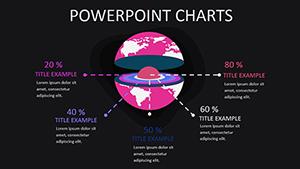
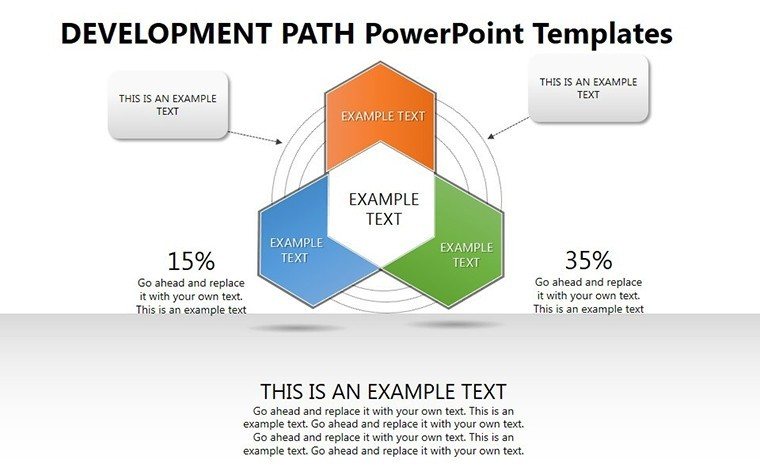
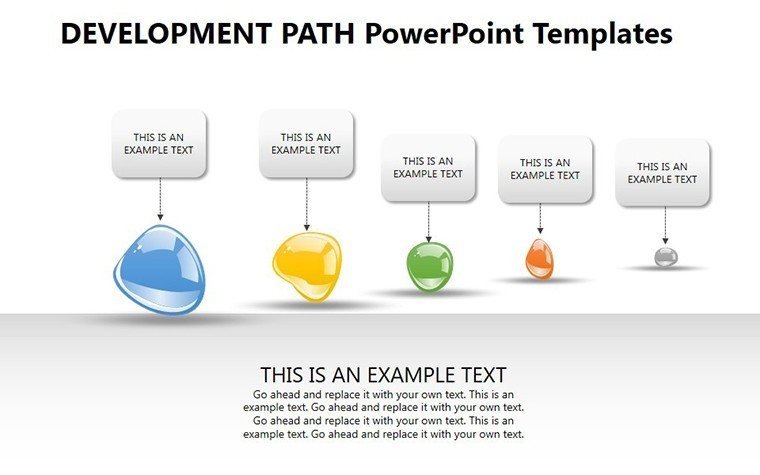
- Data Visualization Tools: Transform spreadsheets into engaging graphs.
- Collaboration Enhancers: Elements for showing interdepartmental links.
- Broad Compatibility: Effortless use across major presentation platforms.
These empower you to create presentations that not only inform but motivate, as noted by users in growing design studios.
Applying the Template in Everyday Architecture
For a new office expansion, map out team growth using these charts, highlighting roles in business development versus design. In educational contexts, like workshops at the Royal Institute of British Architects, it's perfect for demonstrating firm evolution. Consultants use it to advise on restructurings, such as integrating tech teams for BIM advancements, fostering better project outcomes.
Guide to Implementing Your Organizational Vision
- Import the template and choose a structure slide.
- Add firm data: Names, roles, and reporting paths.
- Customize aesthetics: Align colors with brand guidelines.
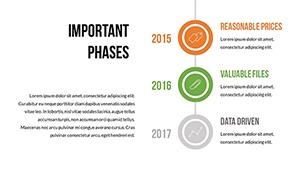
- Enhance with visuals: Include org chart evolutions over time.
- Present and iterate: Gather input for refinements.
This method streamlines planning, reducing misalignment risks.
Outperforming Generic Organizational Tools
Basic PowerPoint lacks the depth this template offers, with pre-built tables that handle complex interdependencies far better. It's superior to free versions, providing polished, watermark-free outputs ideal for high-stakes pitches.
Tips from Industry Leaders
- Highlight key roles: Use bolding for leadership positions.
- Show scalability: Include growth projections in charts.
- Foster inclusivity: Map diverse team contributions.
- Integrate metrics: Add KPIs for development goals.
- Update regularly: Reflect changes post-project reviews.
These practices can elevate your firm's operational excellence.
Build Your Future - Get Started Today
This template is your blueprint for organized growth. Acquire it now to chart a path to architectural prominence.
Frequently Asked Questions
How flexible are the hierarchies?
Fully adjustable to accommodate any firm size or structure.
Compatible with collaborative tools?
Yes, works great in Google Slides for team edits.
Can I import data from Excel?
Absolutely, for quick population of charts.
Are updates included?
Lifetime access to any template enhancements.
Suitable for startups?
Perfect, scalable from small teams to enterprises.