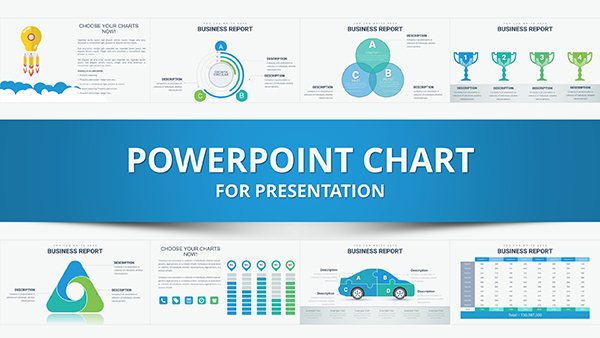
Knowledge PowerPoint Charts Template: Bring Data to Life


Knowledge is power, but only when it's presented effectively. Our Knowledge PowerPoint Charts Template empowers you to do just that, with 11 versatile, editable slides that turn raw information into compelling narratives. Ideal for corporate analysts, educators crafting lessons, researchers unveiling findings, or students polishing projects, this template simplifies visualization. From quarterly reports to academic theses, it addresses the challenge of making dense data digestible, fostering better decision-making and learning outcomes. Inspired by data visualization pioneers like Edward Tufte, it prioritizes clarity over clutter, helping you avoid common pitfalls like overcrowded slides that dilute your message.
In today's data-driven world, visuals can boost comprehension by 400%, according to the Wharton School of Business. This template leverages that, offering tools to highlight trends, comparisons, and distributions without overwhelming your audience.
Essential Features for Dynamic Presentations
Compatible with PowerPoint and Google Slides, the template features neutral yet engaging color schemes - grays for neutrality, accents in teal for emphasis. Fonts are clean and professional, ensuring legibility even in printed handouts.
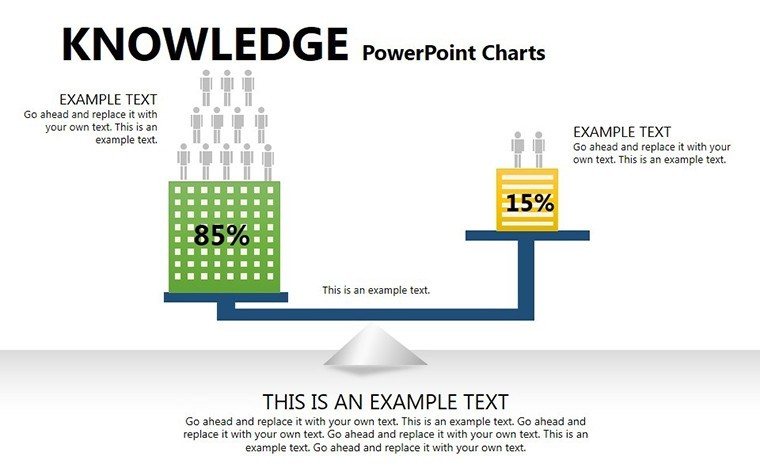
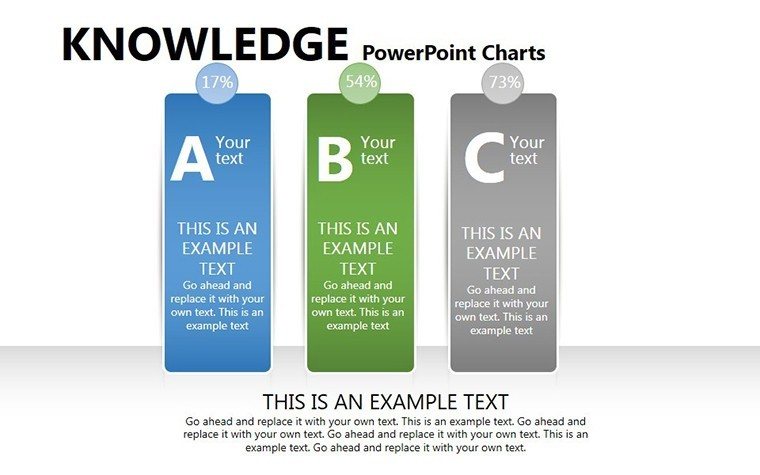
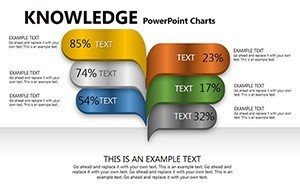
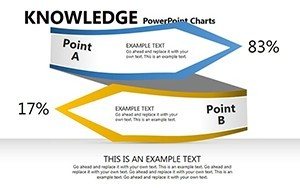
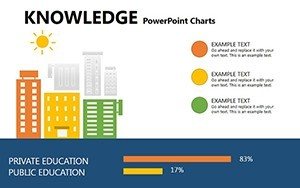
- Customizable Bar and Pie Charts: Easily input data to show proportions or growth, with options for 3D effects or flat designs.
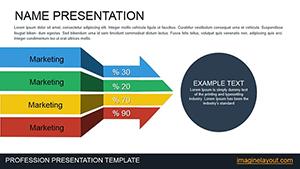
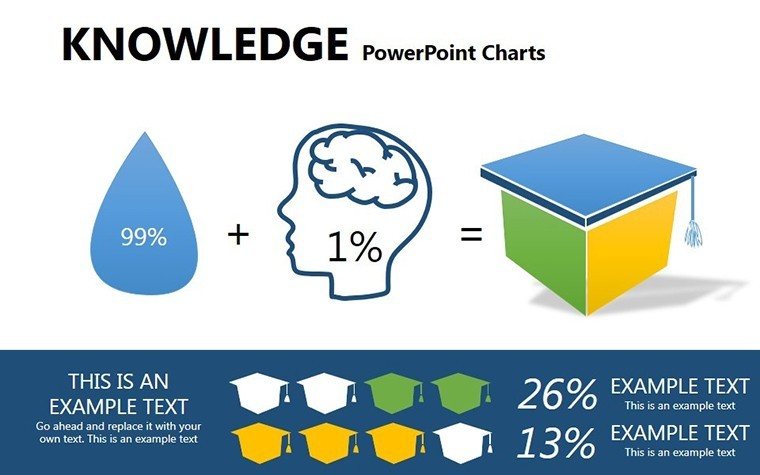
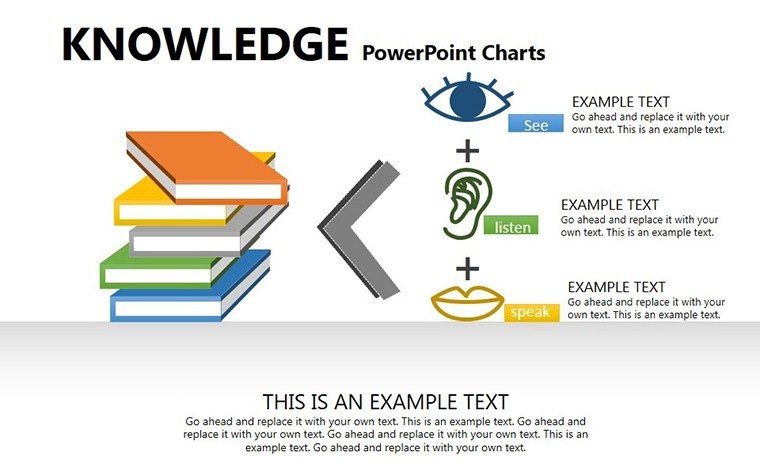
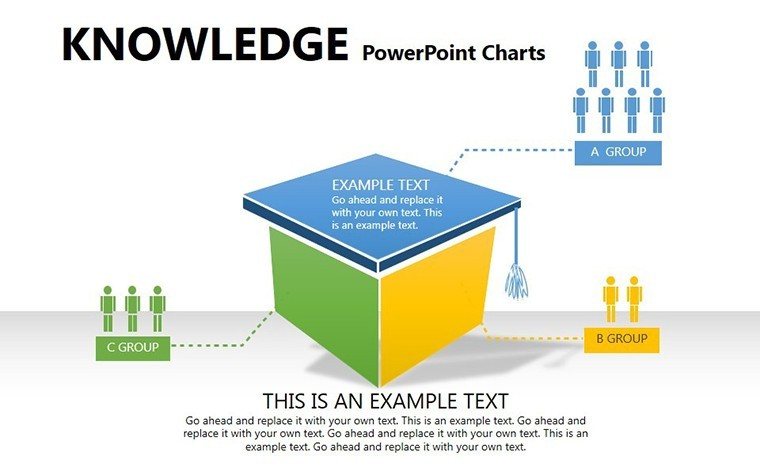
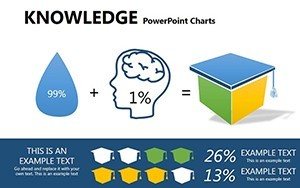
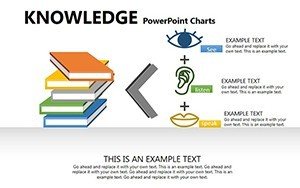
- Infographic Integration: Embed icons for concepts like bulbs for ideas or gears for mechanisms, all scalable.
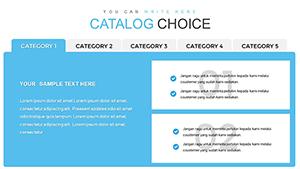
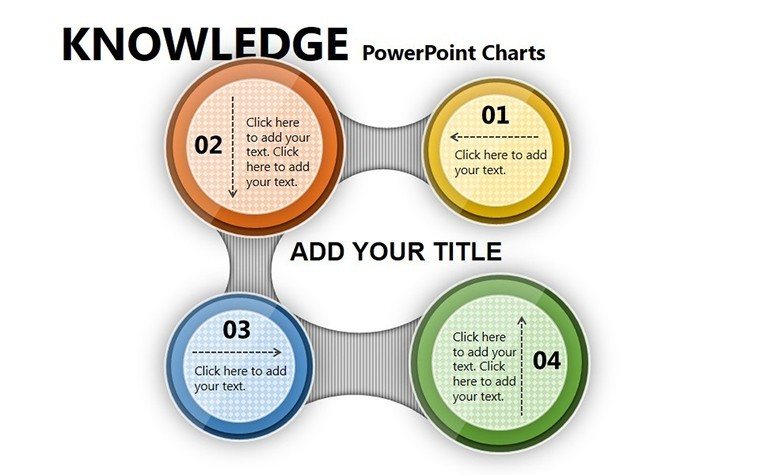
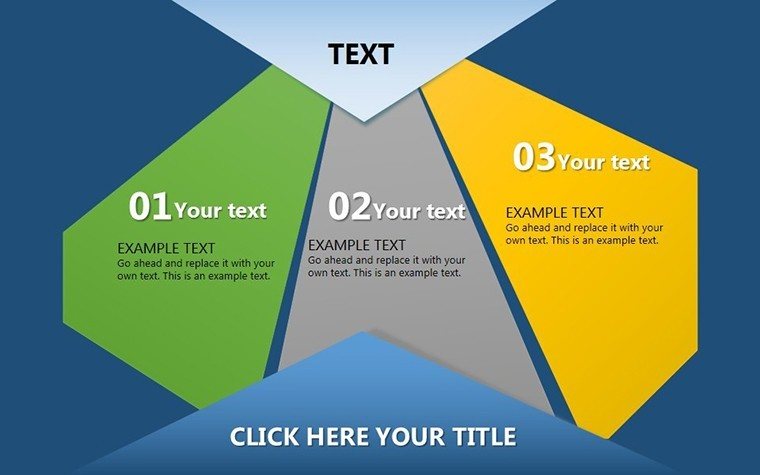
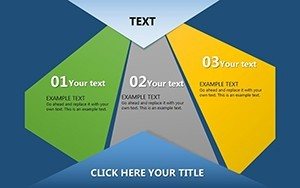
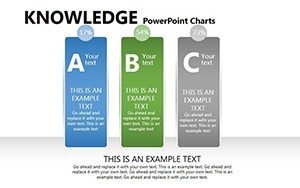
- Varied Layouts: From simple single charts to dashboards combining multiple visuals for holistic views.
- User-Friendly Edits: Drag-and-drop interfaces make customization intuitive, no design degree needed.
Outshining basic templates, it includes pre-built legends and axes labels, streamlining your workflow.
Diverse Applications with Step-by-Step Guidance
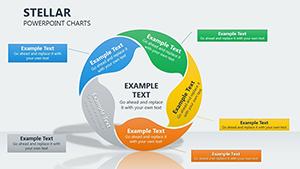
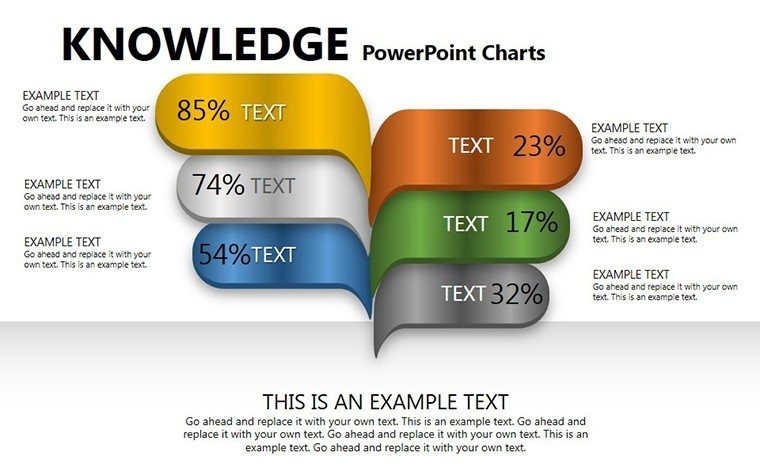
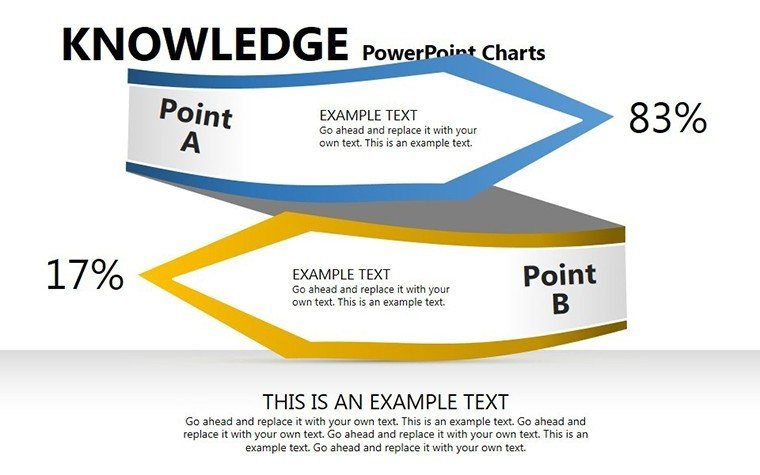
For a sales manager, use Slide #2's pie chart to break down market shares. Customize segments with company data, add tooltips for details, and present to executives for strategic insights.
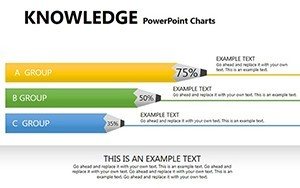
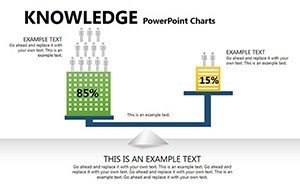
- Academic Lecture: Slide #4's bar graph compares research variables; input stats from studies, annotate with sources for credibility.
- Research Symposium: Employ Slide #6's combo chart for multifaceted data, like trends over time with overlaid predictions.
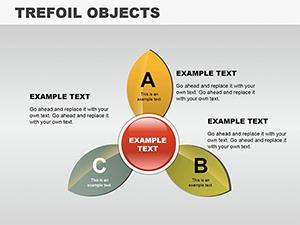
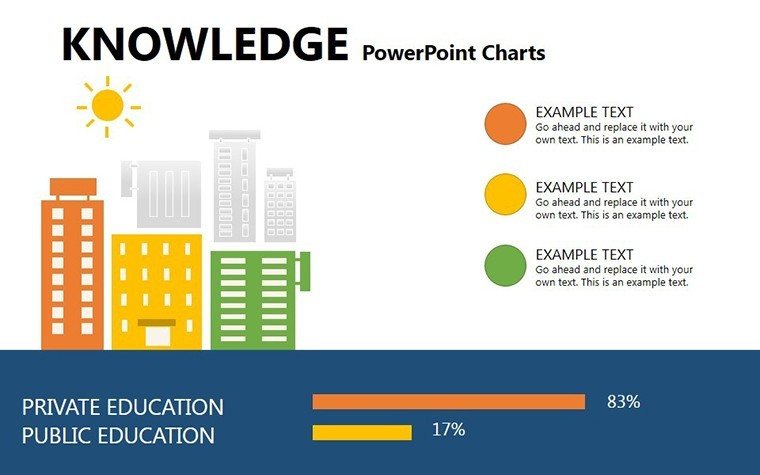
- Student Assignment: Slide #9's infographic maps knowledge flows, perfect for mind-mapping essays.
In a real-world example from a non-profit, using analogous charts clarified donor impact, increasing contributions by 15% through transparent reporting.
Insider Tips to Enhance Your Charts
Apply color theory: Use contrasting hues for key data points. For accessibility, add alt text to images, like 'Bar chart showing annual knowledge growth metrics.' Integrate with tools like Tableau for advanced imports.
Simple integration: Open, edit data, refine aesthetics, rehearse, and deliver. This template turns information overload into insightful stories.
Step up your game - download this Knowledge PowerPoint Charts Template now and illuminate your ideas.
Frequently Asked Questions
- How do I customize the charts?
- Select the chart, edit data in the linked sheet, and adjust styles via the menu.
- Is it compatible with older PowerPoint versions?
- Yes, works with PowerPoint 2010 and later.
- Can I add my own infographics?
- Sure, insert and align with existing elements for seamless integration.
- What if my data is complex?
- Use multi-chart slides to layer information without clutter.
- Are there export options?
- Export to PDF, JPEG, or video for versatile sharing.