Dimension Your Designs: 3D Stage Cyclic PowerPoint Charts for Immersive Impact


Type: PowerPoint Charts template
Category: Cycle
Sources Available: .pptx
Product ID: PC00229
Template incl.: 24 editable slides
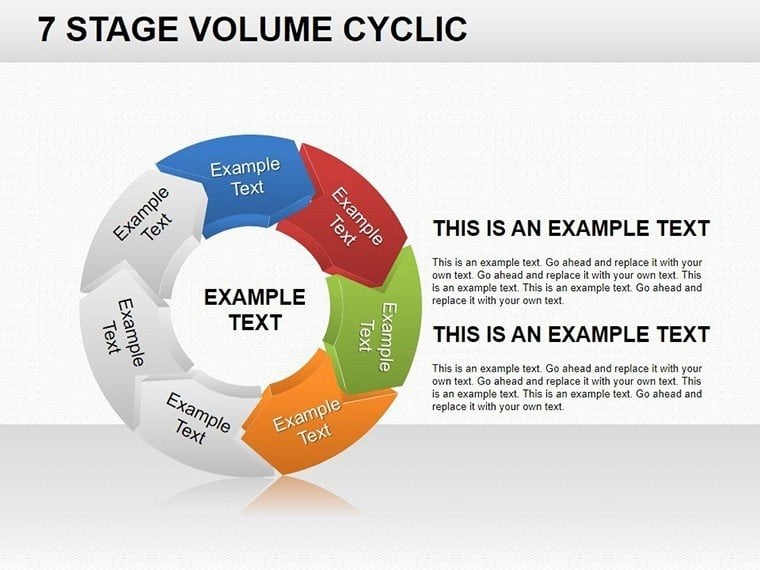
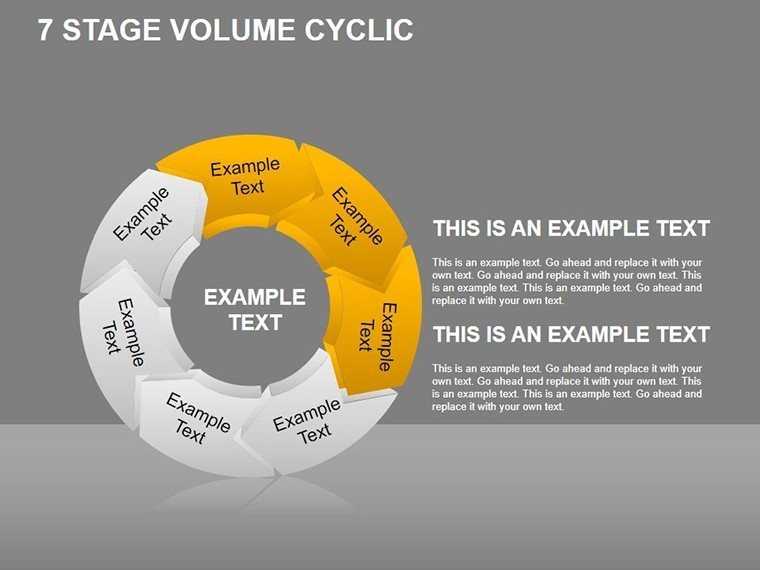
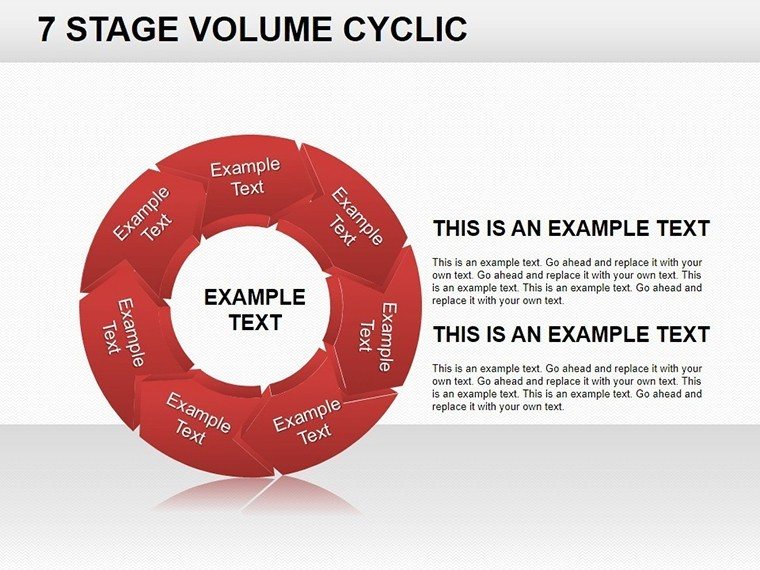
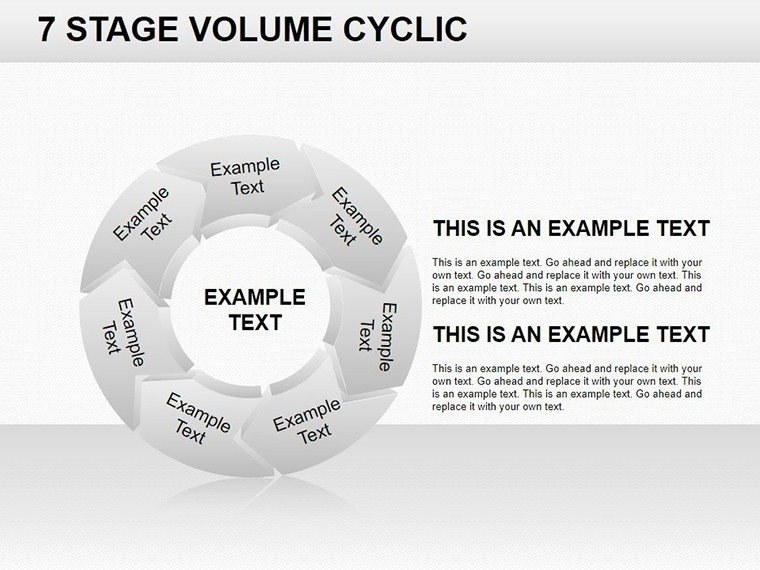
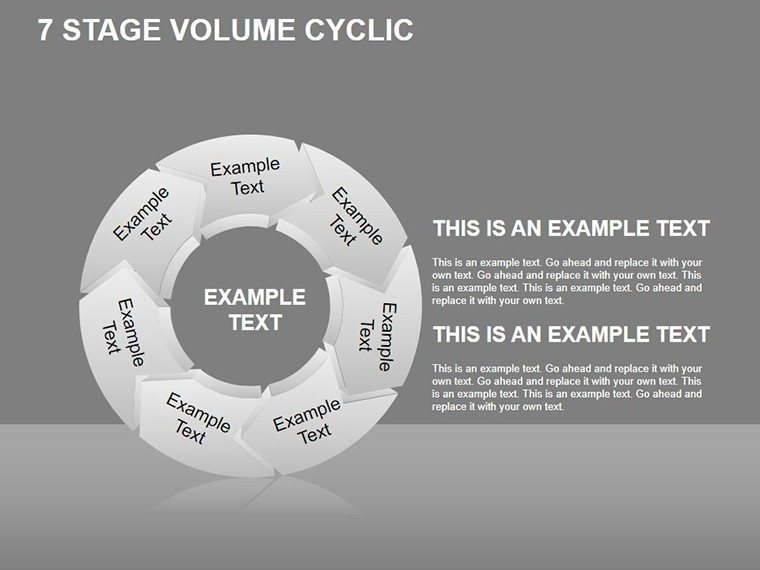
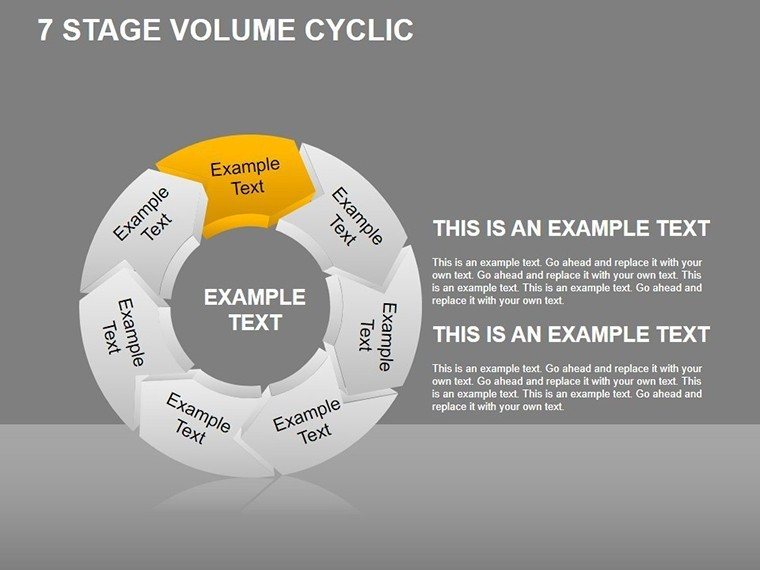
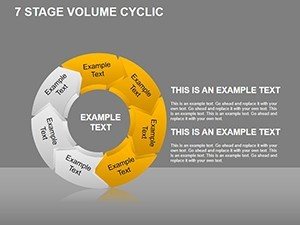
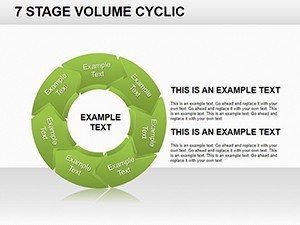
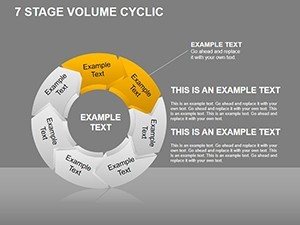
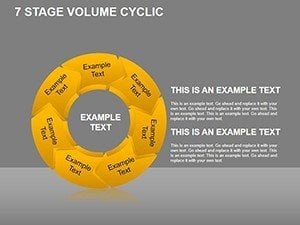
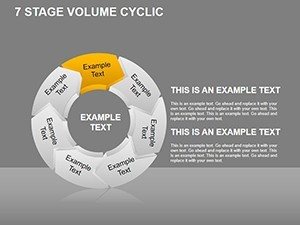
Why settle for flat when architecture demands depth? ImagineLayout's 3D Stage Cyclic PowerPoint Charts Template brings volumetric vitality to your slides, with 24 editable masterpieces that render cyclic stages in mesmerizing 3D, perfect for architects illustrating phased evolutions from subterranean foundations to crowning spires. This isn't decoration; it's a dimensional dialogue, where project milestones emerge in layered relief, helping you convey the volumetric interplay of spaces in a mixed-use tower or the cyclic rebirth of a brownfield site.
Think of it as your virtual model shop: Slide 5's isometric cycle explodes into view, volume-shading distribution phases to forecast spatial efficiencies - ideal for VR-pitch hybrids. PowerPoint-optimized for shadow and bevel effects, it meshes with SketchUp exports, updating 3D rotations live during critiques. Whether you're a visionary pushing parametric facades or a coordinator cycling through value engineering, this template adds the third dimension to your discourse, making abstract cycles palpably profound and proposals irresistibly persuasive.
Echoing advancements in computational design (as explored in ACADIA proceedings), it liberates you from 2D drudgery, infusing presentations with the spatial literacy that defines great architecture. Your cycles gain gravity, pulling viewers into the build's beating heart.
3D Features That Build Dimensions
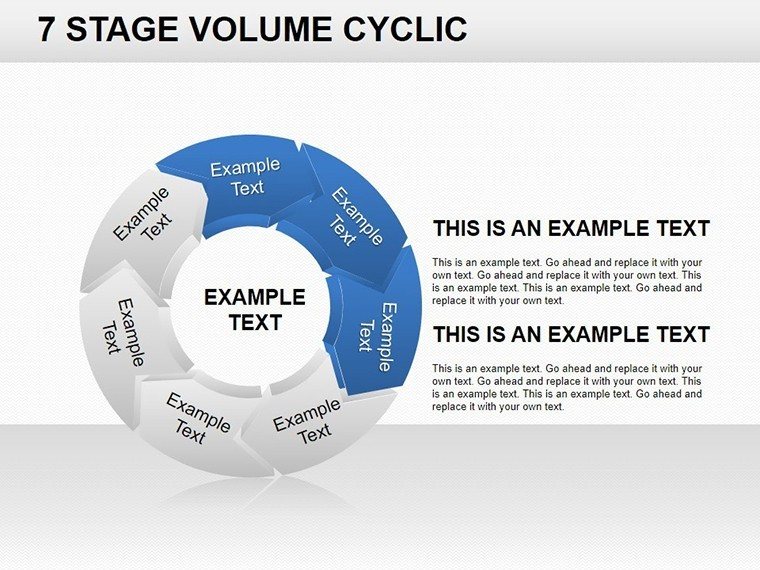
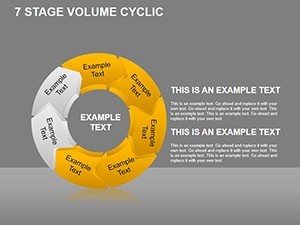
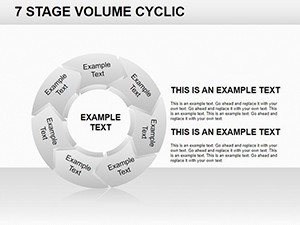
The template's 24 editable slides stack depth upon depth: Slide 1 orbits a global cycle sphere, while Slides 11-16 extrude stage volumes into prismatic progressions reminiscent of sectional studies.
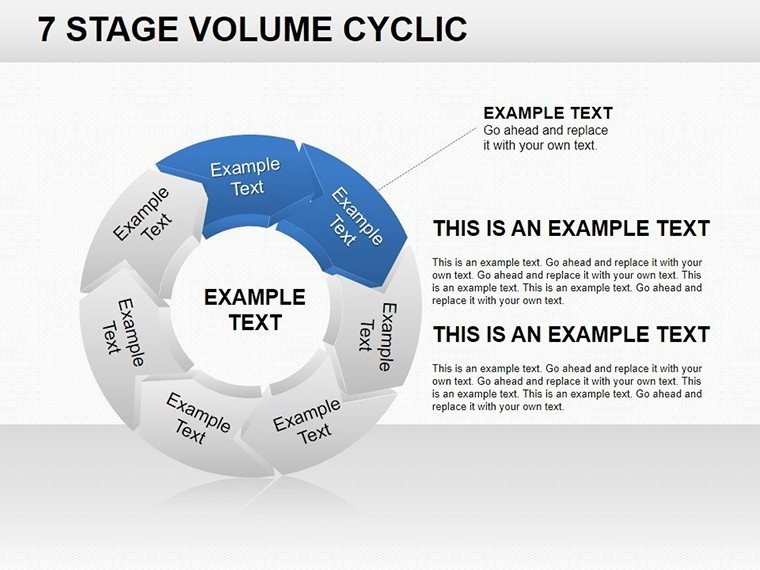
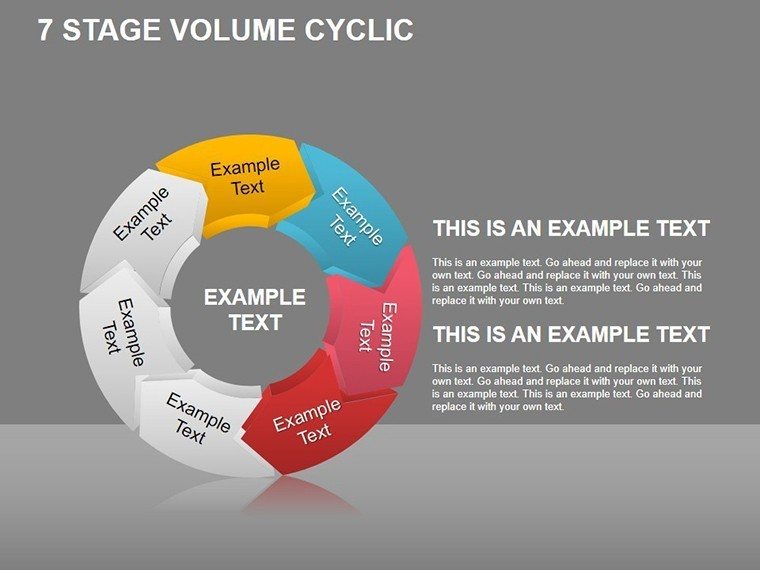
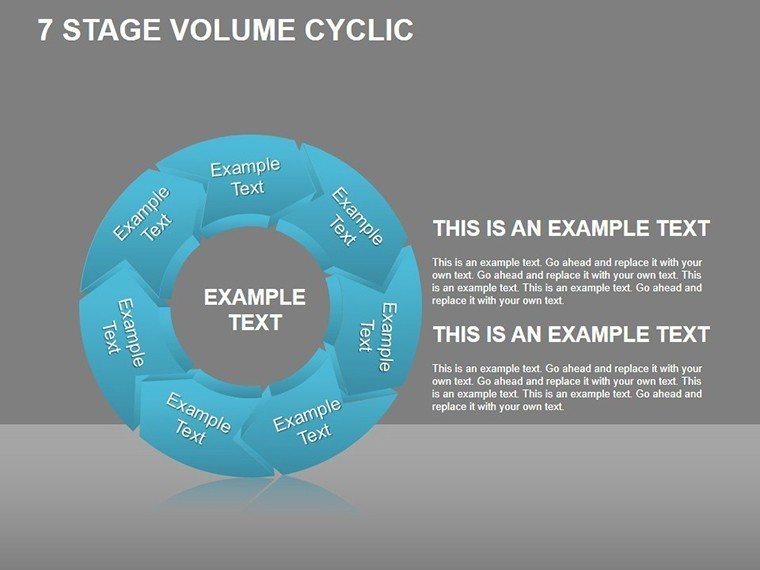
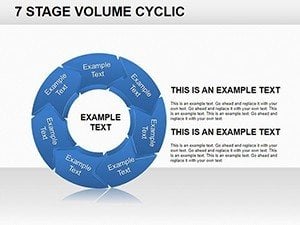
- Multifaceted 3D Charts: Rotatable cylinders and spheres for interlinked processes, shadowed to mimic light studies on models.
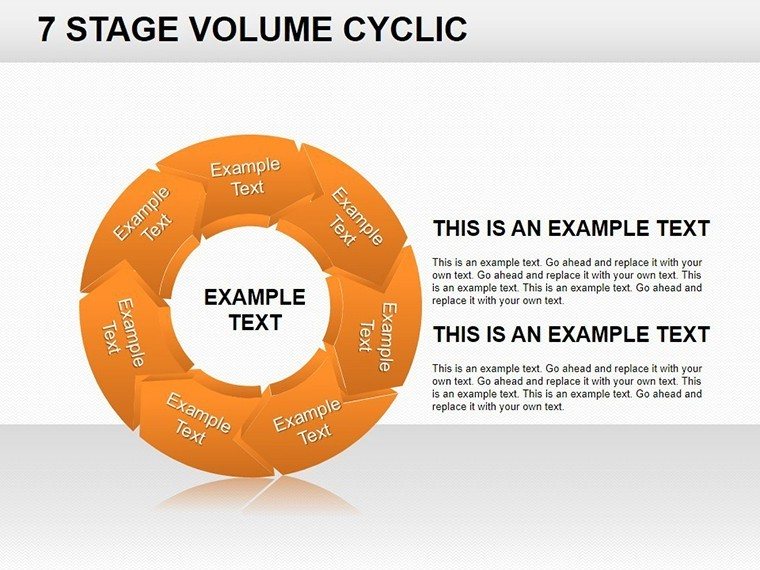
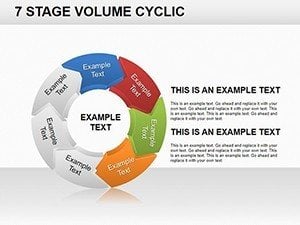
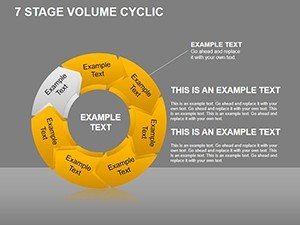
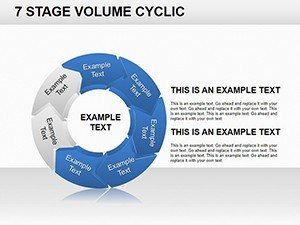
- Palette Precision: Chromatic gradients that depth-charge your brand - metallic sheens for structural steel cycles or translucent veils for glass curtain walls.
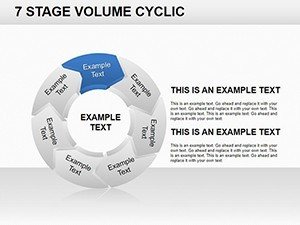
- Dynamic Visualization: Morphing extrusions link data to form, auto-adjusting for progressive stage swells.
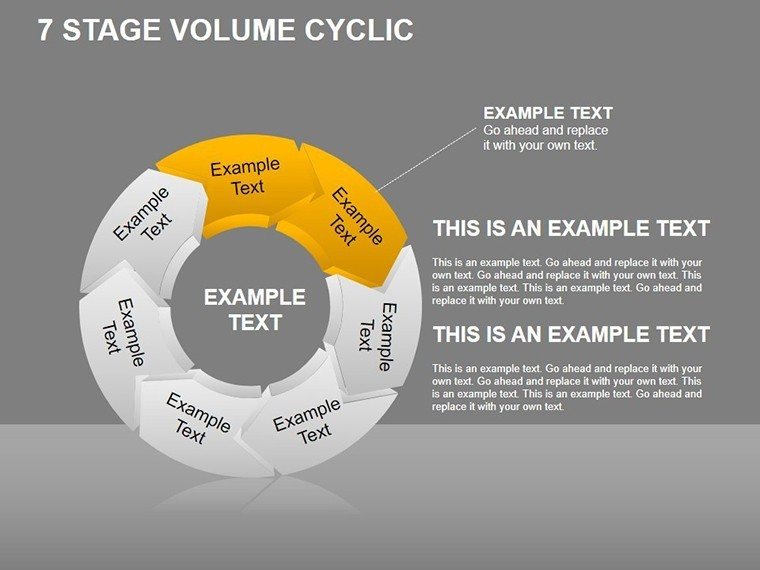
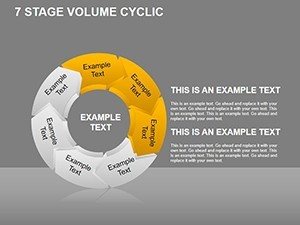
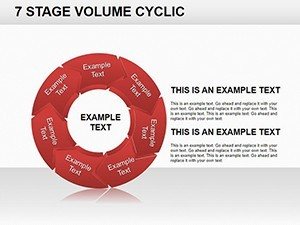
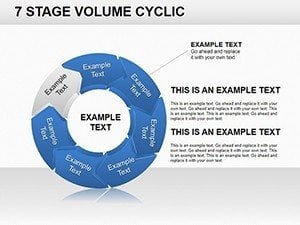
- Stage-Specific Adaptability: From micro-milestones to macro-phases, scaling for biennial masterplans.
Superior to flat cyclic defaults in PowerPoint, this 3D prowess - channeling constructivist geometry - lends your data the solidity of a load-bearing narrative.
Layered Landscapes: Architectural 3D Cycles in Action
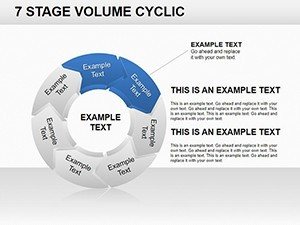
Real renders: A Miami firm volumized hurricane-resilient cycles on Slide 18's helical chart, depth-cueing re-accumulation layers to win FEMA nods. Or a Tokyo atelier cycled seismic retrofits, using extruded threats to dimension opportunity vectors, captivating international juries.
- Milestone Mapping: 3D bars stack workflow dynamics, beveling delays for visual urgency.
- Growth Trajectories: Spherical oscillations chart market rhythms, textured for material analogies.
- Pedagogic Projections: Instructors extrude lesson cycles, fostering spatial intuition in studios.
Pro move: Tilt views with PowerPoint's 3D viewer for interactive spins, emulating model turntables in remote sessions.
Extrude to Excellence: Customization Cascade
Launch the .pptx, engage 3D tools: Step 1: Feed stage data for auto-extrusion. Step 2: Rotate and shade via Format pane. Step 3: Sequence morphs for cinematic reveals, rendering MP4s for broader outreach. This process, vetted by parametric pros, assures dimensional fidelity.
Depth Charge Your Deliverables
Surveys show 50% deeper retention with 3D visuals (per AIA tech reports). It's the volume your visions volume. Acquire the 3D Stage Cyclic PowerPoint Charts Template immediately and let depth define your designs.
Frequently Asked Questions
How realistic are the 3D effects?
Powered by PowerPoint's native 3D models, they rival basic renders with adjustable lighting and perspectives.
Can cycles be non-linear?
Yes, bezier paths allow irregular loops, suiting adaptive architectural evolutions.
Integration with CAD?
Import OBJ previews for hybrid charts, blending native 3D with imported geometry.
Performance on older hardware?
Optimized for smooth playback; simplify meshes if needed via built-in toggles.
Suitable for print?
Flatten to 2D views for crisp vectors, preserving depth cues in grayscale.