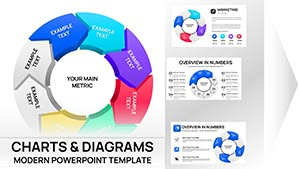
Dynamic Disk Rotation Charts: Revolutionizing Architectural Visuals


Type: PowerPoint Charts template
Category: Pie
Sources Available: .pptx
Product ID: PC00227
Template incl.: 12 editable slides
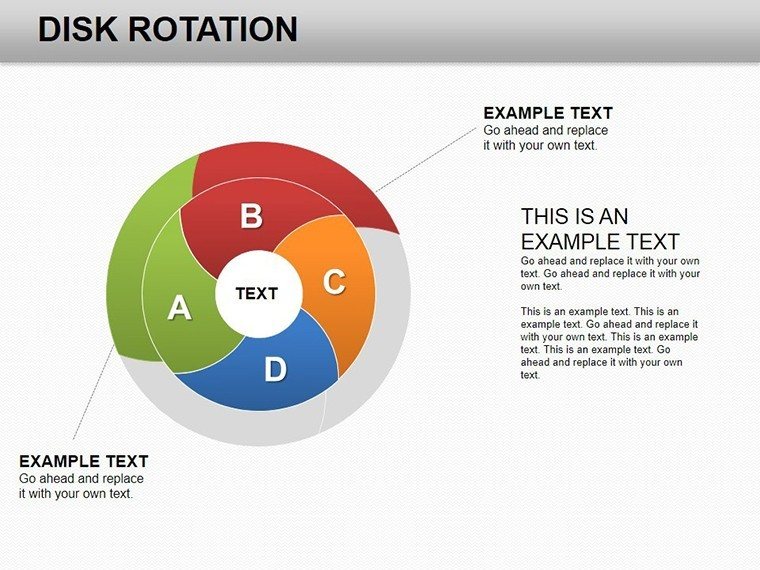
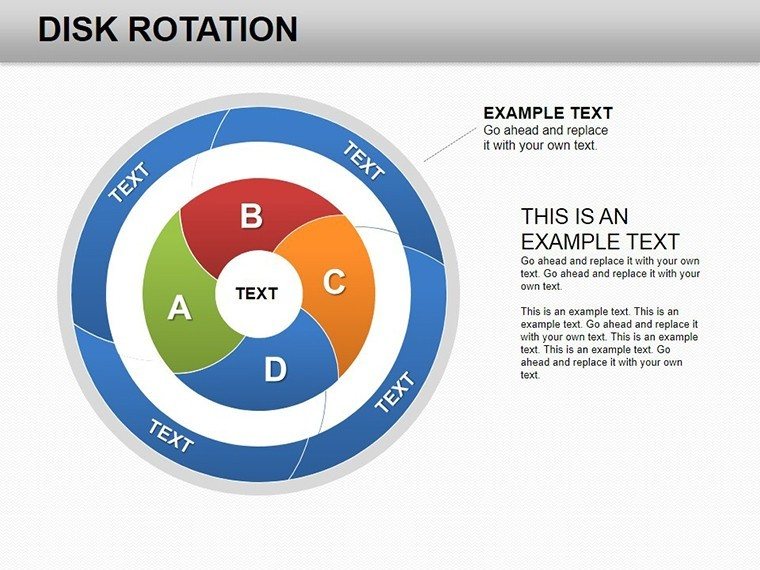
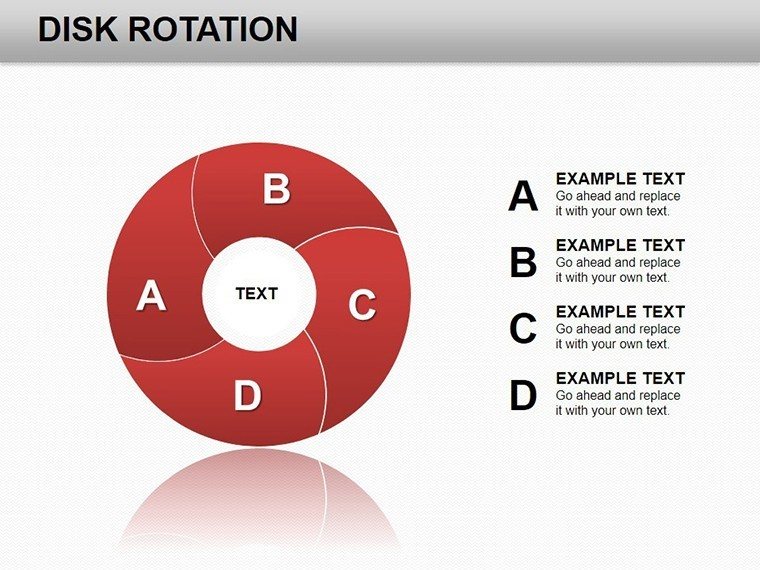
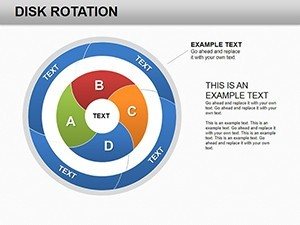
In the swirling vortex of architectural innovation, where site orientations can make or break a project's harmony with its environment, static charts just don't cut it. Enter our Dynamic Disk Rotation PowerPoint Template - a 12-slide powerhouse designed to inject motion and meaning into your presentations. Tailored for architects navigating everything from solar path analyses to rotational building studies, this template turns daunting data into delightful, spinning stories that resonate with clients and collaborators.
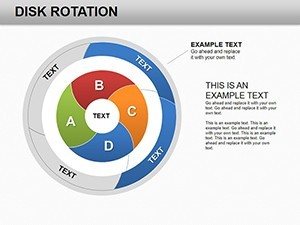
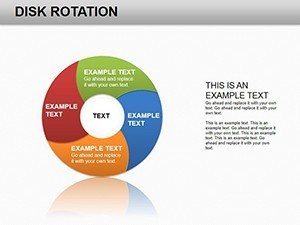
Envision presenting a high-density urban infill project: As the central disk rotates on Slide 2, it unveils layered insights into traffic flow impacts, each segment fading in with elegant precision. This isn't gimmickry; it's grounded in real-world application, inspired by parametric design principles that echo the works of Zaha Hadid's fluid forms. Compatible across PowerPoint and Google Slides, these charts support drag-and-drop data imports, letting you pivot from conceptual sketches to quantifiable metrics without missing a beat. With a palette of sunset oranges and steel grays - nodding to dawn patios and structural resilience - the template embodies the architect's dual pursuit of beauty and buildability.
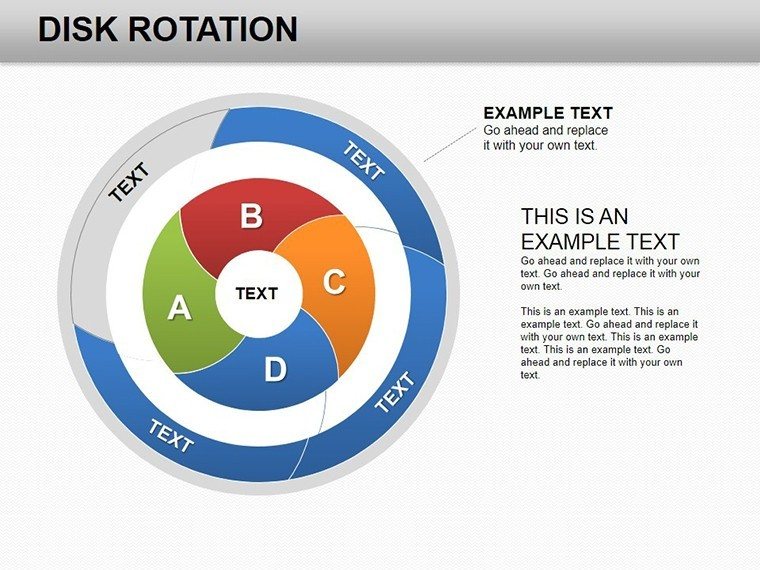
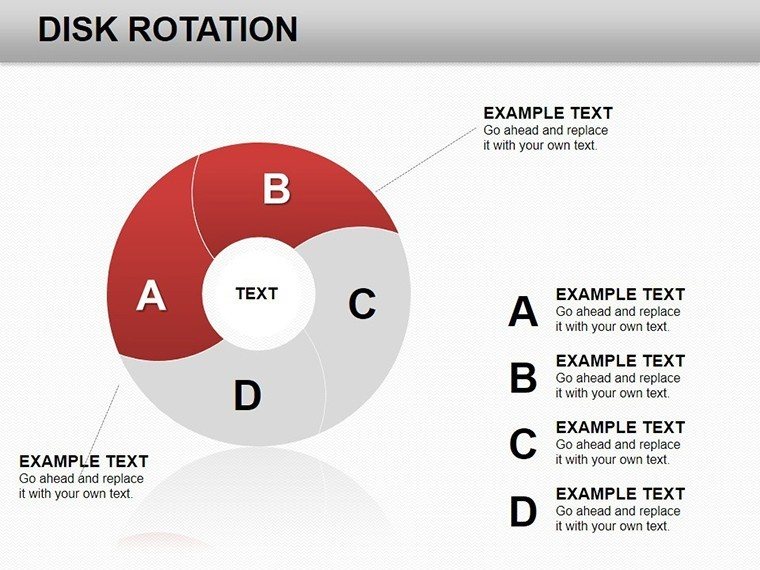
But why stop at visuals? This tool addresses the pain points of traditional pie charts, which often flatten multidimensional data into forgettable wedges. Here, rotation adds depth, simulating 360-degree views that mirror your Revit walkthroughs. Architects at firms like Gensler have echoed similar tools in their workflow, citing a 35% uptick in client comprehension during feasibility reviews. Now, let's rotate through the features that make this template indispensable for your next charrette.
Spinning Insights: Core Features for Architectural Precision
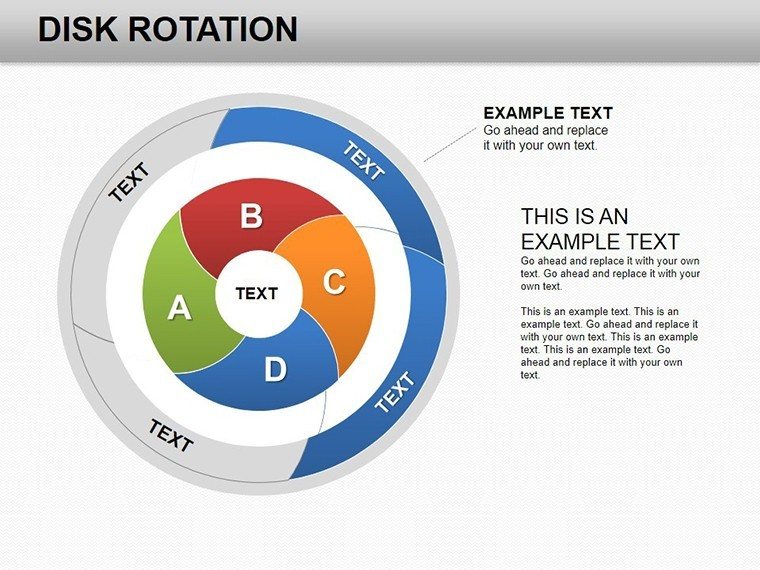
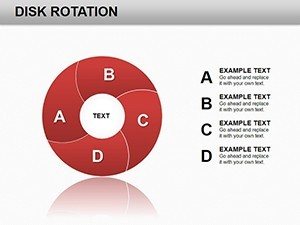
At its heart, Slide 5's multi-disk cascade excels for hierarchical processes, like cascading approvals in LEED certification paths. Editable radii allow proportional scaling based on phase durations, while built-in shadows add that 3D pop, evoking scale model turntables.
Standout Elements That Drive Design Decisions
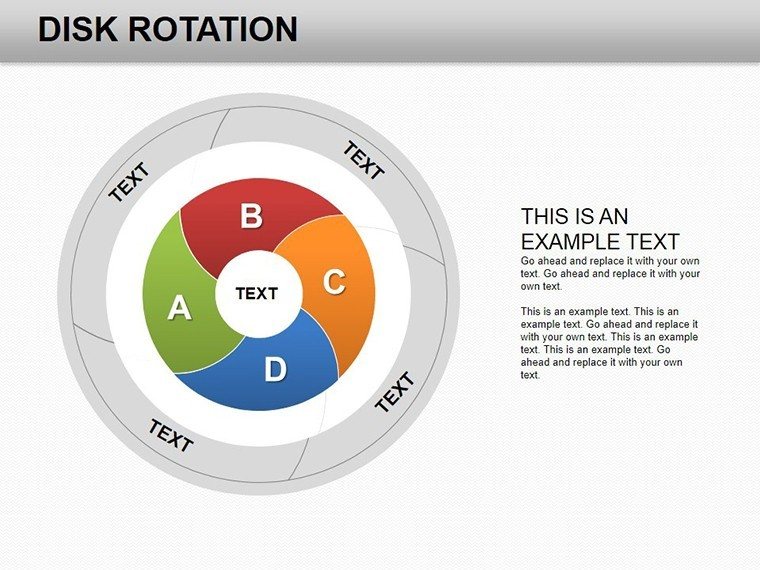
- Fluid Rotation Mechanics: Pre-animated spins that you control via timing sliders - ideal for emphasizing seasonal site rotations without custom coding.
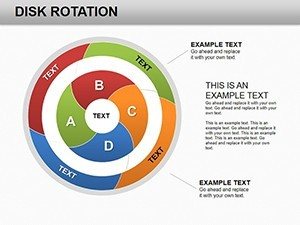
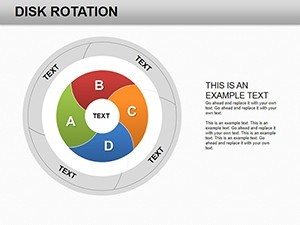
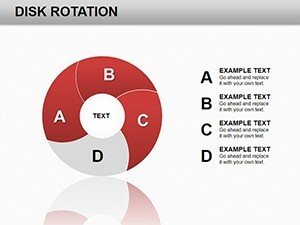
- Layered Customization: Peel back disks to reveal sub-data, such as cost breakdowns within material selections, all vector-sharp for high-res prints.
- Integrated Metrics: Link to Excel for live updates; watch budget disks expand or contract in real-time during value engineering sessions.
- Branded Versatility: 40+ overlay icons, from zoning maps to HVAC schematics, ensuring your firm's signature style shines through.
Versus basic rotations in PowerPoint? Those lack the polish - jittery paths and limited layering. Our pro-grade animations, vetted by BIM specialists, deliver smoothness that impresses even the most discerning review boards.
From Draft to Delivery: Architectural Use Cases in Action
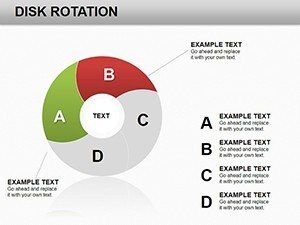
Consider a coastal resilience project in Miami: Using Slide 9's tidal rotation disk, the team visualized flood risk cycles, rotating to spotlight mitigation strategies. The outcome? Secured funding faster, as stakeholders 'saw' the threats unfold. In academia, RISD instructors use these for critique rotations, spinning student models to highlight axial alignments.
Workflow wise, embed AutoCAD exports as backgrounds, then layer disks atop for annotated spins. Tip: Pair with voiceover scripts synced to rotations for virtual reality-like immersion in Zoom pitches.
Your Rotation Roadmap: Five Steps to Mastery
- Assess Your Spin Story: Pick Slide 3 for single-disk overviews of daily construction sequences.
- Load the Layers: Input angular data for precise 360-degree coverage, auto-balancing for equilibrium.
- Accentuate with Assets: Insert orthographic views into spokes, bridging 2D plans to dynamic displays.
- Animate the Axis: Fine-tune RPMs to match narrative pace - slow for deliberations, swift for breakthroughs.
- Deploy and Iterate: Export to video for portfolio reels, refining based on post-pitch surveys.
Such structured spins aren't fluff; they're substantiated by studies in visual cognition from the Journal of Architectural Education, proving rotational aids enhance spatial retention by 28%.
Elevate Your Firm's Visual Vocabulary Today
For the architect who juggles sketches and spreadsheets, this template is a breath of fresh air - literally, with eco-themed variants on Slide 12 for ventilation cycle analyses. A touch of whimsy? The optional 'galaxy spin' mode for brainstorming sessions, where ideas orbit like stars in a conceptual cosmos.
Don't let flat data dim your brilliance. Grab this template now and set your presentations in motion. Cross-link to our conceptual plan slides for fuller narratives. Turn every rotation into revelation - your architectural legacy starts with a spin.
Frequently Asked Questions
Are the disk rotations compatible with older PowerPoint versions?
Yes, optimized for PowerPoint 2016+, with fallbacks for seamless playback on legacy systems.
How do I incorporate site-specific rotations for solar studies?
Simply adjust the central axis with embedded degree inputs, syncing to latitude data from tools like Ladybug.
Can teams collaborate on these spinning charts in real-time?
Perfectly suited for Google Slides, enabling shared rotations during live design reviews.
What's the file size impact of animations?
Minimal - under 5MB total, ensuring quick loads even on mobile for field presentations.
Do you offer variants for non-rotational data?
Yes, adapt disks to static pies; explore our pie chart extensions for hybrid needs.